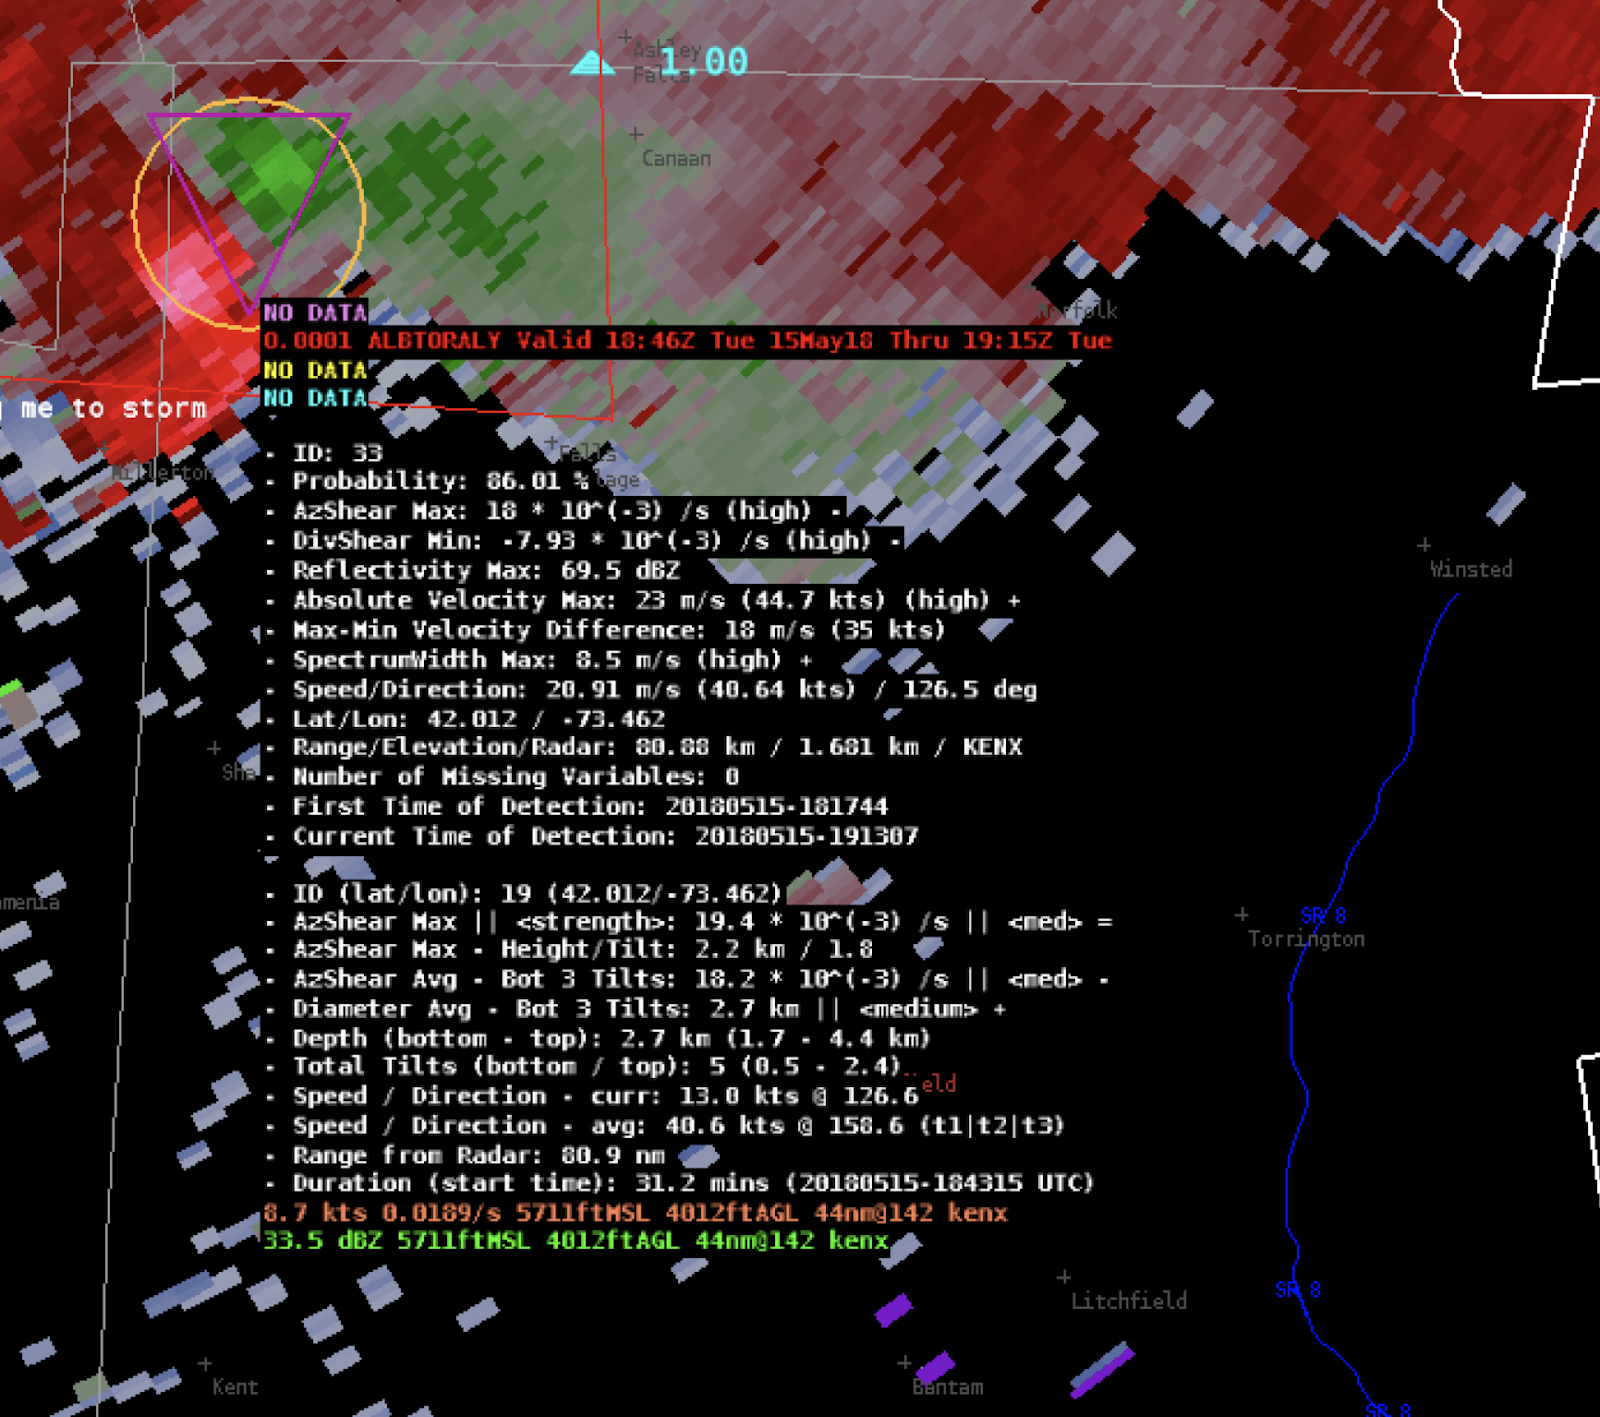
The readouts for the NMDA & NTDA are one of the biggest improvements for these products. It adds the objective analysis I would want out of these products with users ability to (1) pull them up at will thus reducing screen real estate and (2) has them linked to each individual storm/icon so I can easily relate the objective analysis to the storm under investigation. The 1 advantage of a table format highlighting the most intense circulations are solved with color attributes of the icons, which is better in my mind because it relates the severity of the rotational signatures to climatology versus a ranking of storms on any given day.
The drawback of the readouts is that size and the massive amount of information thrown out at once, there is so much in these tables that it’s hard to point out any one thing to follow. In my opinion, each readout should be cut in half to optimize the deluge of information. In addition, the value behind multiple fields should be combined where possible and some organization can help cut down on redundancies between titles thus reducing the amount of space in the product descriptions. For example:
…etc. While I wouldn’t advocate for all these fields, this could be a more organized way to organized the information in the NMDA, that would allow user to find information faster. If awips can handle Unicode, special arrows could also be used as symbols.

–#ProtectAnd Dissipate
