An official website of the United States government
Here’s how you know
Official websites use .gov A
.gov website belongs to an official government
organization in the United States.
Secure .gov websites use HTTPS A
lock (
) or https:// means you’ve safely connected to
the .gov website. Share sensitive information only on official,
secure websites.
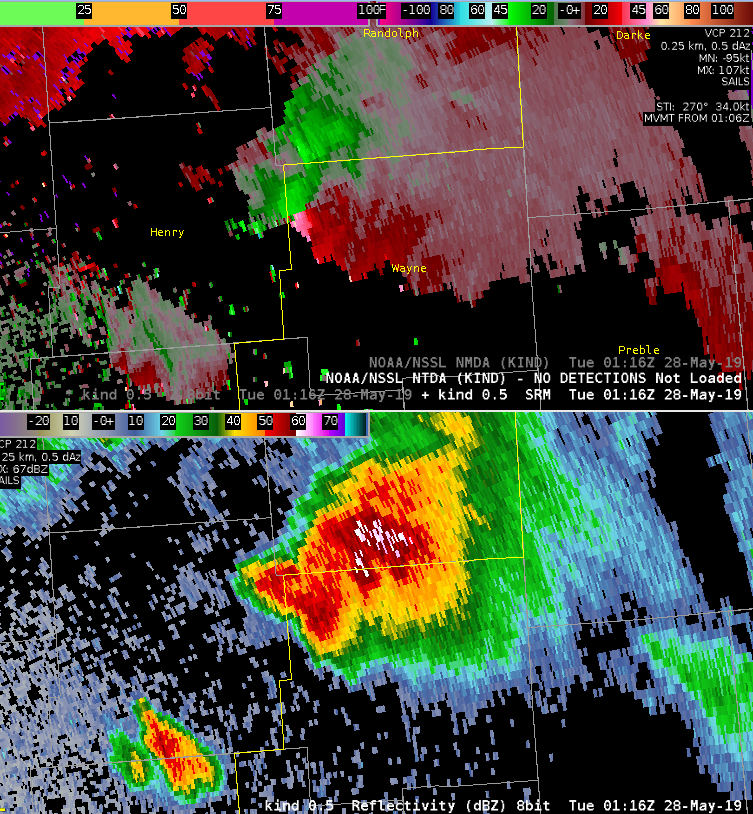
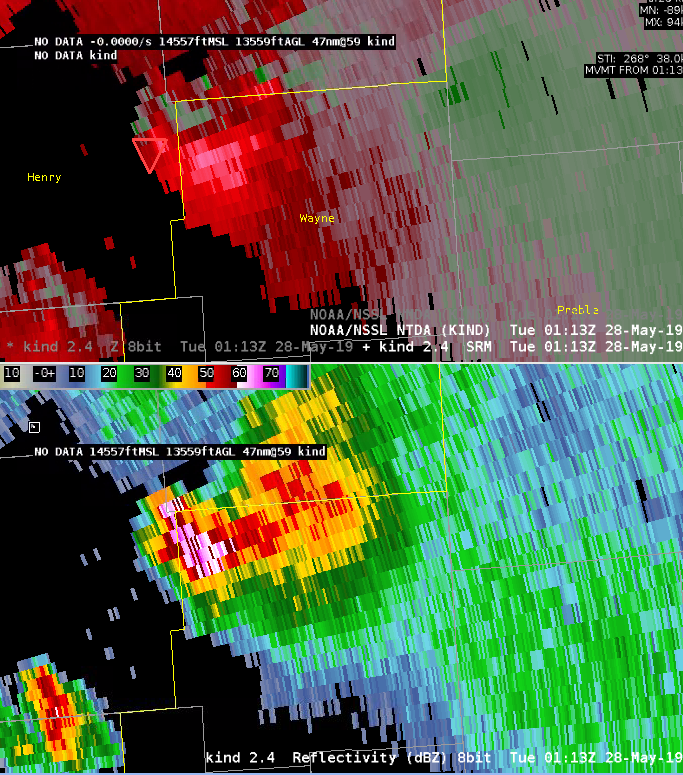
We see a case where the TDA is inconsistent in time, likely due to noisy velocity, KIND 28May2019 at 0116Z Wayne County, likely due to vertical velocity data smearing.
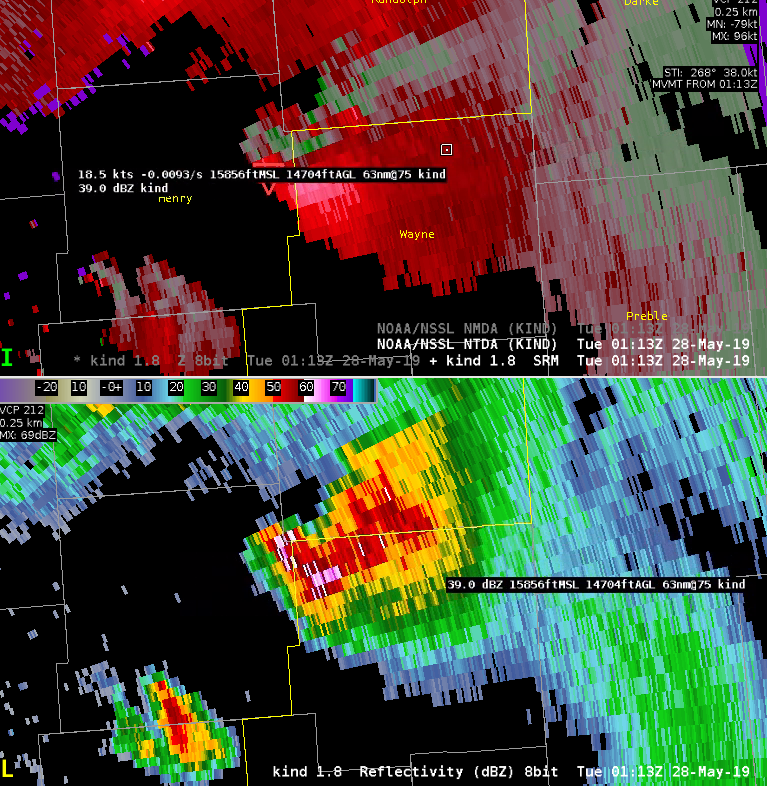
Velocity data smearing on the 0.5 degree tilt (likely originating fomr the 1.8 degree slice or higher).1.8 degree slice where data smearing is likely originating.
Here (below) we see the detection return and it’s impressive that it is assigned the same ID as before. This will help for creating time series of the features attributes. That’s good news. What’s less good news is we see a great setup for vertical data smearing as broad rotation with a 60+ dBZ core aloft is being aliased downward. There is no easy solution for this I’m afraid. Spectrum width is very high (>20 kt) and CC is ~ 0.8 or less so there is a possible flagl for degraded data quality. However, these values also could legitimately occur with a strong TDS.
NTDA performs well in mature supercell over ern IN. First time of detection to current time of detection over 1 hour indicative of long track of cell. Probs were over 90% for quite a few scans. Overlaid with prob severe, it is nice to see meso environment that the cell is embedded in.
Would be good to see some environmental data embedded in the algorithm to keep the screen less cluttered. Also, a total time of detection will be a good addition to the readout table.
A tornadic QLCS is moving through South Carolina. KGSP is running in SAILS2, producing three cuts at 0.2° for every volume scan. The NTDA algorithm is running off of the 0.5° slice, which is only running once per volume scan.
When NTDA is loaded on top of the 0.5° slice, it matches perfectly. However. When NTDA is loaded on top of the 0.2° slice, there are problems that cause the NTDA to drop out (NO DETECTIONS) at certain time steps, likely due to some kind of error with time matching.
No detections noted above on the 1857Z radar time stamp.Detections noted above on the 1859Z radar time stamp.
1936Z
A bowing segment in a QLCS is moving through western Newberry County, SC. This storm has a history of producing tornadoes, but it has not obviously done so in at least a half hour now. The NTDA algorithm is displaying relatively high values (>50%) from two different radars — KGSP (about 4000 feet AGL) and KCAE (about 2500 feet AGL). This is absolutely the type of area of the storm where you would look for tornadogenesis (north of the apex of the bow, following the three ingredients method). However, it is interesting to note that these probabilities are quite high, despite the fact that neither radar is truly depicting a tight gate-to-gate circulation. In a real time event I would likely be issuing a tornado warning for this, as tornadogenesis seems quite favored in this region of the storm, but the probabilities on the NTDA are a little higher than I would expect given that I think it’s more likely than not that the storm is not currently producing a tornado.
NTDA detection on KGSP.NTDA detection on KCAE.
1944Z
This is an update on the area of interest mentioned in the above post. It was noted that the NTDA feature on the KCAE radar (ID: 3) has shifted somewhat southward, to a different part of the bowing segment (closer to the apex) while updating the probability to >80%. The overall shear axis remains somewhat not-tight, which at first confused me as to the high probability. However, upon a closer look, there was a very small/tight couplet that developed just on the west edge of the shear axis, tight enough that I would suggest it could indeed be tornadic. It appears that the NTDA feature was keying off of this, and not on the overall shear axis, and I think this is excellent because it brought my attention to a small, hard-to-see feature.
NTDA detection on KCAE, >80% on the very small circulation.
2000Z
A semi-discrete cell is approaching the KCAE radar site at close range. This cell has produced an intense downburst signature, characterized by inbound winds as high as 65kts at less than 1000 feet AGL. Qualitatively, I can state fairly conclusively that this signature is a severe downburst, and is thus non-tornadic. However, the NTDA algorithm is keying in on the north end of this downburst signature as a potential tornado, with probabilities as high as 49%. This seems quite high for a weather situation that appears to have almost no chance to actually be tornadic. It is possible that the algorithm is noting that you have an area where strong inbound winds are located just south of weaker inbound winds, but to my eyes it is a soft transition, not indicative of rotation.
NTDA detection on KCAE, 49% on the north end of a downburst signature.
A strong circulation has developed in Dallas County, with Vr values of as much as 70-75 knots. Appropriately, the NTDA algorithm has identified a 99% chance that this is a tornado.
0216Z UPDATE
This feature appears to be a tornado based on base velocity analysis, but NTDA is assigning a probability of only about ~20%
Just after writing this post, an LSR of damage at this location was provided.
0224Z UPDATE
A small area of bad velocity data has been occasionally (but repeatedly) tripping off low-end NTDA detections near the KFWS radar site.
The detections have generally been <20% so in theory this could be easily ignored with a probability threshold.
At approx 0200Z, the NTDA depicted a 99% probability of a tornado and azimuthal shear rated as “extreme”. This was coincident with a CC drop on the 0.5 deg tilt and a BWER, which increased confidence that a tornado was occurring.
NMDA, NTDA, and tornado warning polygon for Dallas County storm
We noticed several instances this morning in the PIH forecast area where the NTDA algorithm would detect possible TOR’s over mountain and or hill peaks. This is common with the TVS algorithm and I wonder if there was some sort of rate of change filter that could be passed along to the RF model. It’s something that as a forecaster if you know your CWA well is easy to ignore but if there’s a way to filter those out it would be helpful. In the two examples shown below, the ridgetops in eastern/central Bingham county are easily shown to be the source of the NTDA at least in the 0.5 degree slice.
Example: Number NTDA objects being displayed over mountain tops.Example: Number NTDA objects being displayed over mountain tops with reflectivity. The NTDA objects in NW Bingham county appear valid however the objects to the south over central and eastern Bingham are related to terrain and not actual meteorological features.
See below at 22:13Z, at this time there were 18 detections from the NTDA algorithm.
NTDA algorithm icons at 22:13Z
Now before you go warning for a big bowing, comma-head shaped QLCS, taking a look at the velocity field below would show the vast majority of these detection were due to mountainous terrain and stable airmass turbulence. Only 1 detection was due to a potentially tornadic circulation. You can probably guess which one that is by the probability icon color, but in the subsequent scan that probability was reduced to sub-50% and fell back into the rest of the noise. Generally, forecasters may be good at filtering these false detections out in a highly severe environment, but in mountainous areas where severe weather is rare, it may be something forecasters discard before an event ever occurs.
Prior to 21:09Z, the NTDA algorithm was keying in on sidelobeing issues ahead of the storm, the the NMDA held strong indicating no rotation. At 21:09Z, a hook echo began to form with a solid rotational signature in a good dat region, and both algorithms picked up on the signature quickly. Using the objective analysis, seeing the NTDA put out a Probability >50% with the NMDA put out an Avg AZShear in the bottom 3 scans of 22.9 *10 ^-3 /s, helped add confidence to the decision to warn quickly.
KSFX @ 21:09ZKSFX @ 21:09Z
A couple times though (like at 21:15Z as seen below), the algorithms were still keying in on bad low-level data due to sidelobing from time to time. Velocity images compared to Correlation Coefficient show where more reliable data is located.
The NTDA tracked this tornado very well throughout its life cycle. However, there was an instance where the probability briefly decreased from approximately 95% to 67% around the time that the overall circulation and max az shear was strongest. It rose to 98% again on the following scan as the circulation weakened slightly. This can be seen in the velocity trends as well as the MRMS low-level rotation tracks.
A Severe Thunderstorm Warning was issued on a storm in Marshall County, IA with a much more robust storm further south in Marion/Mahaska Counties. After checking up on the southern storm, I did a quick check-in on the Z/V fields at 0.5 degrees for the northern storm. At the time, the storm didn’t look immediately capable of tornadic production, but earlier LSRs with low thresholds prompted the Severe/Tor possible. At 0.5 degrees, Velocity showed a bit of increased shear but nothing too substantial with a Delta-V of approx 30kts, and NROT of approx 15kts. The TDA picked up on this, but what intrigued me was the MDA did as well which had been very stingy at picking up mesocyclones which caught my eye. The readout suggested a meso signature was being detected within several bottom layers, which prompted me to look at all tilts, and voila! Above the 0.5 degree scan a decent-looking mesocyclone was much more prevalent. This mesocyclone indicated the storm was much more organized than originally expected and lead to the issuance of a tornado warning while anticipating further strengthening of the circulation. Eventually, the Tornado Warning was verified by an LSR report at 2122Z.
KDMX @ 21:10Z at 0.5KDMX @ 21:10Z at 0.9KDMX @ 21:10Z at 1.3KDMX @ 21:10Z at 1.8