NMDA (in green) had problems picking up on the 1.3 slice circulation compared to DMD (in orange) and MDA (in cyan). This is a mid-level rotation at about 11K ft above sea level. This is about half an hour before tornado touchdown.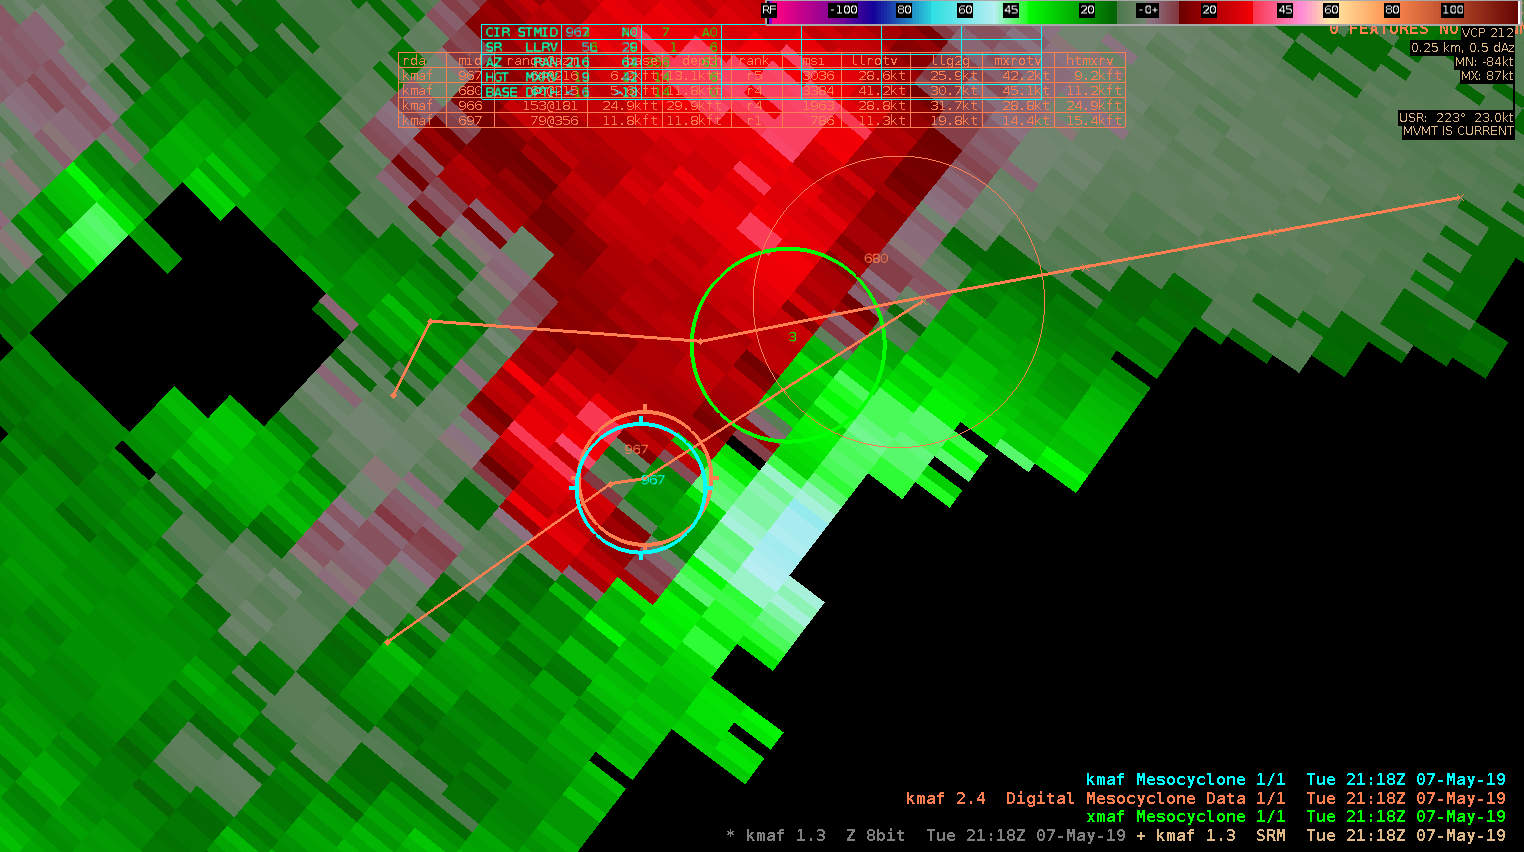
ZDR_Arcophile
Official websites use .gov
A
.gov website belongs to an official government
organization in the United States.
Secure .gov websites use HTTPS
A
lock (
) or https:// means you’ve safely connected to
the .gov website. Share sensitive information only on official,
secure websites.

NMDA (in green) had problems picking up on the 1.3 slice circulation compared to DMD (in orange) and MDA (in cyan). This is a mid-level rotation at about 11K ft above sea level. This is about half an hour before tornado touchdown.
ZDR_Arcophile
In this image from LBB, the legacy MDA (top left) and DMDA (top right) were indicating a meso in an area where a hail spike was resulting in false velocity data. The NMDA was the most trustworthy during this time frame.
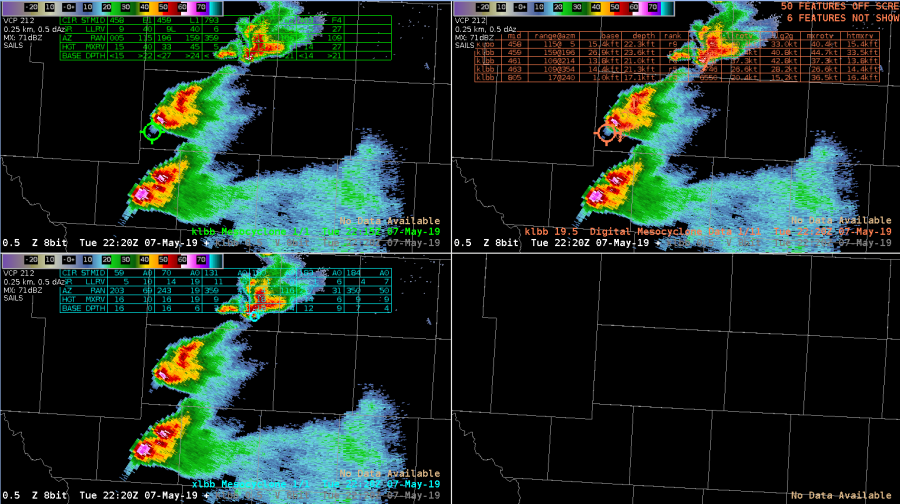
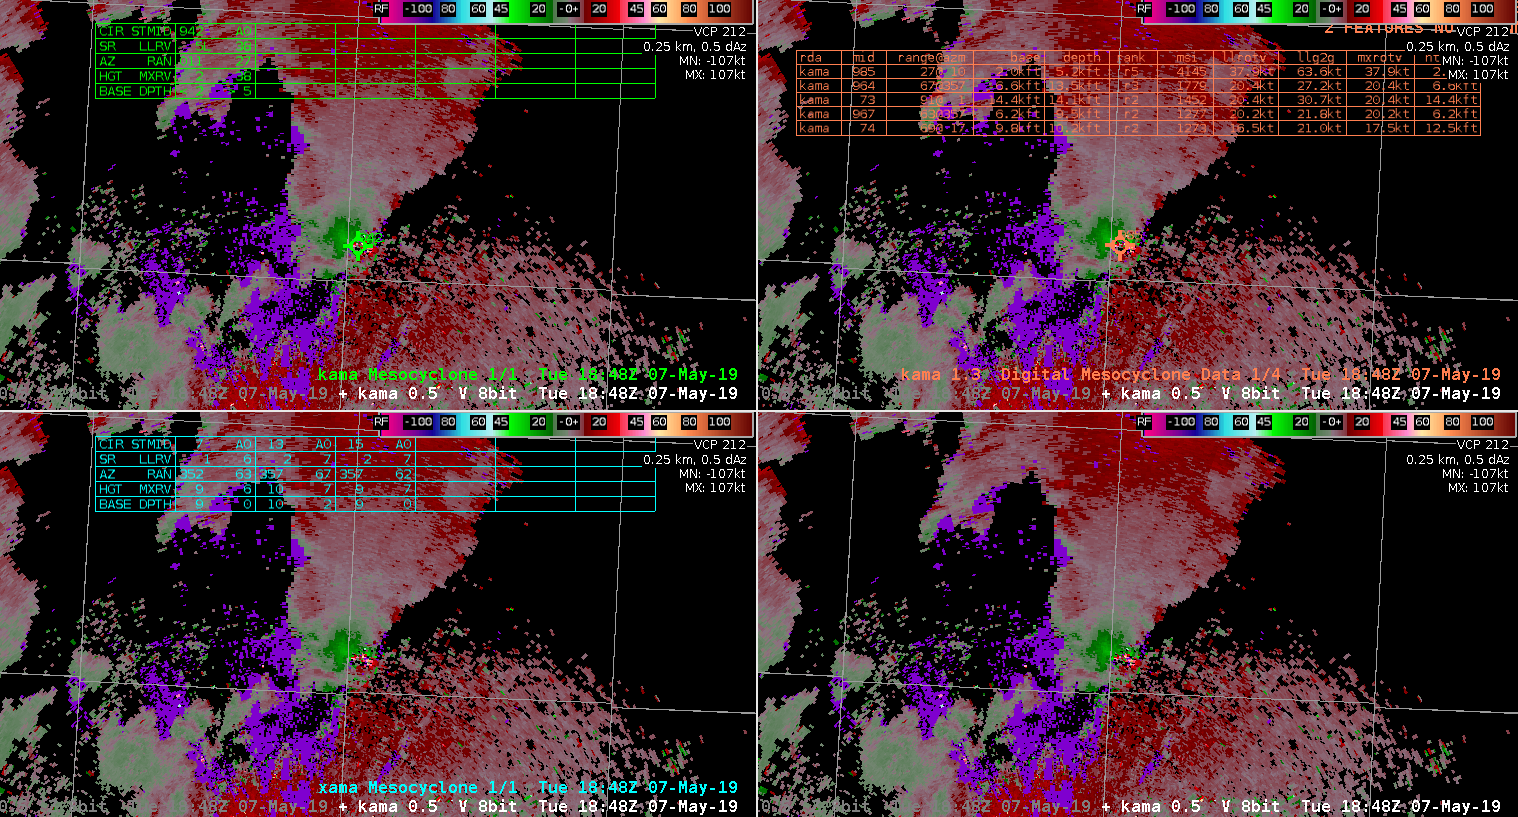
Comparison of the legacy MDA (top left), DMDA (top right), and NMDA (bottom left) of a tornadic supercell via AMA’s radar. A confirmed tornado was occurring during the time of this loop.


A tornado was reported to have touched down at 2127z. Per the AMA radar (report was in northern LBB’s CWA), the NMDA (bottom left) was the only MDA to indicate a meso in the area the tornado was reported. The Legacy MDA (top left) and DMDA (top right) indicated a meso with the cell to the west of the primary meso.

A strong supercell in Lubbock’s CWA is the first example I have witnessed of the NMDA (bottome left) performing better than the legacy MDA (top left). The DMDA (top right) followed the meso at times, but the NMDA seemed to perform the best in this particular situation. The legacy MDA failed to pick up on a meso at all.
Quick comparison between the MDA, DMDA, and NMDA showing that the MDA and DMDA had marked an area in AMA’s CWA, yet the NDMA did not. However, two minutes later the NDMA finally caught on and highlighted the same area.

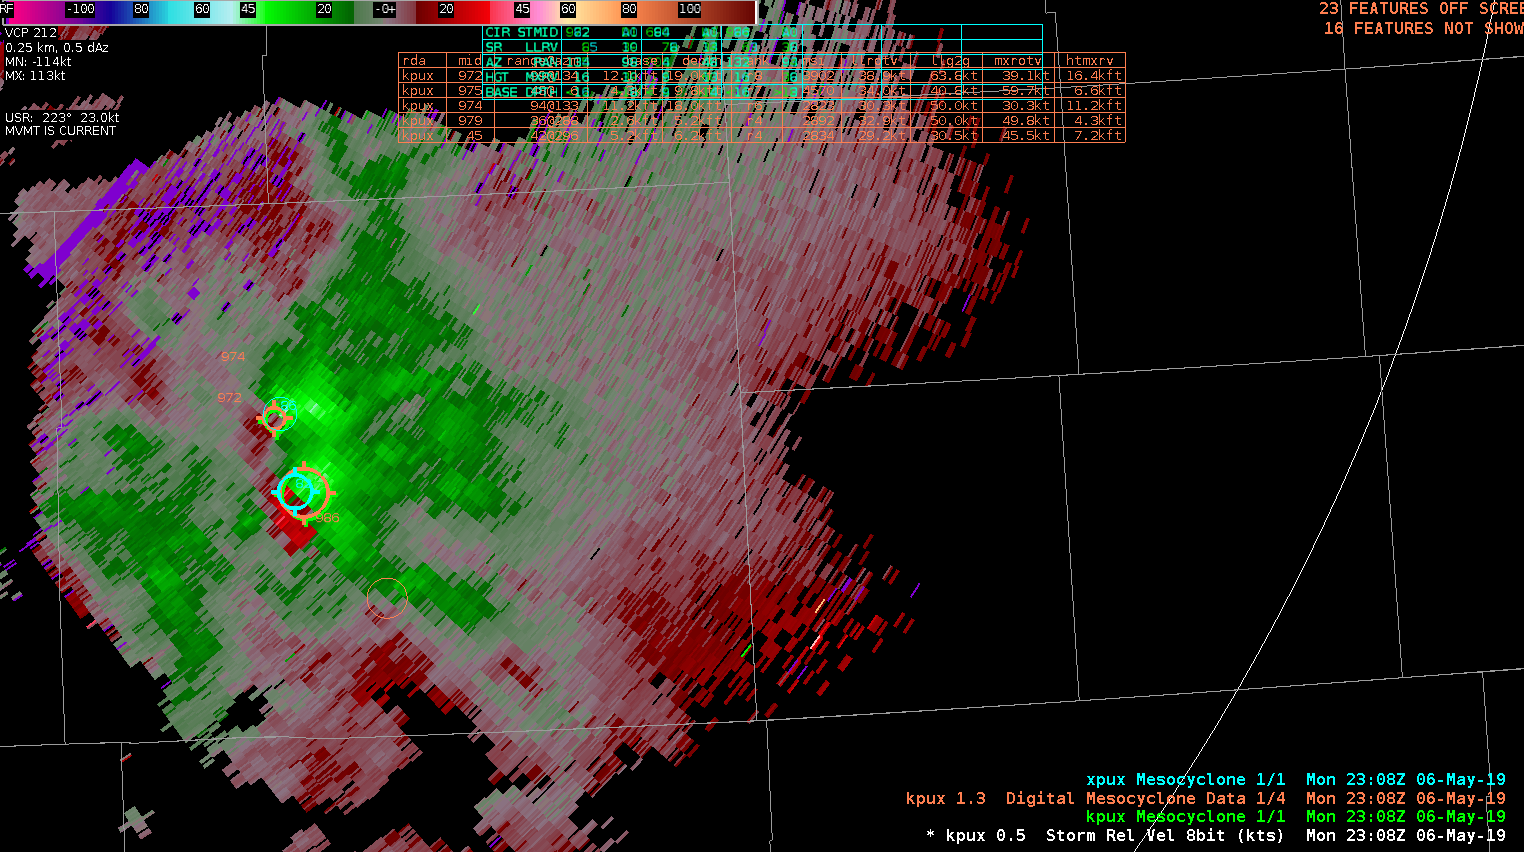
DMA is a television market area and my home market is next to my assigned CWA for the day. A storm on the fringes of the DMA, approaching the CWA is in a known radar hole…lowest tilt of KPUX radar (Even DDC) doesn’t provide good low-level analysis of storms that far from the dish, but NDAM showing similar detection to existing products at 2308Z…
-icafunnel

NMDA shows several false meso’s which can be a little too sensitive at times for the weaker meso’s. -Jake Johnson
Investigating the MDA algorithms, it continues to seem as though the NMDA (shown in light blue) continues to do a better job at identifying mesocyclones compared with the “normal” algorithm. Its performance may be comparable with the DMD (yellow).

South Beach
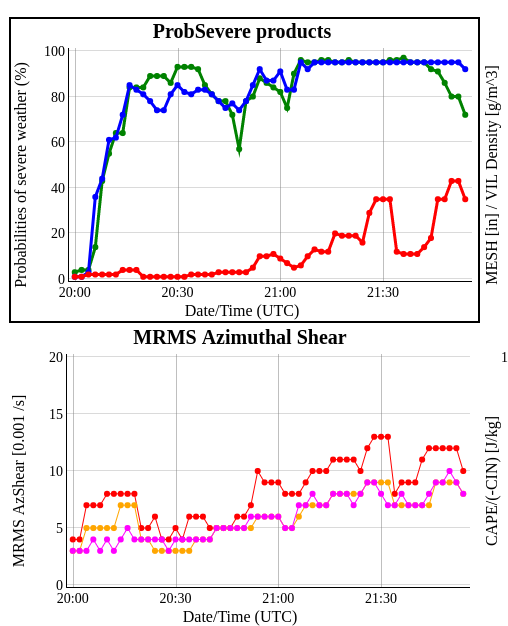
KTLX, KFWS and KFDR perspectives of tornadic supercell near the Red River. Spotters indicated occasional brief touchdowns with this storm. Animation is from 2050 to 2143 UTC around the time of the reported brief touchdowns. Last image is the time trend of ProbTor (red trace) and MRMS AzShshear (red trace). KFDR seemed to sample the mesocyclone the best and subsequent gate-gate-shear (90 nm from RDA). ProbTor indicated a gradual increase then took a sudden drop shortly after 2130 UTC, then continued to increase. This may have been the result of a similar drop in the MRMS AzSHear. Not clear why AzShear dropped off briefly (perhaps a sampling issue with one of the radars). However, radar SRM data did not show any indication of weakening circulation in any of the, in fact the velocity couplet was even stronger around 2130 UTC especially KFDR radar. A caution to forecasters to be careful when examining trends in the ProbTor and be sure to examine the various inputs into ProbTor in conjunction with the radar (velocity trends). – Quik Twip