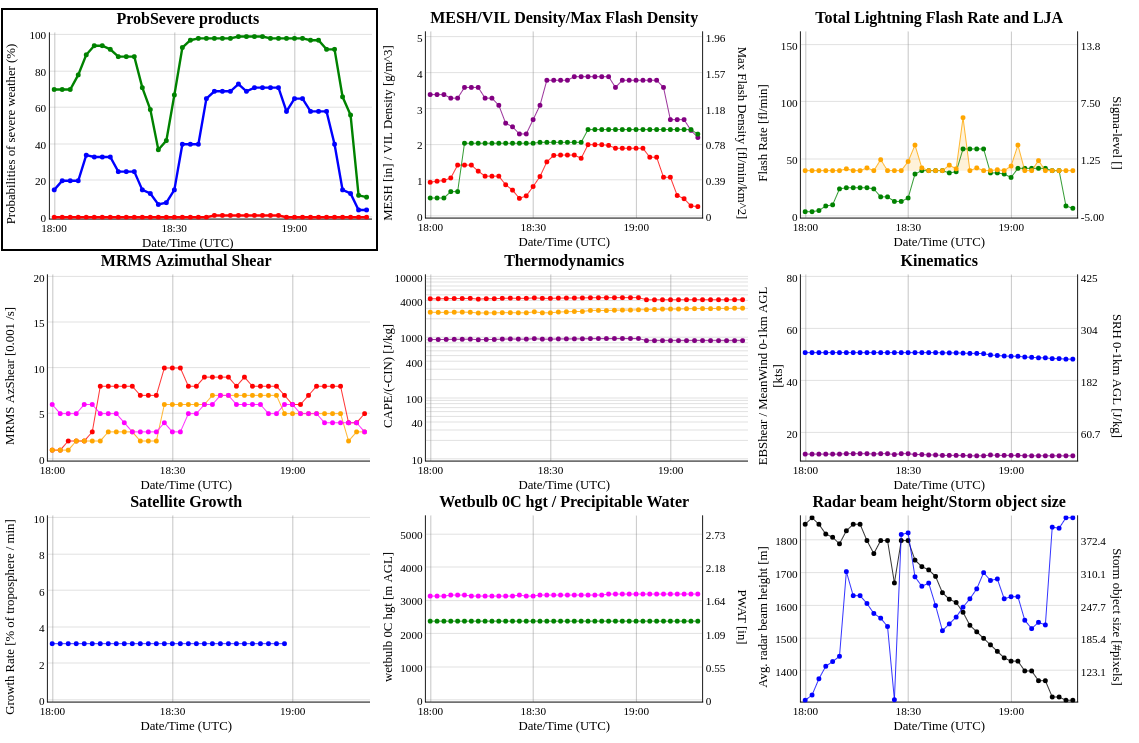
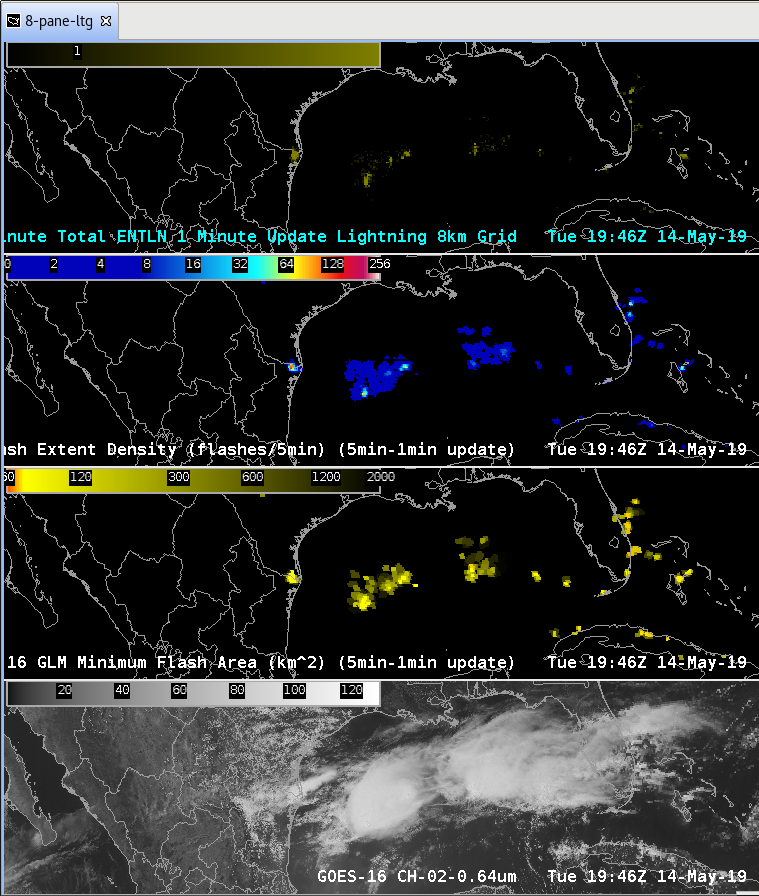
There was a nice area of convection moving off the east coast of Florida with storms forming off an apparent outflow boundary moving to the south. As the storms moved off the coast they increased intensity exponentially. Focusing on these storms as they moved over water reflectivity showed max dBzs in the low to mid 60s with tops 45-50k ft high. GOES-16 Event density (5min-1min update) showed a value of 247 suggesting a nice updraft, which AzShear seems to further support with a bright white color and value of .007s^-1 exactly where the max dBzs/echo tops/GLM data is. In addition,prob severe did a good job of tracking the storms…but with the storms moving off the coast it is impossible to get any storm reports to verify its accuracy.
Utilizing all of this data I would most definitely want to issue a localized small craft or some sort of marine advisory or warning…if there was one for this are. -Desmond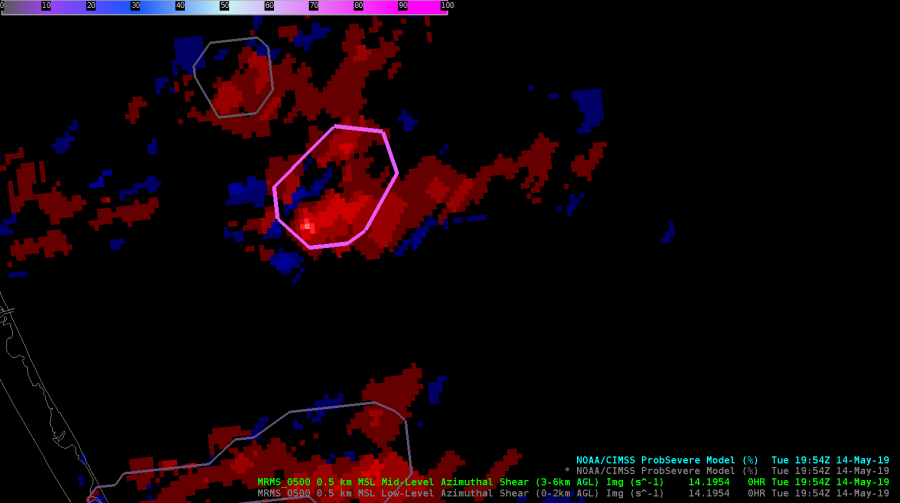
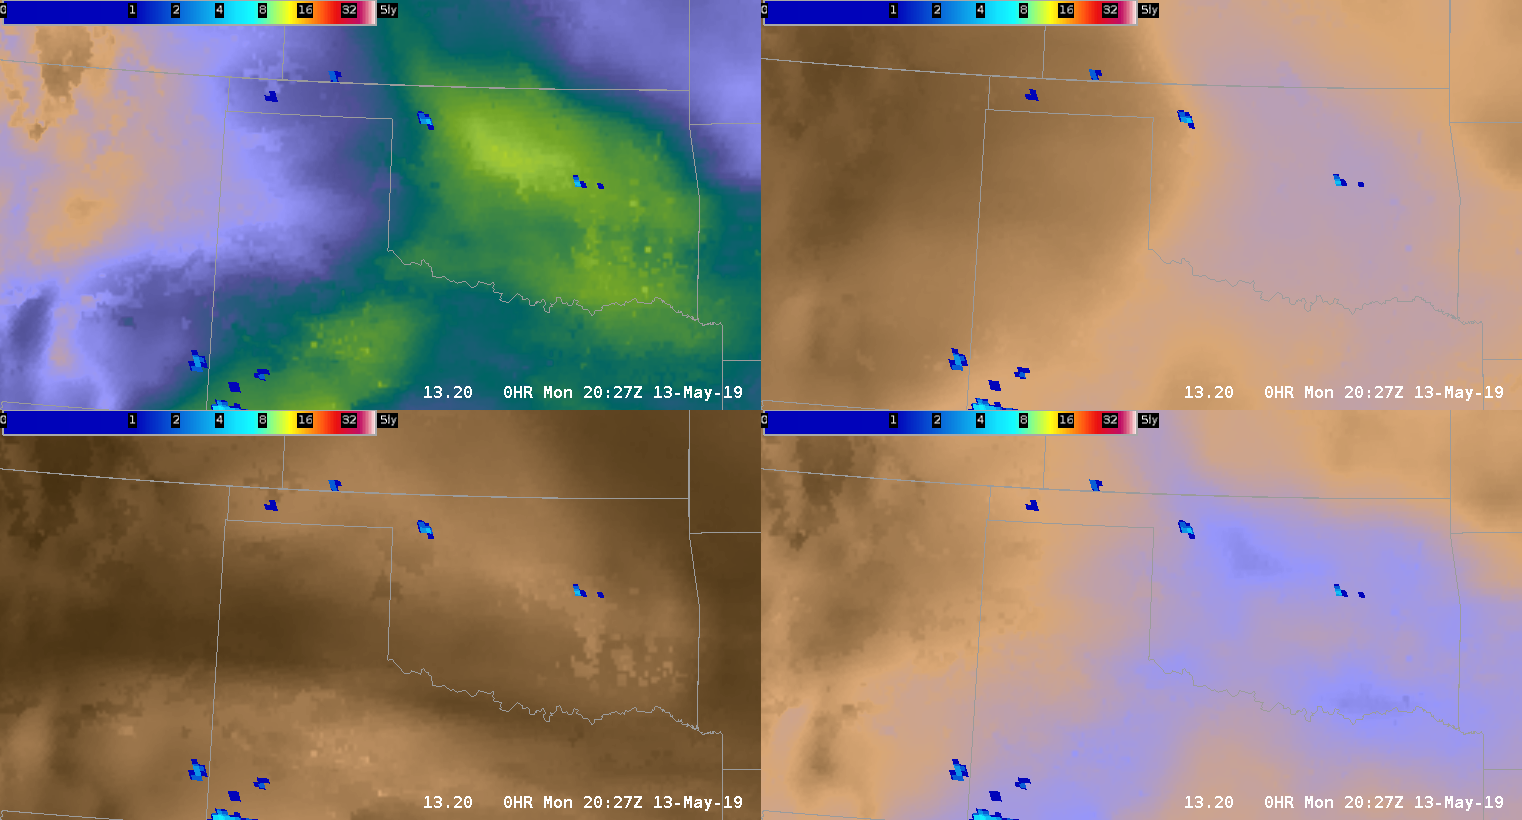
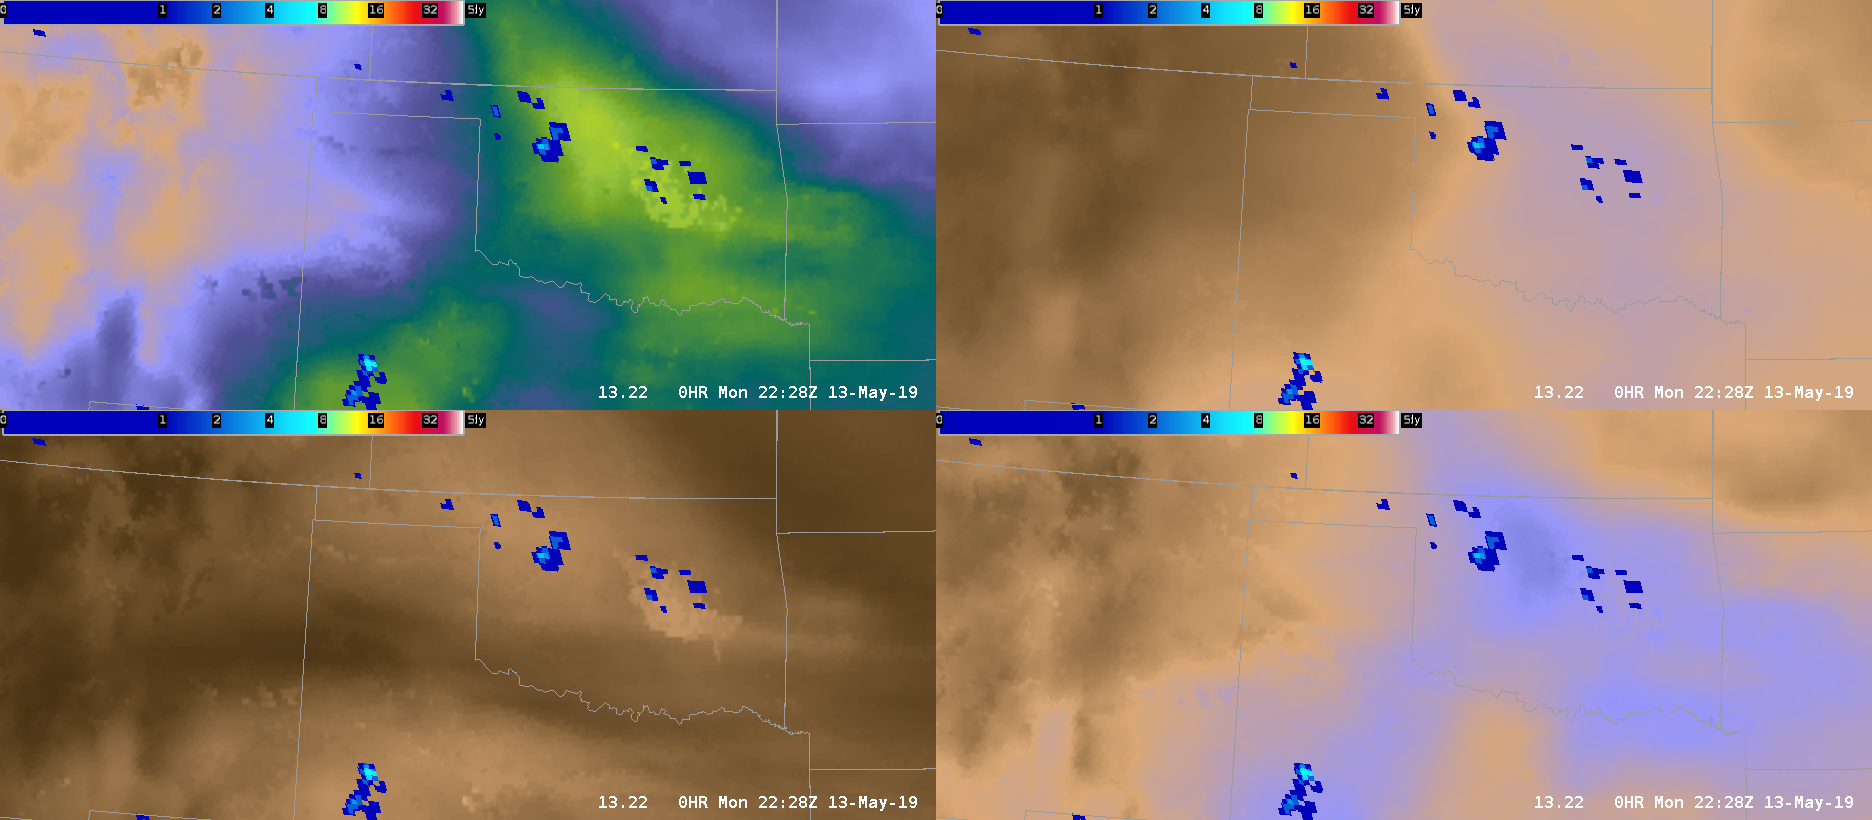
AzShear .007s^-1
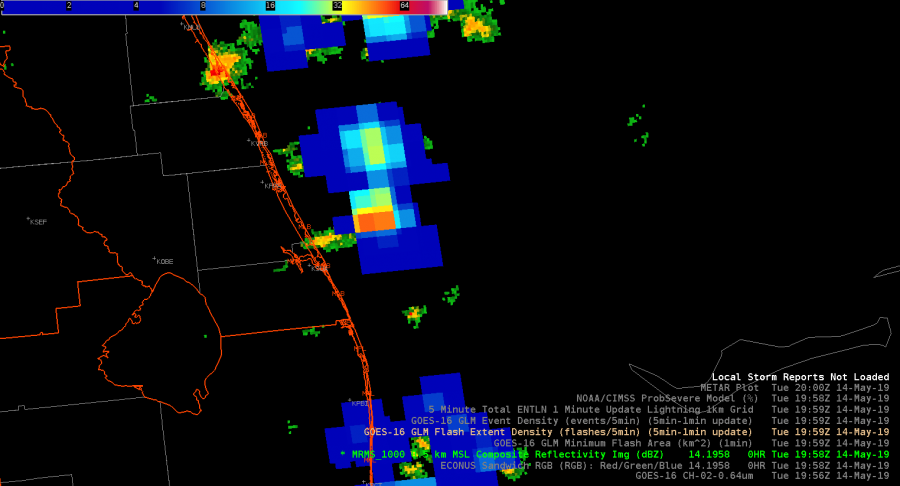
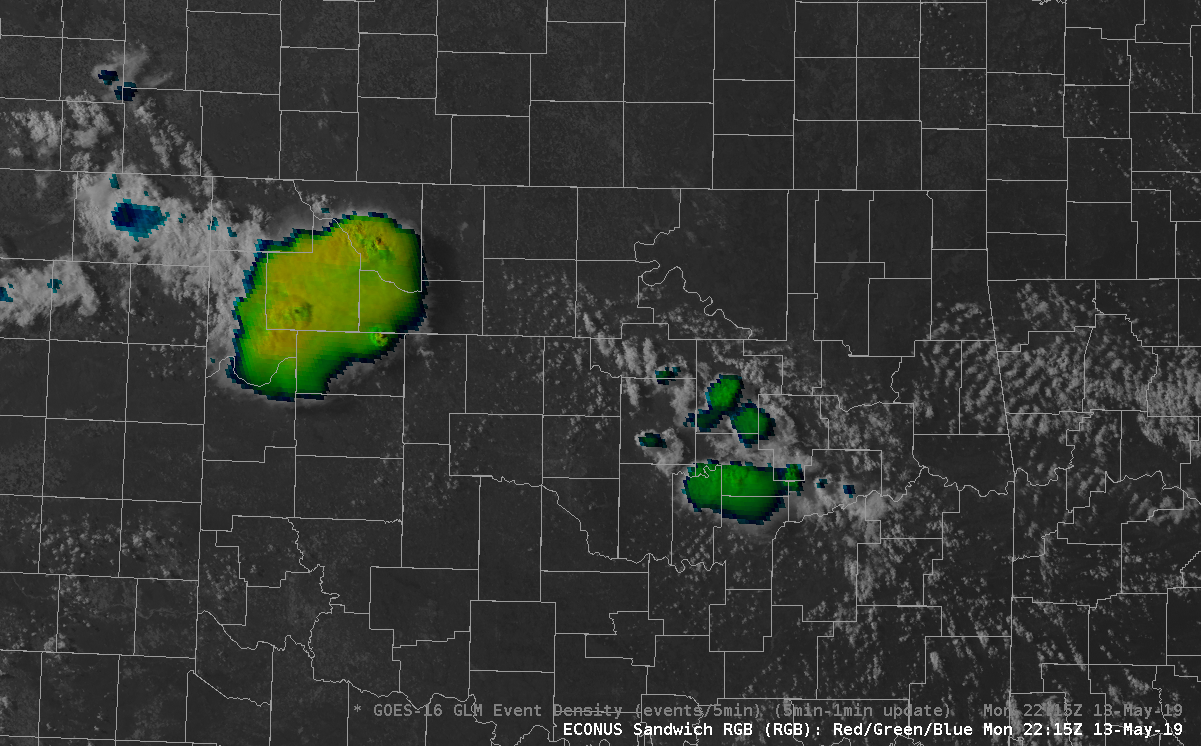
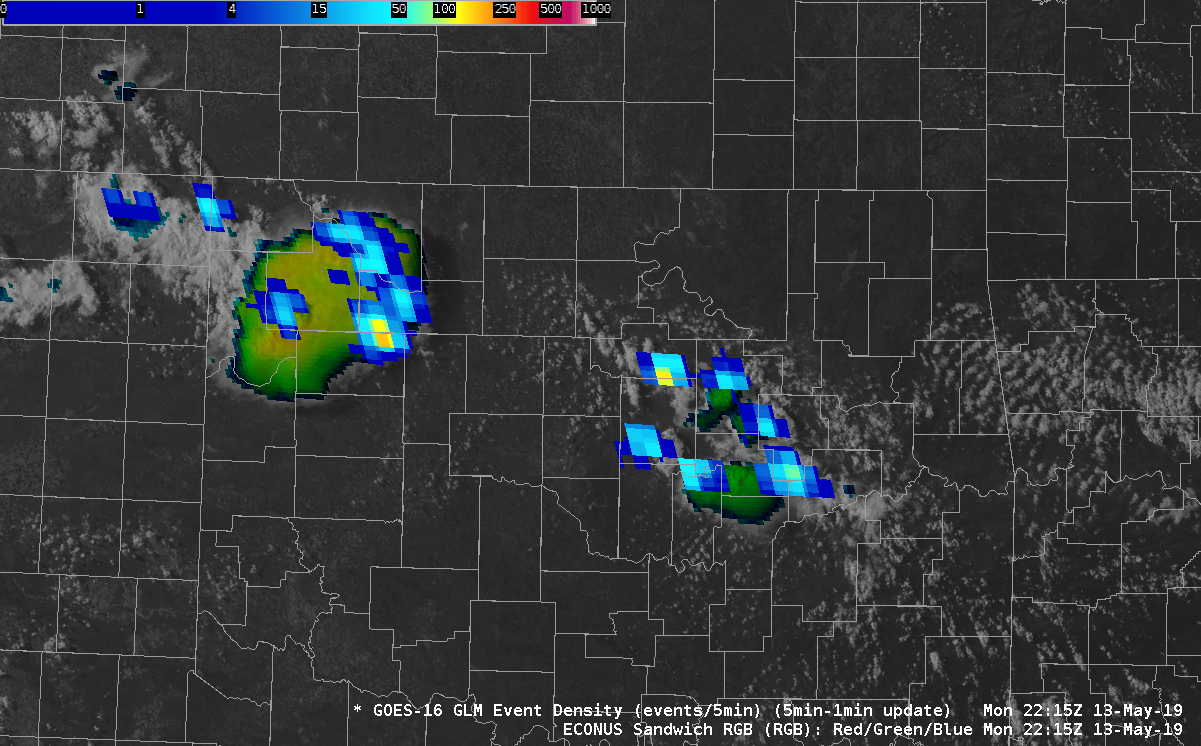
GOES-16 Event density (5min-1min update)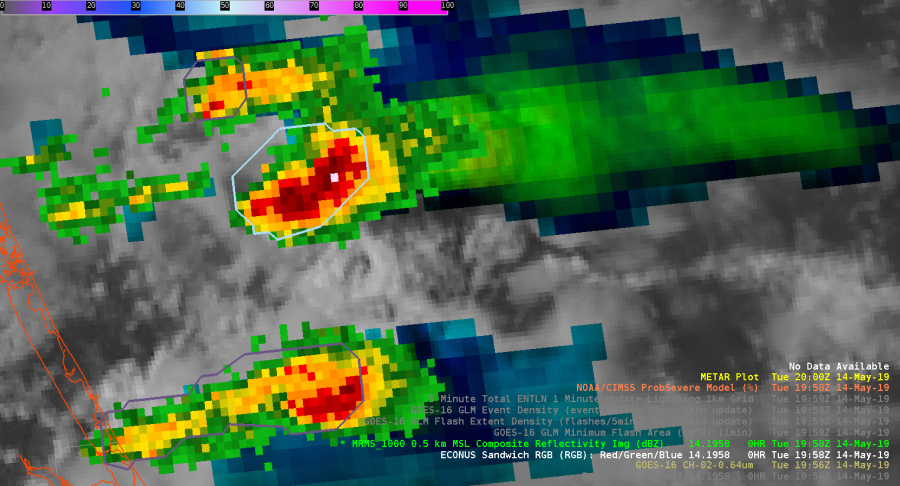
Max dBzs in the low to mid 60s
 .
.