Merged AzShear issues

Obvious issues with merged AzShear not seen in the single radar product: multiple reflections of the velocity gradient along the leading edge of the convective line. The single radar AzShear maintained a single, more coherent circulation.

AzShear Smearing in Merged product


The single radar AzShear provided a cleaner look at the meso near the AL/GA border. The merged product had some bad data that made it look less representative and would likely cause confusion or loss of confidence by the forecaster.

Merged AzShear (L), KMXX AzShear (UR), vel (LR)

AzShear with a slower moving tornadic supercell and a faster moving outflow dominant cell

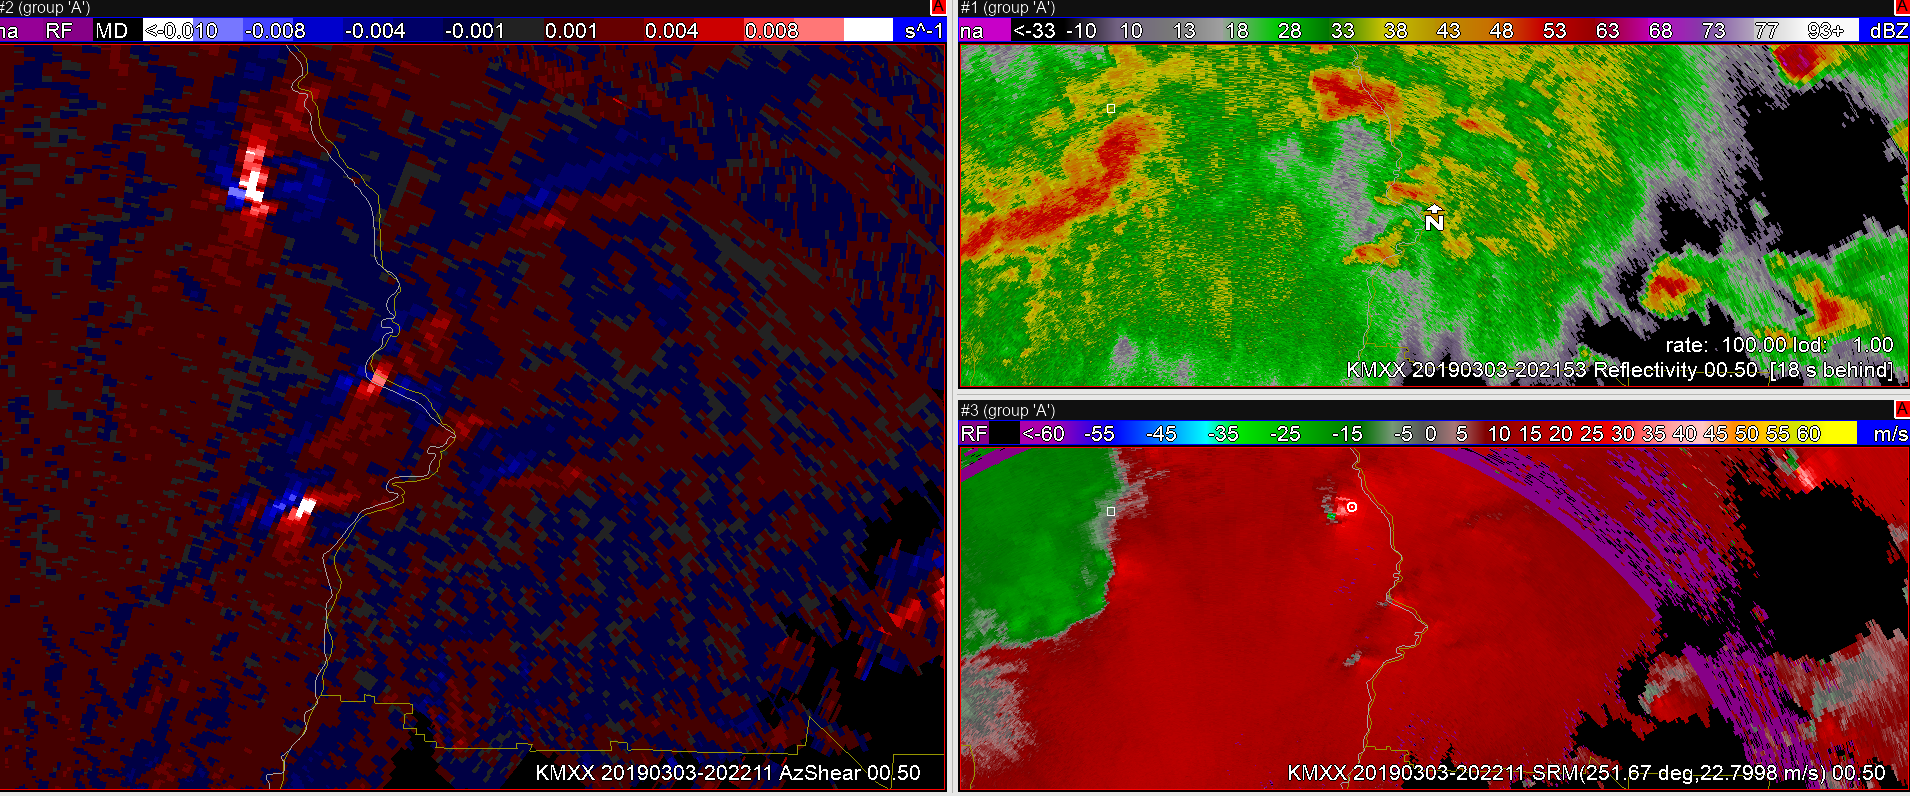
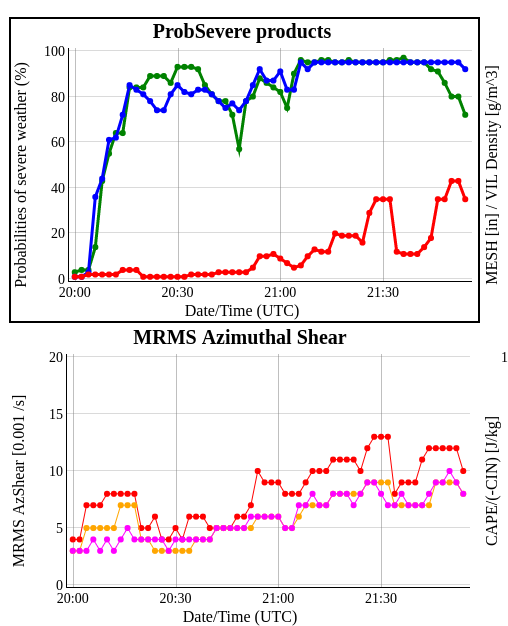
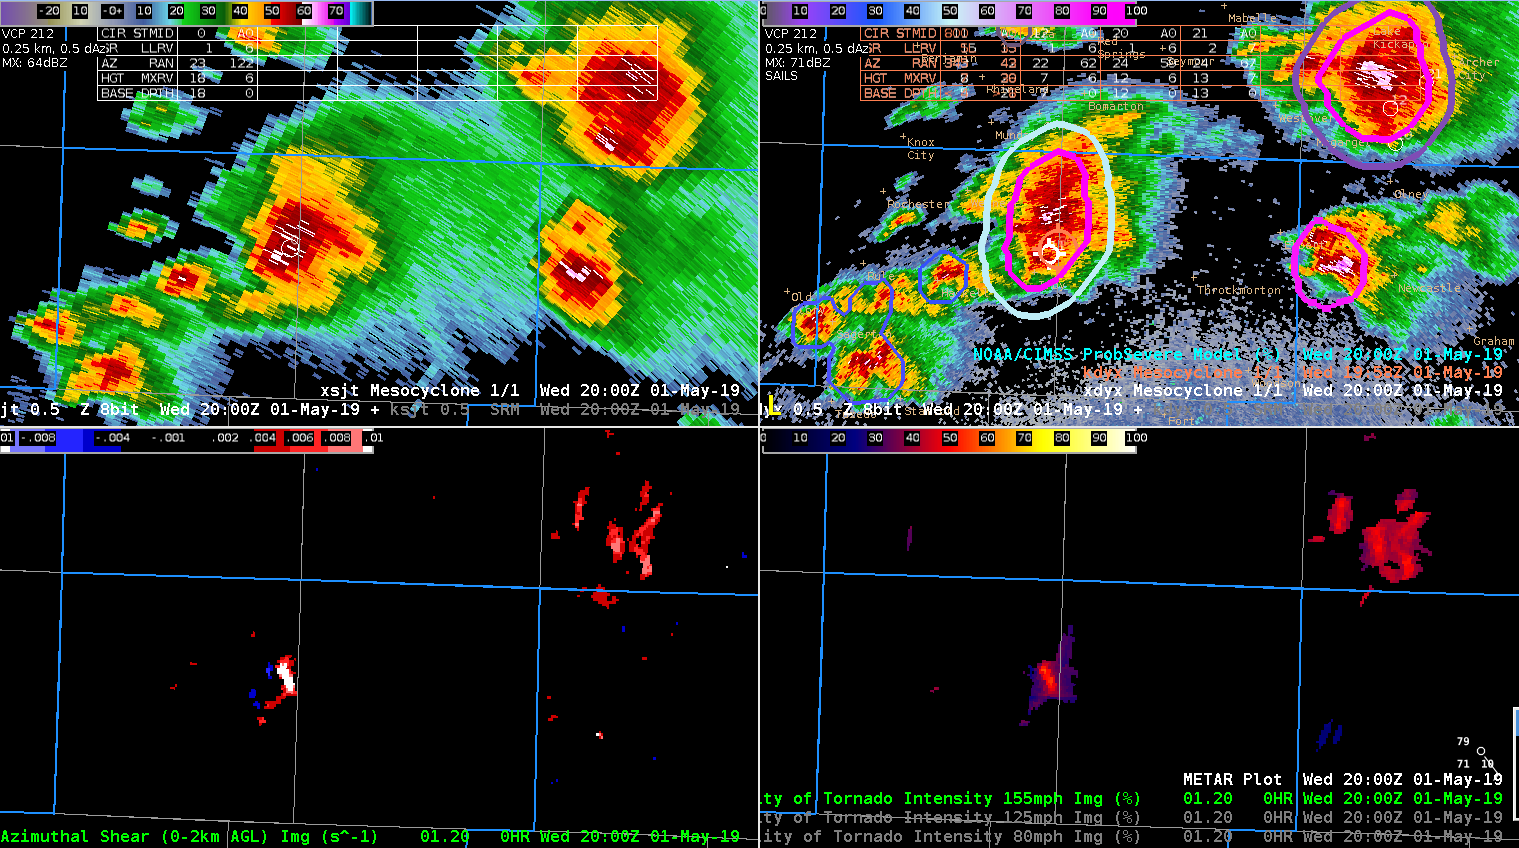
This example shows a supercell early in its lifecycle. The cell split and produced a tornado near the county boundary in the loop. In past examples, the AzShear product featured numerous time matching issues from multiple radar site’s data. In this case, cell motion was slower, possibly contributing to the less cluttered and more useful AzShear data.
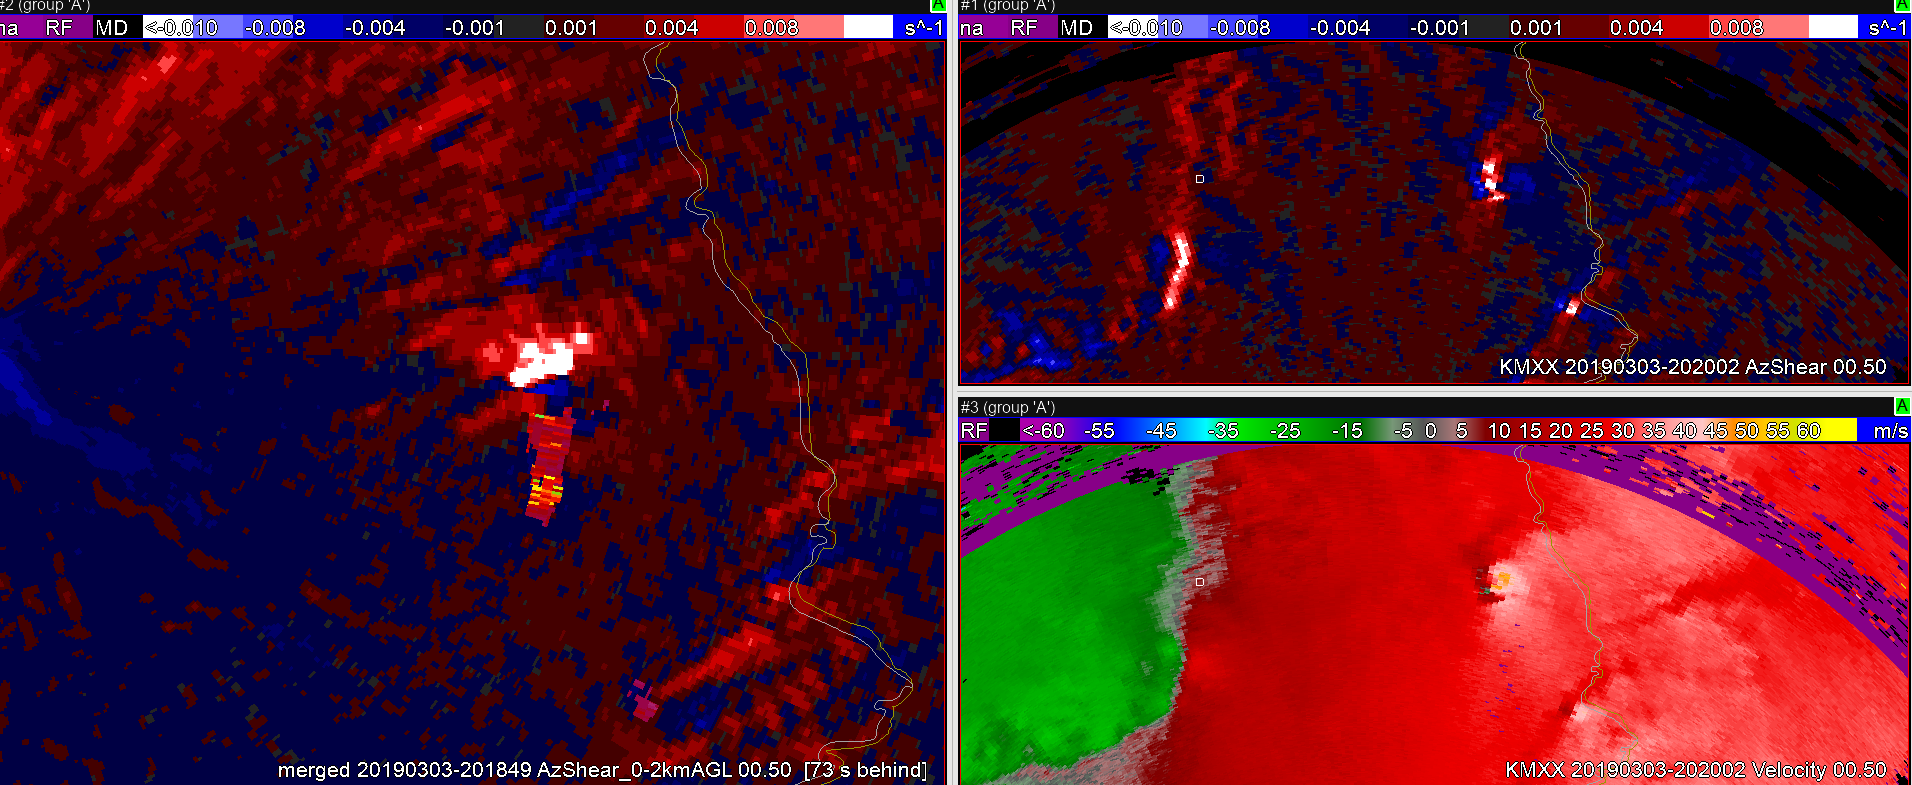
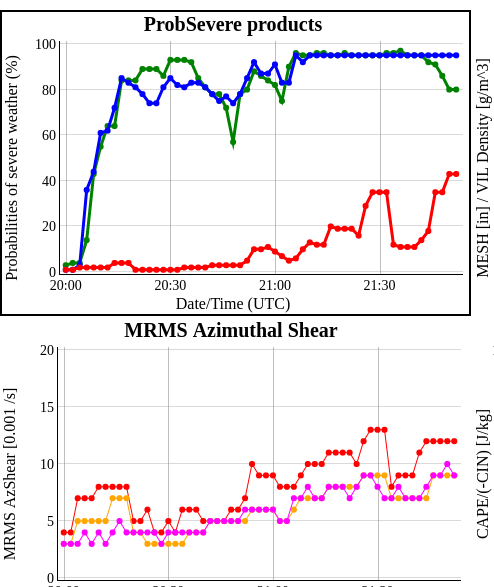
Same loop as above this time with V data. AzShear did anticipate possible tornadogenesis with upticks in values several scans before the tornado. On the bottom left, CPTI is shown for the 175mph threshold. Values for this threshold remained low.

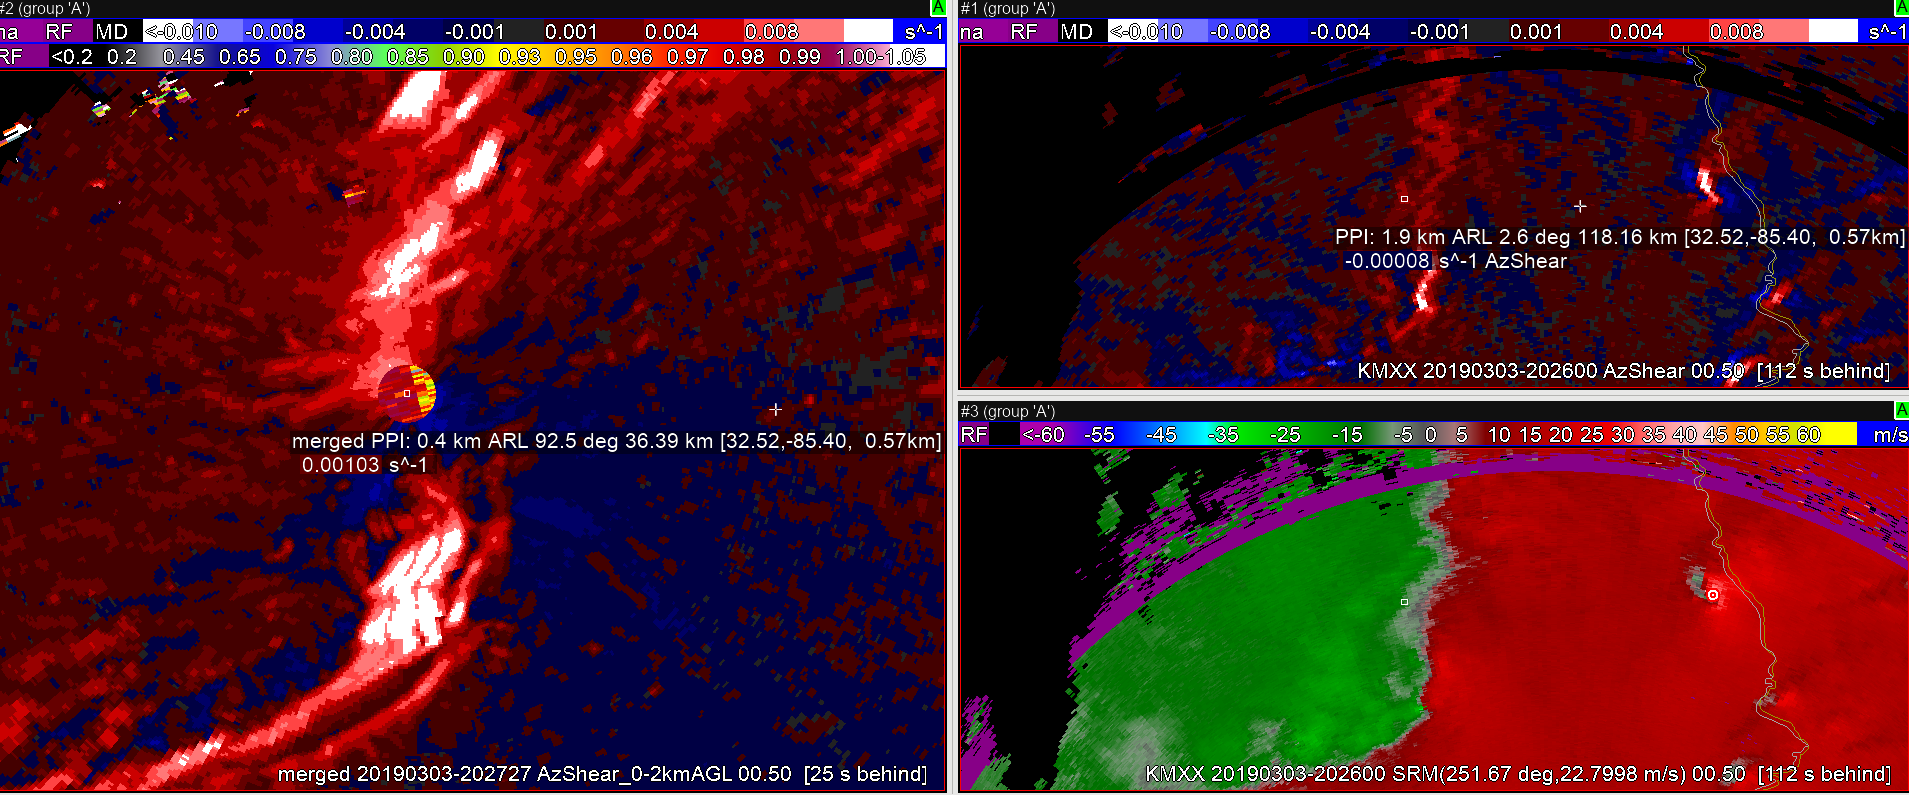
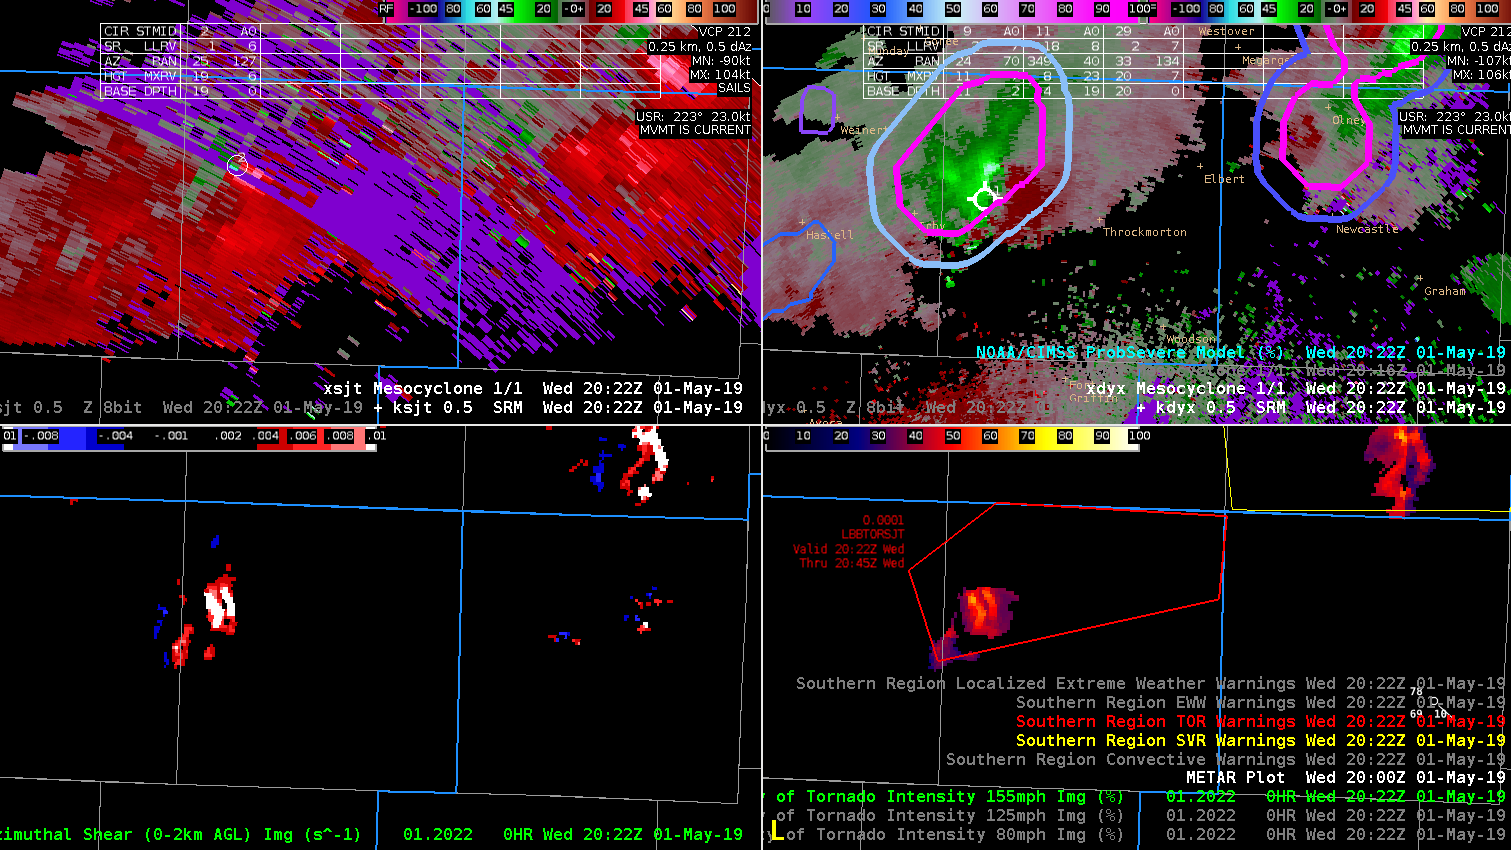
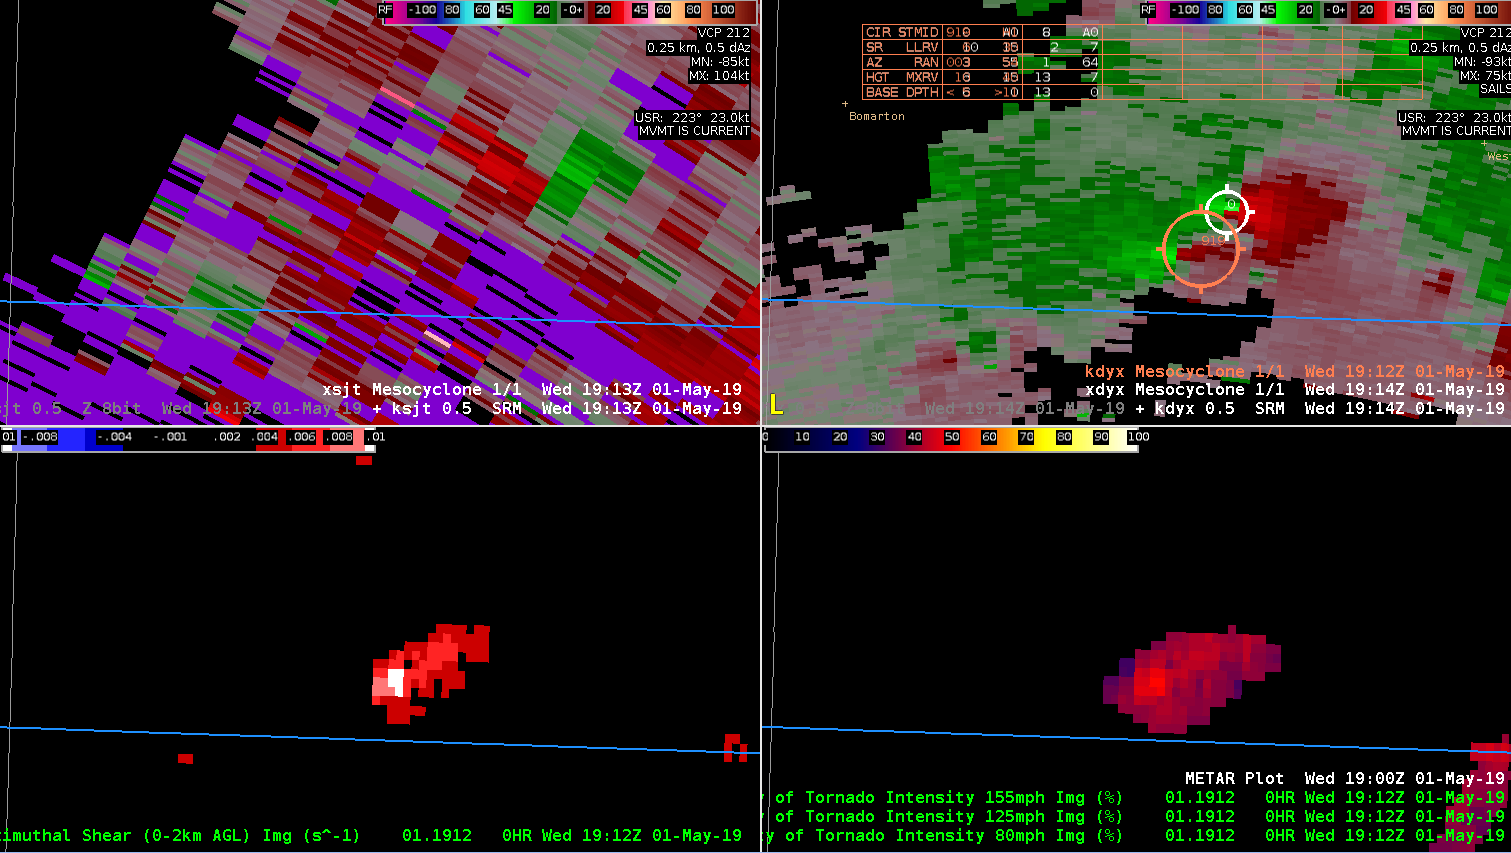
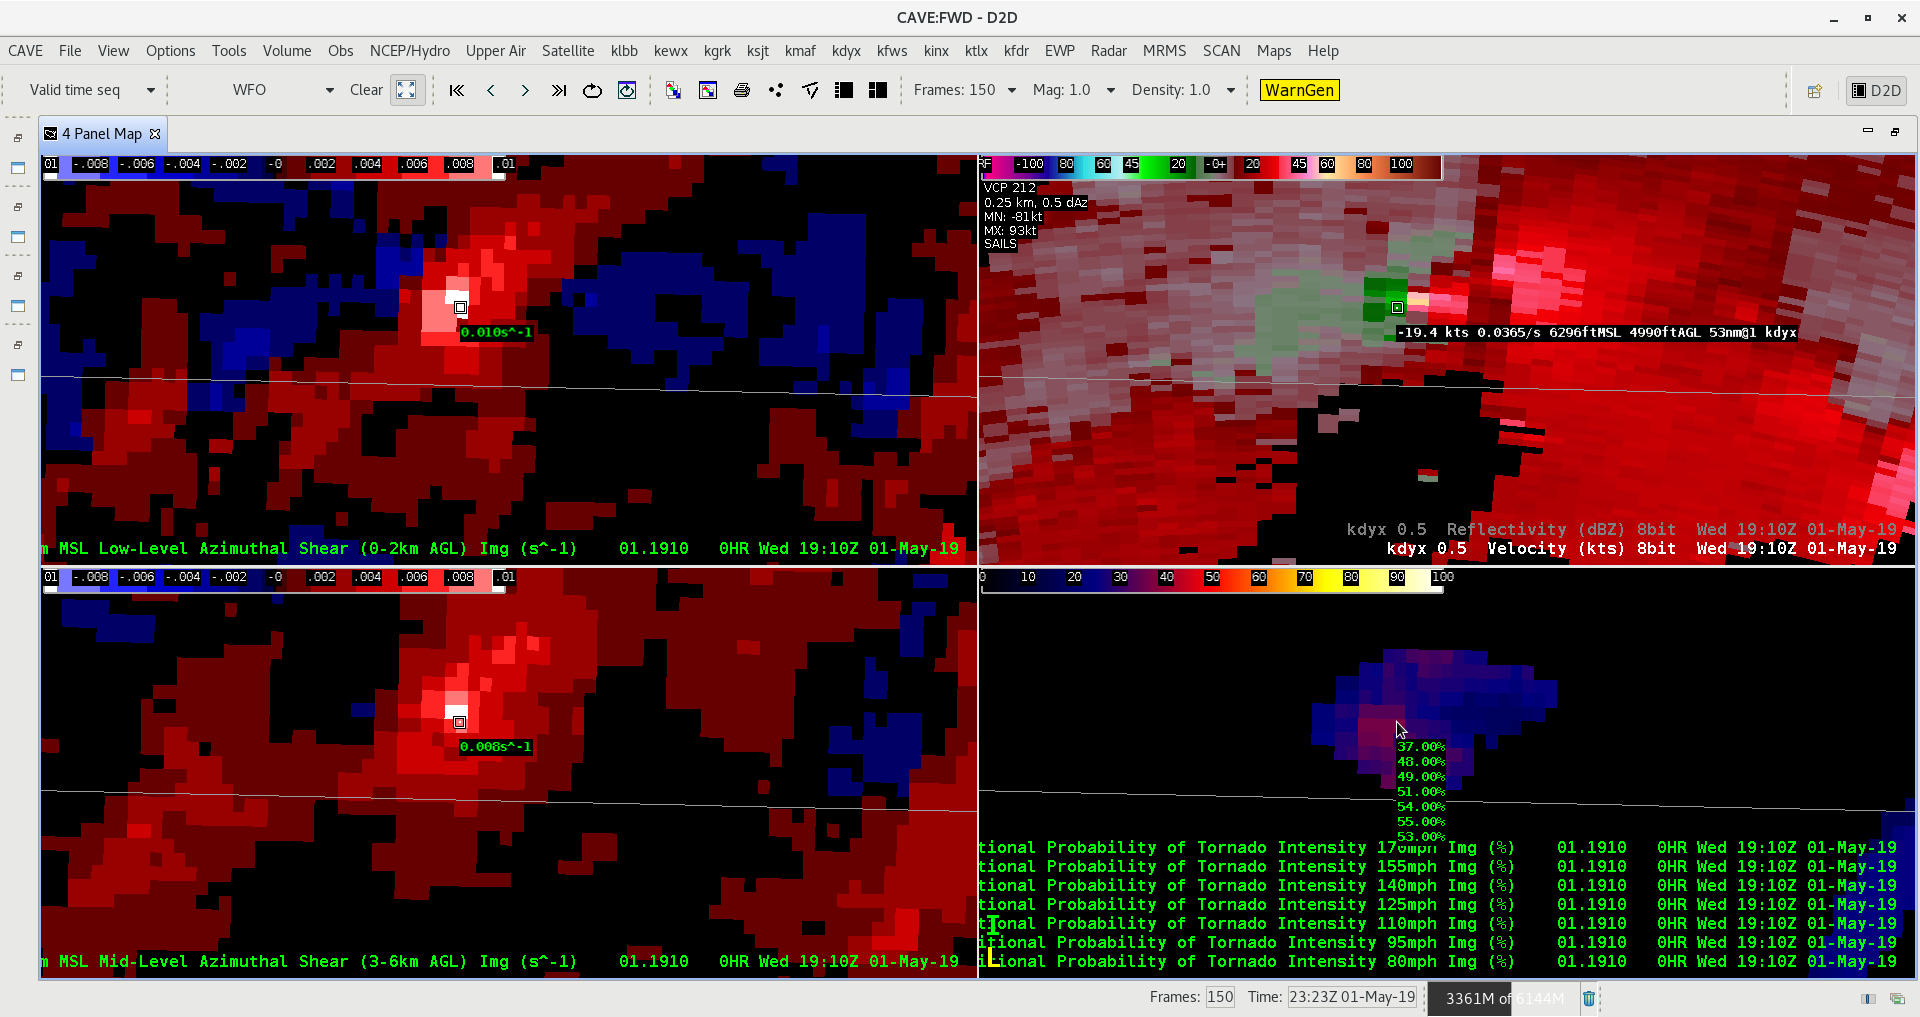
Values readout for the CPTI product on the bottom left at the time of strongest V couplet. Values ranged from 37 for 175 up to 48 for 155, but then did not show much of a change once again between 155mph down to 95 mph. In this range, the probability only rose from 48  to 55 percent between 155 to 95. Then, strangely enough, the prob dropped back down to 53 percent for 80mph.

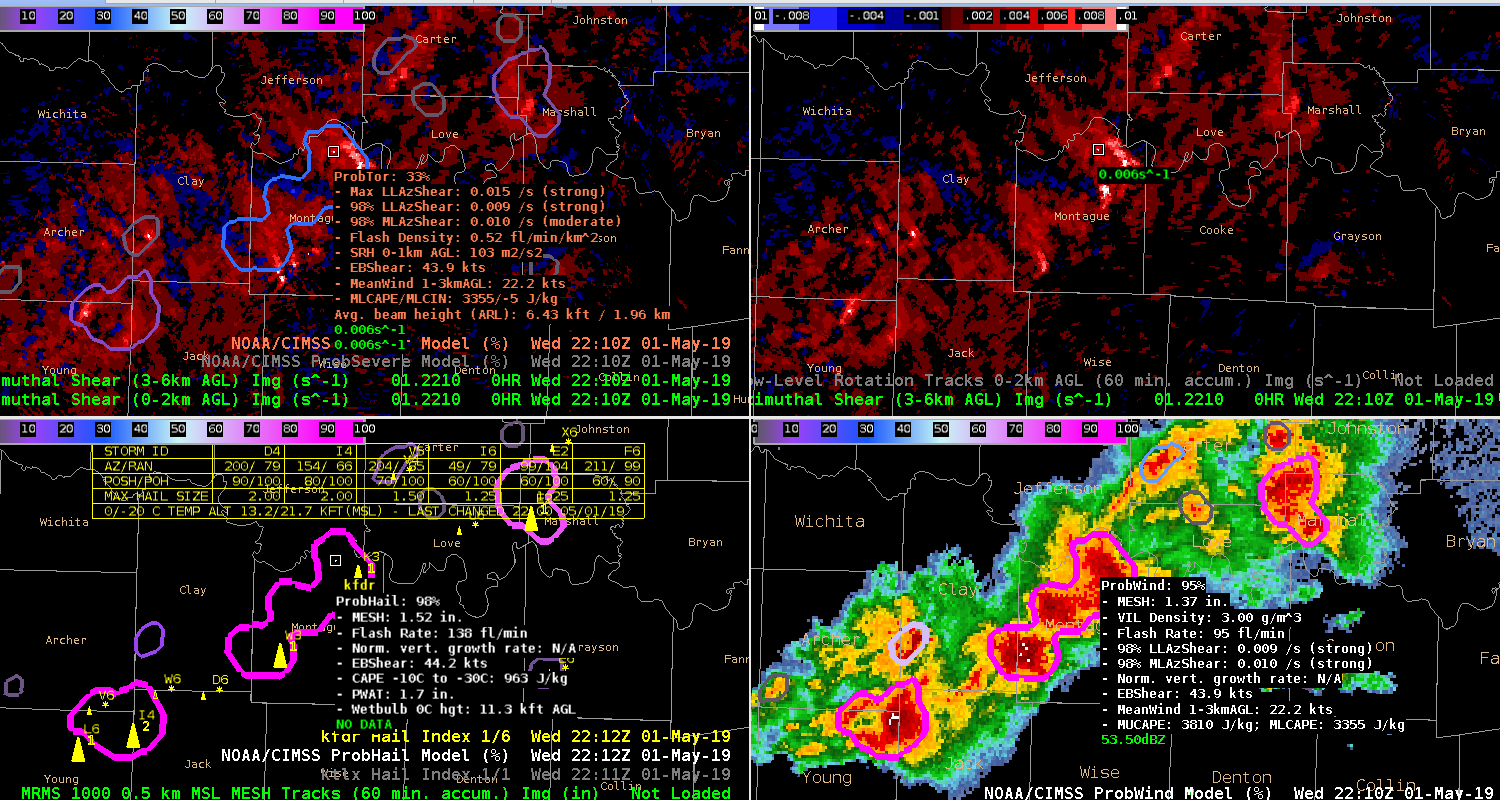
This later example shows another case of multiple sampling issues with AzShear


-Dusty Davis


High ProbWind values with severe reports!!

The storm cluster across N TX began to gust out late in the afternoon. Line motion was ~43kt as the storms surged across Montague county just south of the Red River. There was a report of wind damage in Texas (power poles blown down) and in Oklahoma (estimated 60-70 mph winds) associated with the storm cluster.  ProbWind was as high as it has been the past couple of days in the 92-95% range during this time. Of note, the Flash Rate was very high with the identified object, at times nearing 150 fl/min and the AzShear was ‘strong’. This combined with the environmental parameters helped increase the wind probs throughout the life of this cluster as it moved ENE. ProbWind was equally high with other objects to the northeast and southwest of the featured storms yet no wind reports were received from them. Interestingly though, ProbTor was ~30% with the Montague county object at this time helping draw attention to it.

Low Level AzShear (UL), Mid Level AzShear (UR), ProbHail (LL), ProbWind (LR)

ProbTor not showing much “Love” for Tornadic Supercell in Love Co OK


ProbTor showed a noticeable increase in values as the circulation on the Love County storm improved from 21:24-21:28 however there was a significant drop off at 21:34 even though the circulation from KFDR maintained its intensity and actually improved gate-to-gate. Looking at the MRMS AzShear graph you can see the same trends pinpointing the main driver in the ProbTor behavior. By 21:44 the AzShear recovered and ProbTor also returned to its previous value and continued to climb. There was some apparent “funky data” that got into AzShear to cause the unexpected drop. This emphasizes the need to have the proper products paired in AWIPS displays in order to diagnose why some algorithms may “fail” at times.

ProbSevere Time series. (http://cimss.ssec.wisc.edu/severe_conv/plots/PSplots.php?ID=166605)

Low Level AzShear (UL), Mid Level AzShear (UR), New Mesocyclone Detection Algorithm (KFDR) (LL), Low Level Rotation Tracks (LR) 21:20-22:14

KFDR 0.5 deg SRM 21:03-22:13.

Multi-radar comparison of Tornadic Storm near Red River

KTLX, KFWS and KFDR perspectives of tornadic supercell near the Red River.  Spotters indicated occasional brief touchdowns with this storm.  Animation is from 2050 to 2143 UTC around the time of the reported brief touchdowns.  Last image is the time trend of ProbTor  (red trace) and MRMS AzShshear (red trace).  KFDR seemed to sample the mesocyclone the best and subsequent gate-gate-shear (90 nm from RDA).  ProbTor indicated a gradual increase then took a sudden drop shortly after 2130 UTC, then continued to increase.  This may have been the result of a similar drop in the MRMS AzSHear.  Not clear why AzShear dropped off briefly (perhaps a sampling issue with one of the radars). However, radar SRM data did not show any indication of weakening circulation in any of the, in fact the velocity couplet was even stronger around 2130 UTC especially KFDR radar.  A caution to forecasters to be careful when examining trends in the ProbTor and be sure to examine the various inputs into ProbTor in conjunction with the radar (velocity trends). – Quik Twip

AZ_shear CPTI for possible tornadic storm


AZ_shear was showing double shear signature and also showed in the CPTI product.  Did finally see a bit of an increase on the 155mph for CPTI, however the 125mph and 80mph were similar values.  My conceptual thinking would be that 80mph would be 100%, 125mph 80%, and 155mph 60%, thus would make more sense versus all threshold values being closer to 50-60% range.  -Jake Johnson