Overview:
For this event over the ILN CWA, we will focus on 3hr forecast verification from hourly runs of the PHS and HRRR starting at 17Z, ending at 20Z. Each models 3hr forecast will be compared with SPC mesoanalysis data for verification/comparative analysis.
PHS & HRRR 3hr Forecast Comparison & SPC Meso Verification [20-23Z]
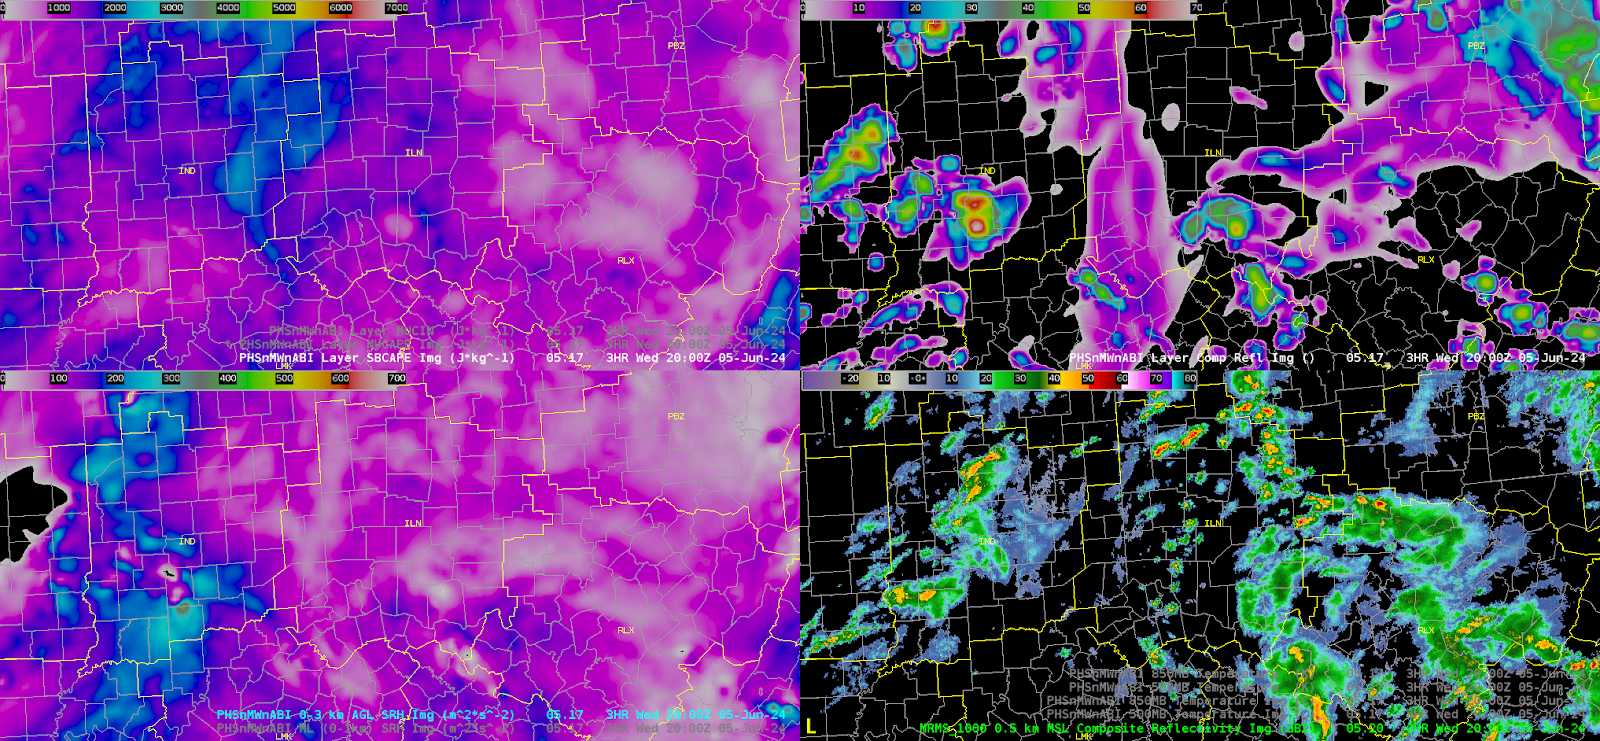
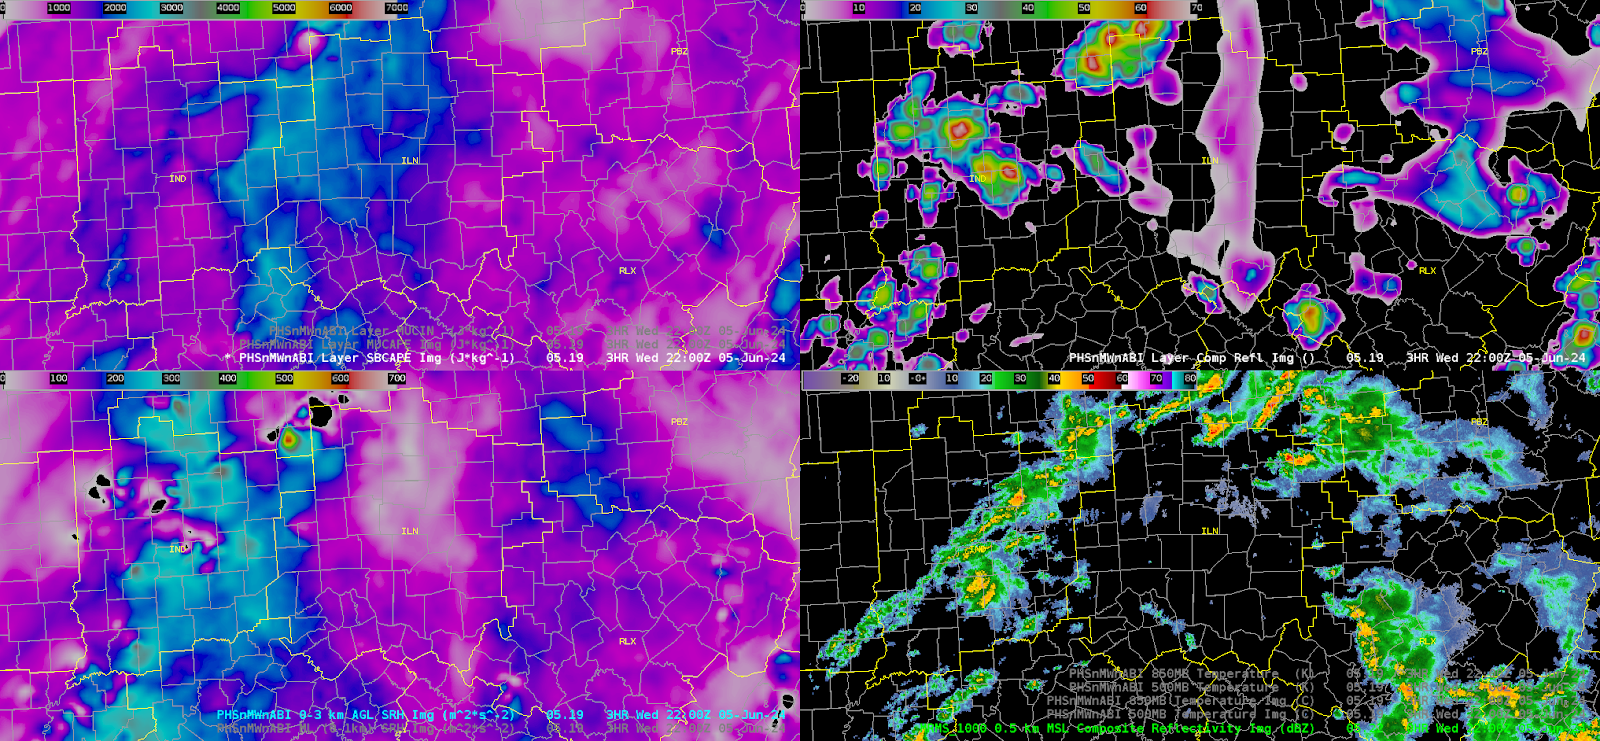
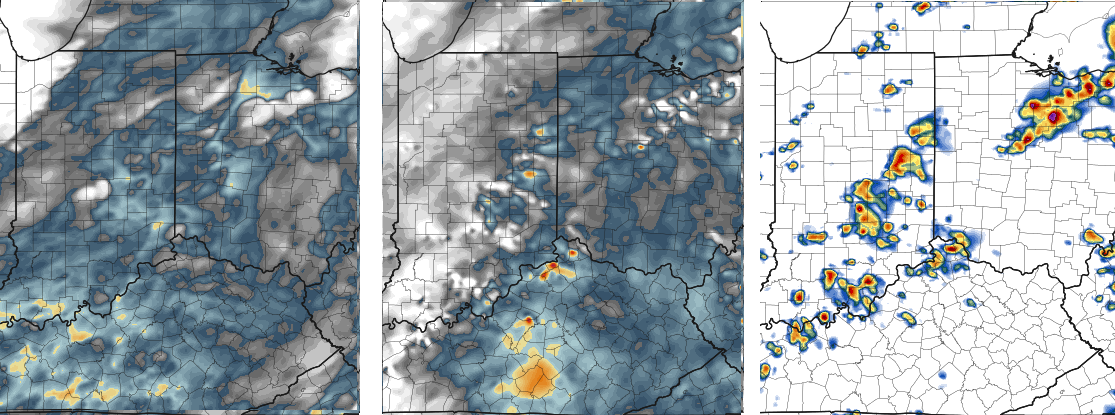
PHS 17:00Z valid for 20:00Z
SBCAPE [J/kg, top left], Layer Comp Ref [top right], 0-3km SRH [m2/s2, bottom left], MRMS Comp Ref [dBZ, bottom right]
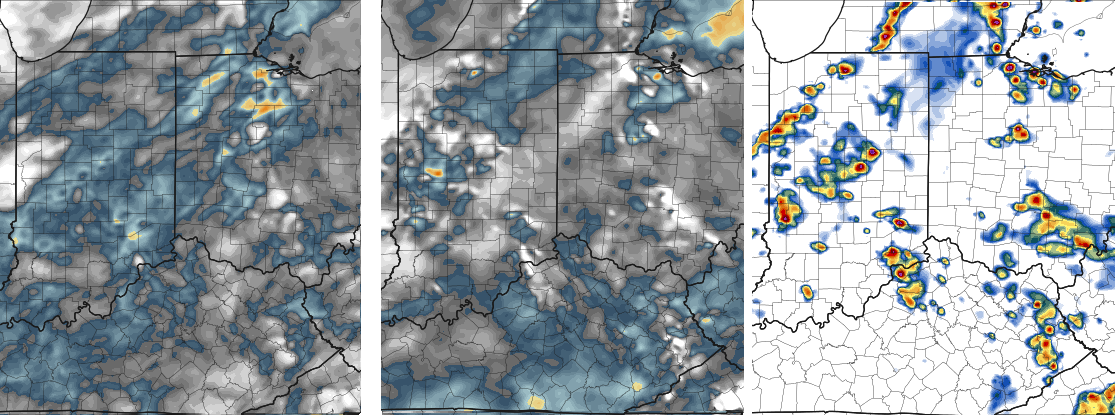
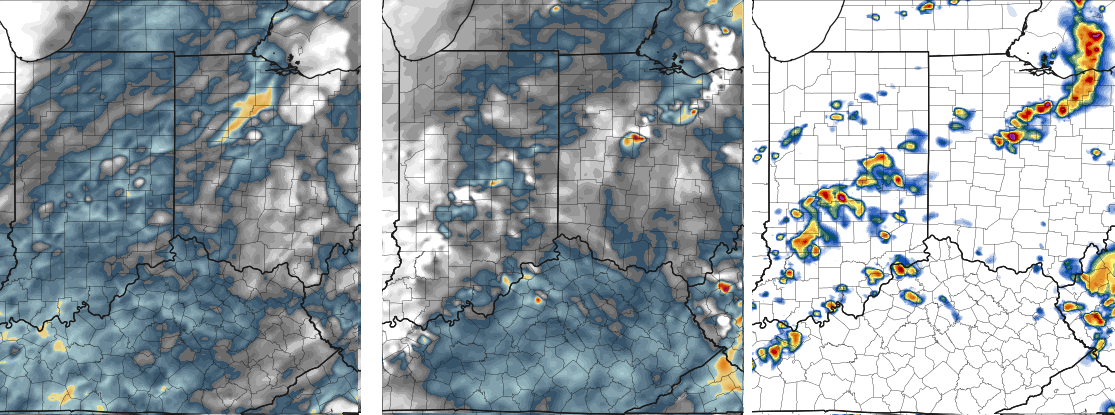
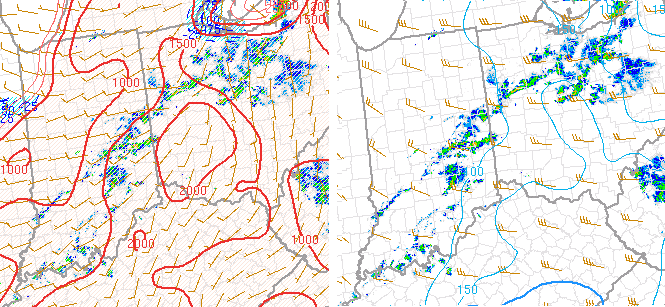
1700Z HRRR valid for 20:00Z
SB CAPE [J/kg, left], 0-3km SRH [m2/s2, middle], Sim Comp Ref [dBZ, right]
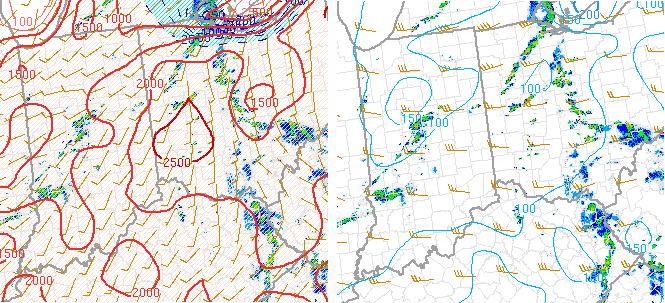
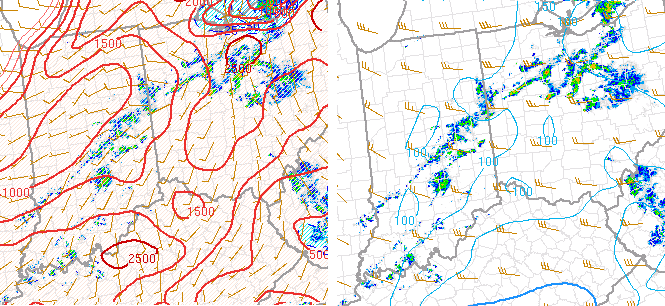
20:00Z SPC Mesoanalysis
SB CAPE/CIN [J/kg, left] & 0-3km SRH [m2/s2 + Storm Motion, right]
20:00Z Summary:
Lingering convection was observed around the area, but diminishing in intensity/coverage. PHS identifies a bullseye of higher 0-3km SRH to the south/west around the order of 150-250 m2/s2, while the HRRR has much lower values around 50-100m2/s2 which verified closer to SPC Mesoanalysis.
Instability was much greater per SPC mesoanalysis upwards of 2000-2500 J/kg, where both the PHS and HRRR were forecasting much lower values.
Convection would be slightly overdone in intensity/coverage from both the HRRR and PHS.
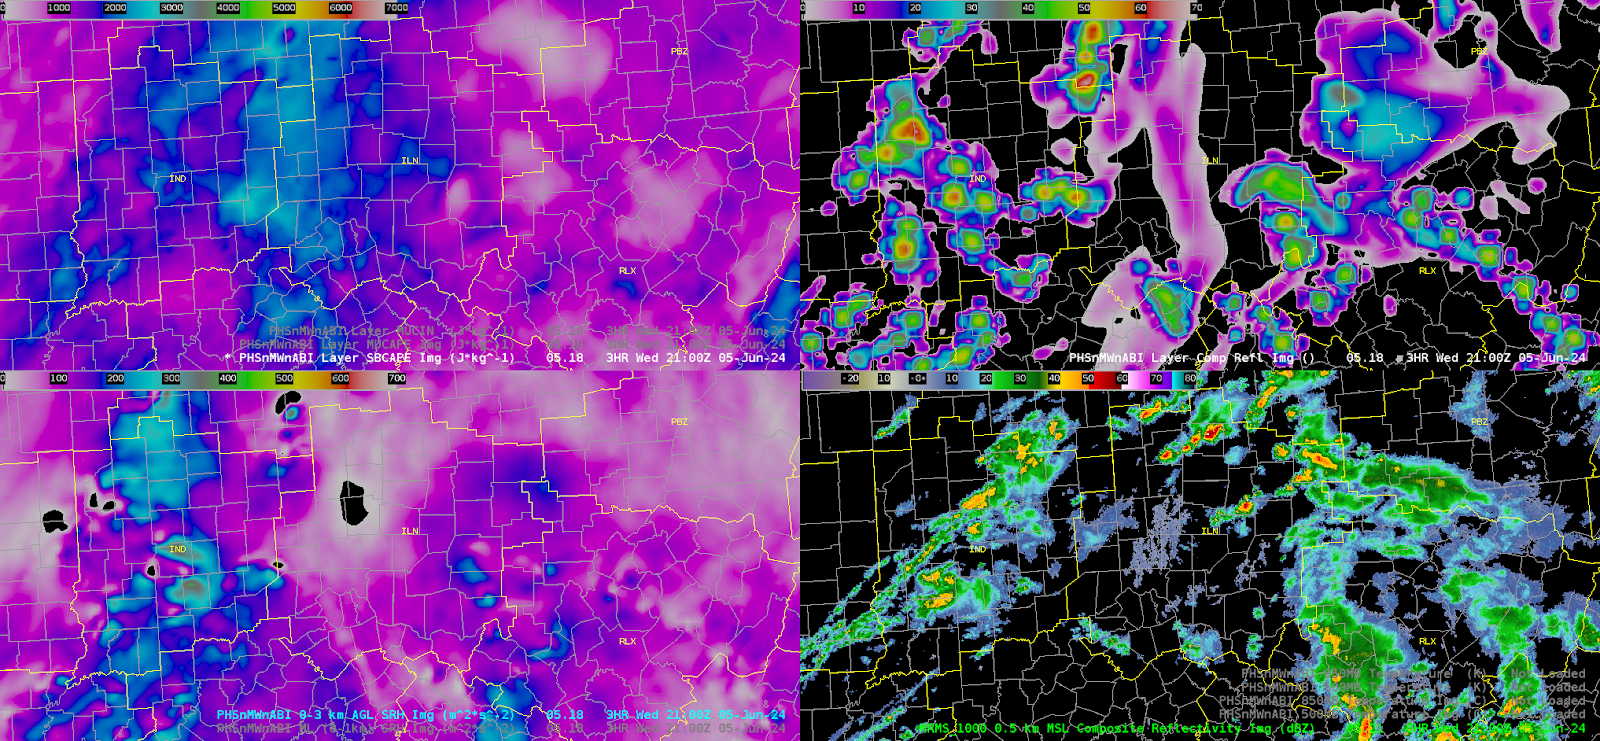
PHS 18:00Z valid for 21:00Z
SBCAPE [J/kg, top left], Layer Comp Ref [top right], 0-3km SRH [m2/s2, bottom left], MRMS Comp Ref [dBZ, bottom right]
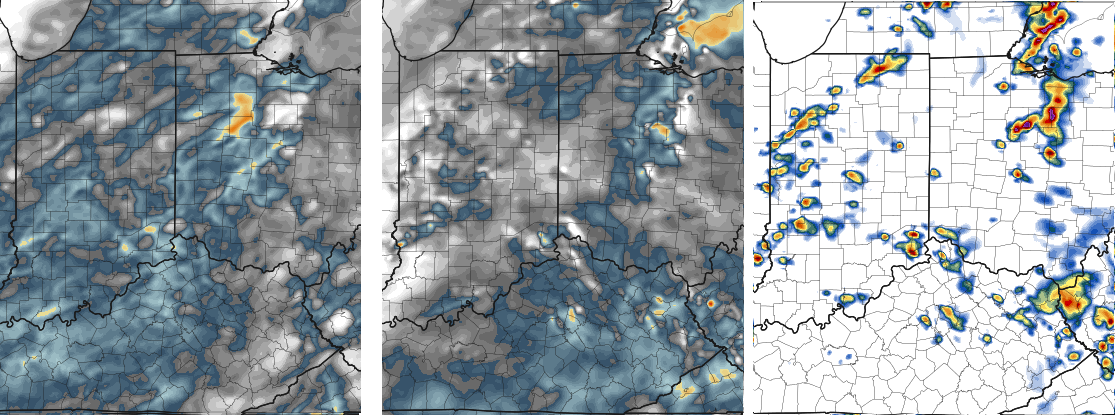
1800Z HRRR Valid for 21:00Z
SB CAPE [J/kg, left], 0-3km SRH [m2/s2, middle], Sim Comp Ref [dBZ, right]
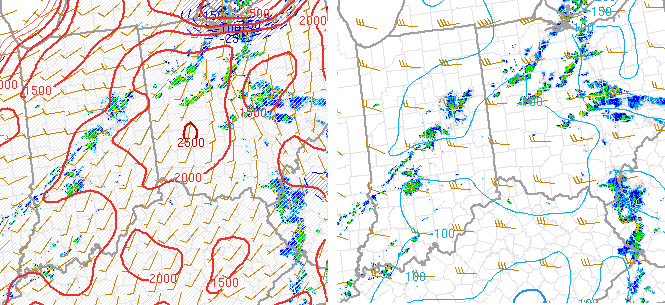
21:00Z SPC Mesoanalysis.
SB CAPE/CIN [J/kg, left] & 0-3km SRH [m2/s2 + Storm Motion, right]
21:00Z Summary:
By this time frame, we entered a lull in the activity as convection pushed off to the northeast. PHS and HRRR kept some lingering activity across the area. Instability varied between the PHS showing a continued higher corridor to the west, with the HRRR that had overall lower values on the order of 1000-1500 J/kg while SPC Mesoanalysis kept higher values above 2000 J/kg.
Convection was slightly overdone by both models by this point.
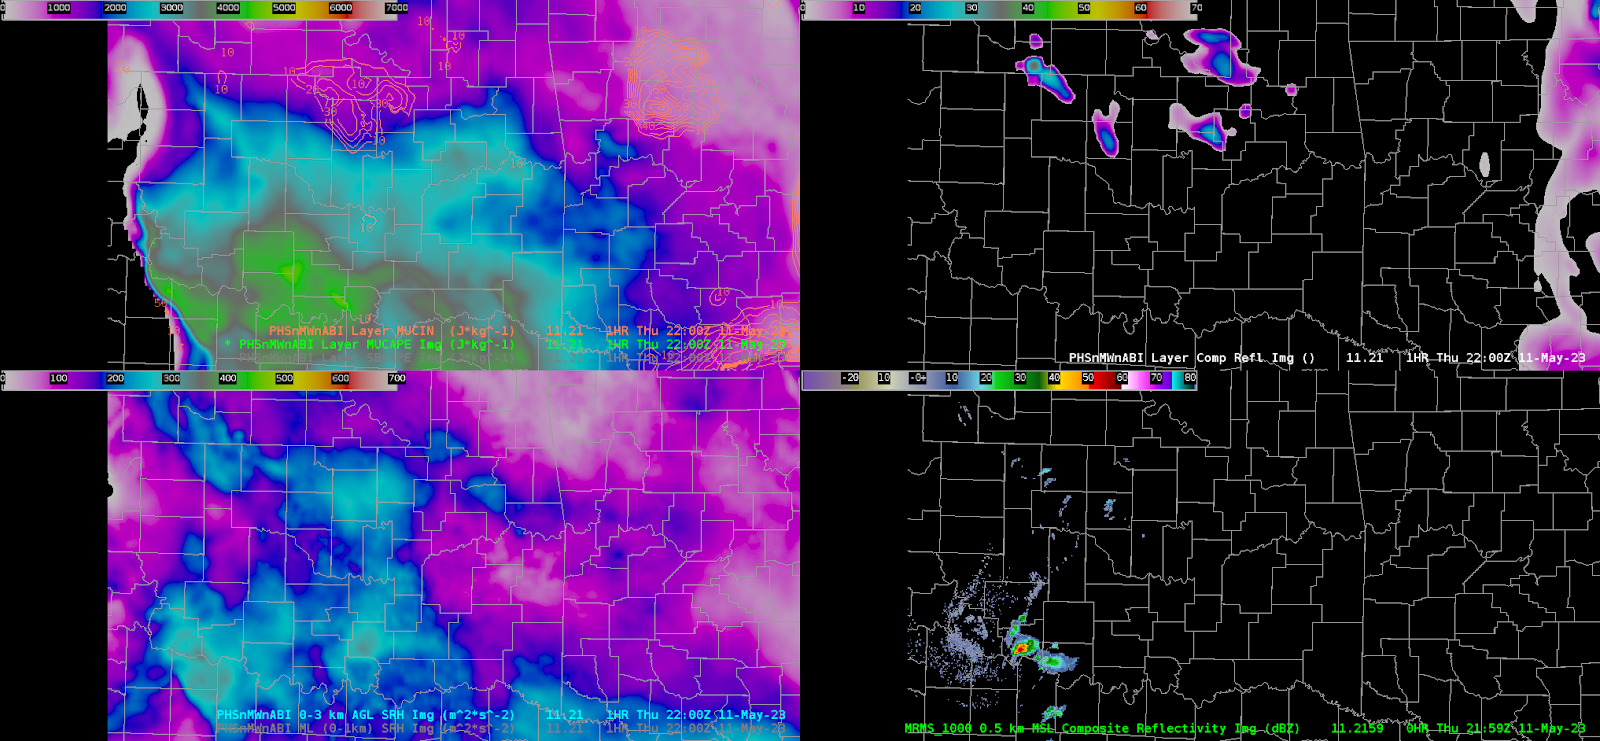
PHS 19:00Z valid for 22:00Z
SBCAPE [J/kg, top left], Layer Comp Ref [top right], 0-3km SRH [m2/s2, bottom left], MRMS Comp Ref [dBZ, bottom right]
1900Z HRRR Valid for 22:00Z
SB CAPE [J/kg, left], 0-3km SRH [m2/s2, middle], Sim Comp Ref [dBZ, right]
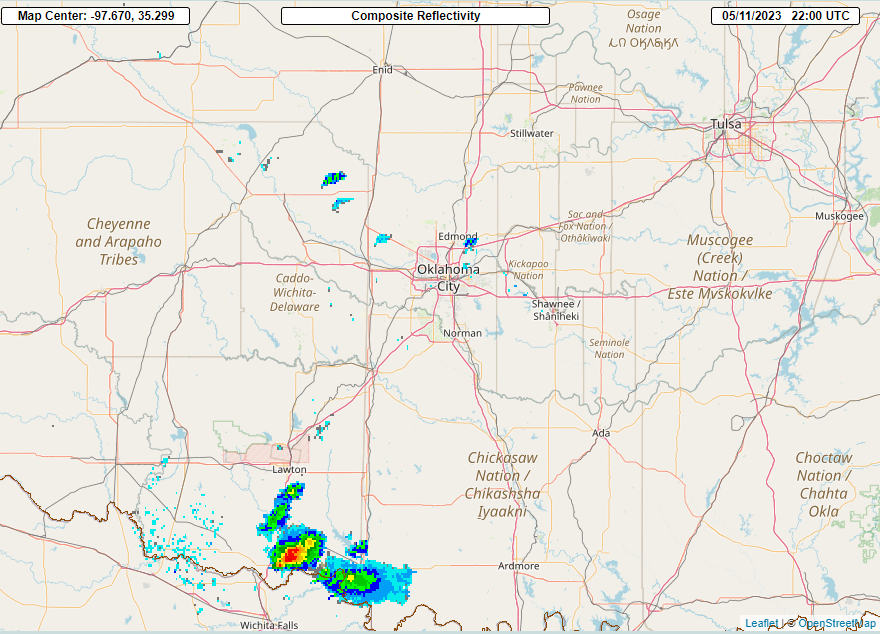
22:00Z SPC Mesoanalysis.
SB CAPE/CIN [J/kg, left] & 0-3km SRH [m2/s2 + Storm Motion, right]
22:00Z Summary:
Started seeing both the PHS and HRRR catch up with diminishing trends in convection. SB CAPE lowered per SPC Meso, closer to HRRR/PHS suggested forecast values but the PHS remained consistently high at estimated 0-3km SRH to the SW of the CWA that did not match SPC mesoanalysis values.
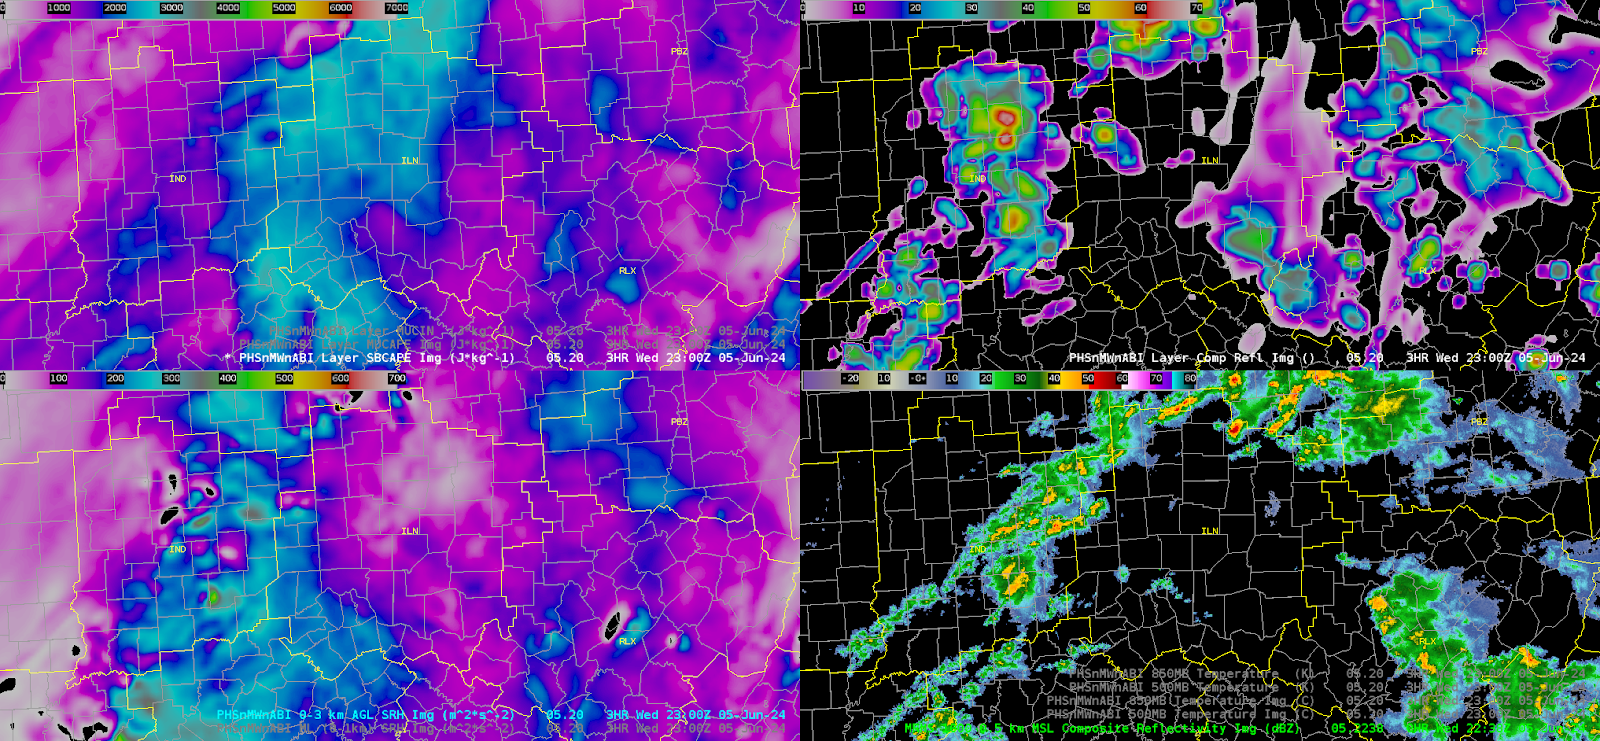
PHS 20:00Z valid for 23:00Z
SBCAPE [J/kg, top left], Layer Comp Ref [top right], 0-3km SRH [m2/s2, bottom left], MRMS Comp Ref [dBZ, bottom right]
2000Z HRRR Valid for 23:00Z
SB CAPE [J/kg, left], 0-3km SRH [m2/s2, middle], Sim Comp Ref [dBZ, right]
22:00Z SPC Mesoanalysis.
SB CAPE/CIN [J/kg, left] & 0-3km SRH [m2/s2 + Storm Motion, right]
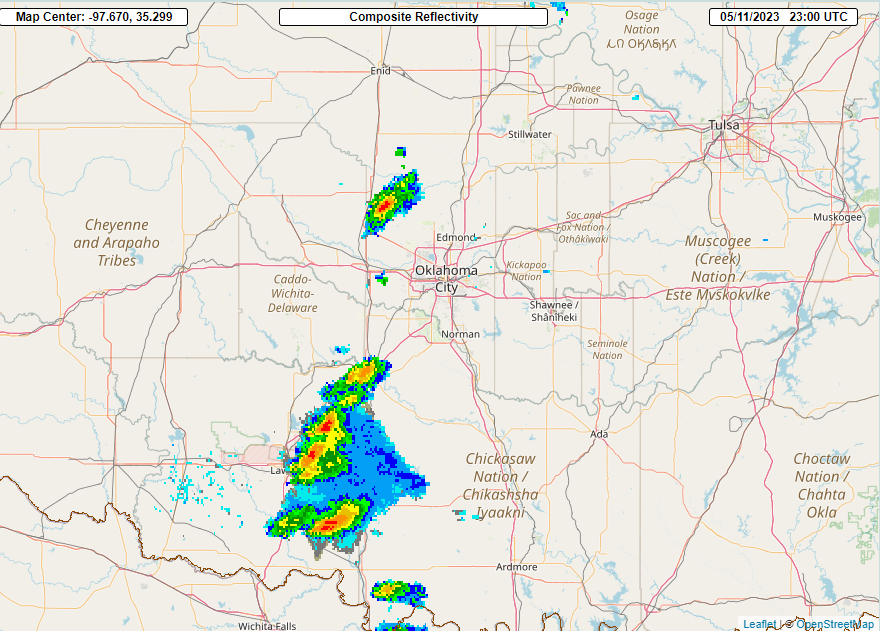
23:00Z Summary:
Activity started to perk ip along the front to the west, associated with greater forcing while both models hinted at this temporary lull persisting (HRRR being slightly more aggressive with convective coverage). The HRRR started to pinpoint a steady increase in 0-3km SRH to the south reaching around 200-250 m2/s2 but still was shy of PHS forecast values around 250-350 m2/s2. SPC Mesoanalysis continued to show much lower 0-3km SRH.
Total Event Summary
- Both the HRRR and PHS forecasted lower SBCAPE values than SPC Mesoanalysis data depicted. The HRRR being the lowest on the order of 1000-1500 J/kg. The PHS constantly pinpointed a greater axis of instability to the west reaching 1500-2000 J/Kg while SPC Meso illustrated much more widespread areas of 2000-2500J/kg of SBCAPE.
- The PHS was much more aggressive with predicting an increase of 0-3km SRH from the southwest with values reaching 250-350m2/s2. The HRRR illustrated this increase, but position was displaced more east and magnitude was much lower in the 100-200m2/s2 range. Both models were considered aggressive compared to SPC mesoanalysis trends showing values ranging mainly around the 100 m2/s2 range.
- In reality, per SPC Mesoanalysis hourly trends, the lull of activity between 21-23Z could be due to lack of large-scale forcing regardless of the widespread areal coverage of available instability coincided with low values of shear. Greatest forcing was along the approaching front, which increased going into the later hours.
- Both the PHS and HRRR trends depicted overall slightly greater convective coverage throughout compared to observed, with noticeable differences between the two compared to SPC meso data.
– RED11248


 \
\