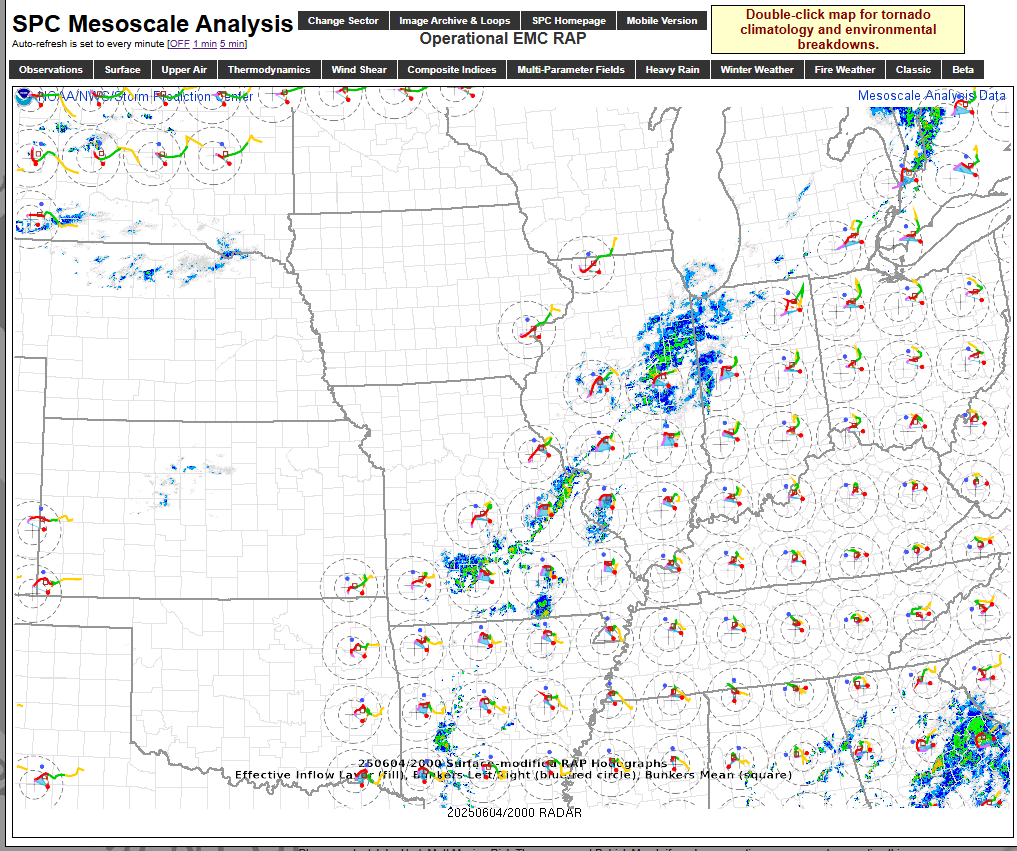
SYNOPSIS – Scattered to numerous thunderstorms developed along a slow-moving frontal boundary from Illinois to Arkansas. The environment was weakly sheared (20-25kt effective) and moderately unstable (1000-1500j/kg MLCAPE). Of note, along the frontal boundary there was a plume of higher 3CAPE (125-150j/kg) that developed near and to the southwest of the St. Louis metro.
OPERATIONAL NOTES AND FEEDBACK – Using GREMLIN and OCTANE in the absence of radar data
For today’s experiment, we were given satellite and lightning products, but no radar data. This presented a unique challenge, but also a unique opportunity to test the performance of new technology in a live warning environment with limited data.
Since GREMLIN is designed to mimic radar, it stands to reason that it could be a decent backup in situations where radar data is missing or significantly lacking. However, because it mimics composite reflectivity, which doesn’t tell the full story of a thunderstorm, additional information is needed for warning decisions. This is where OCTANE potentially comes in.
From a probabilistic standpoint, OCTANE products have shown skill in identifying which thunderstorms carry a higher probability of severe weather than others. My goal today was to determine if OCTANE and GREMLIN products could be combined to provide a warning forecaster a reasonable starting point for warning decisions and warning creation. OCTANE was used to help identify which thunderstorms had a higher probability of becoming severe, while GREMLIN data was used in tandem with lightning data to draw appropriate warnings.
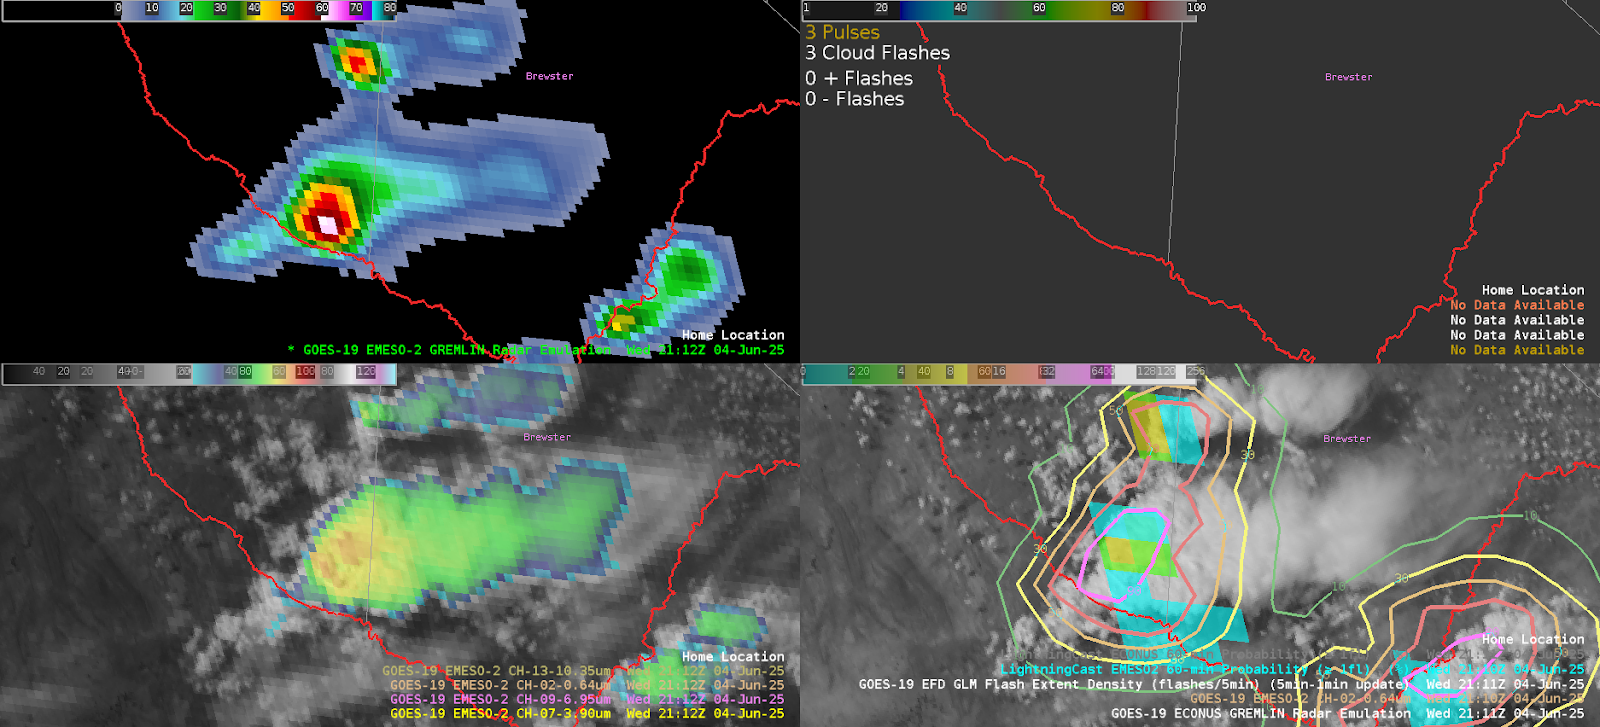
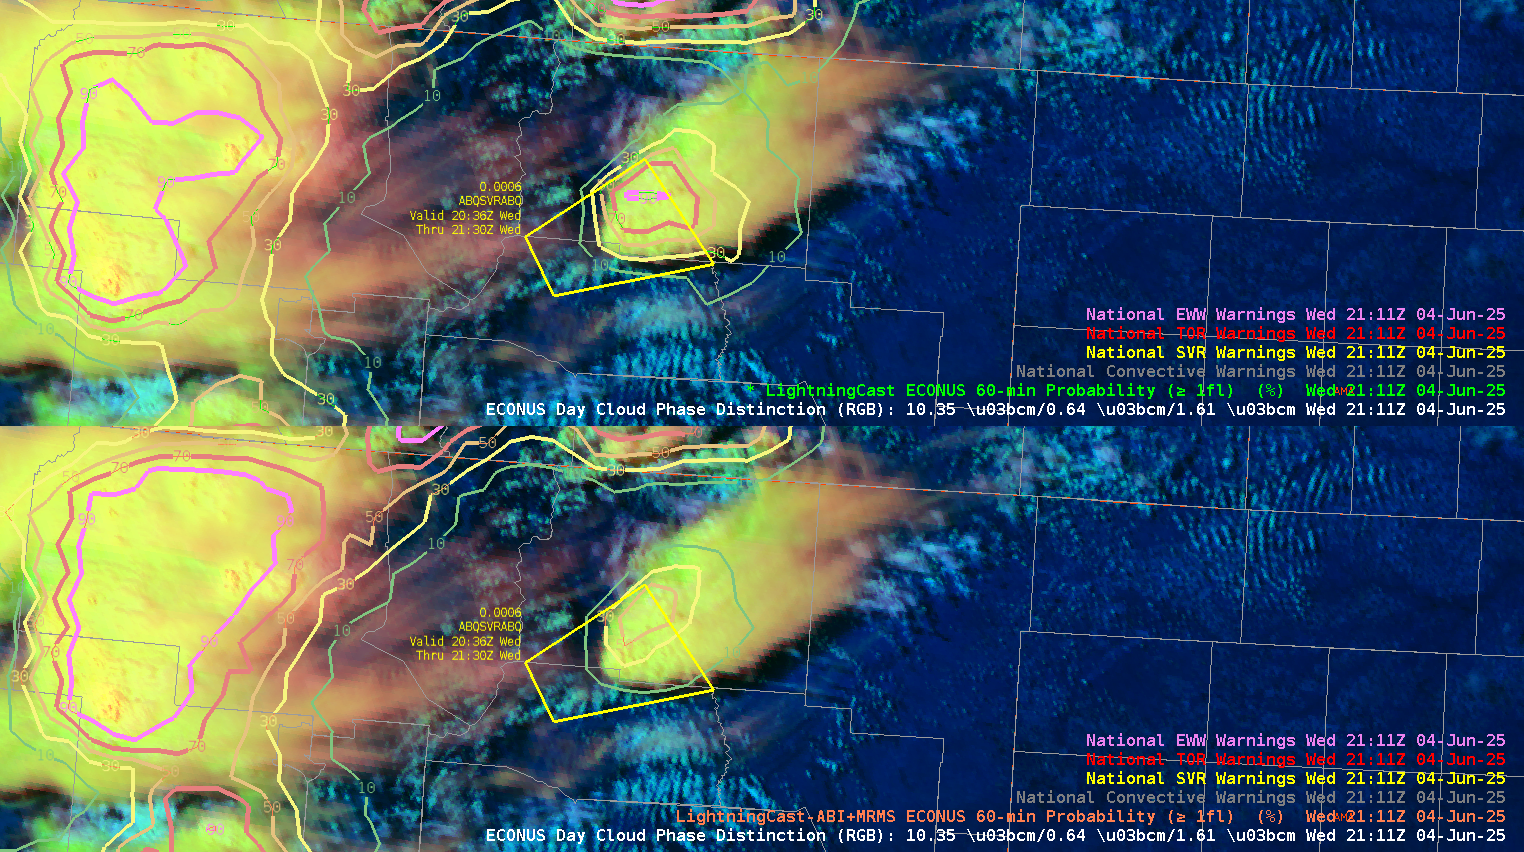
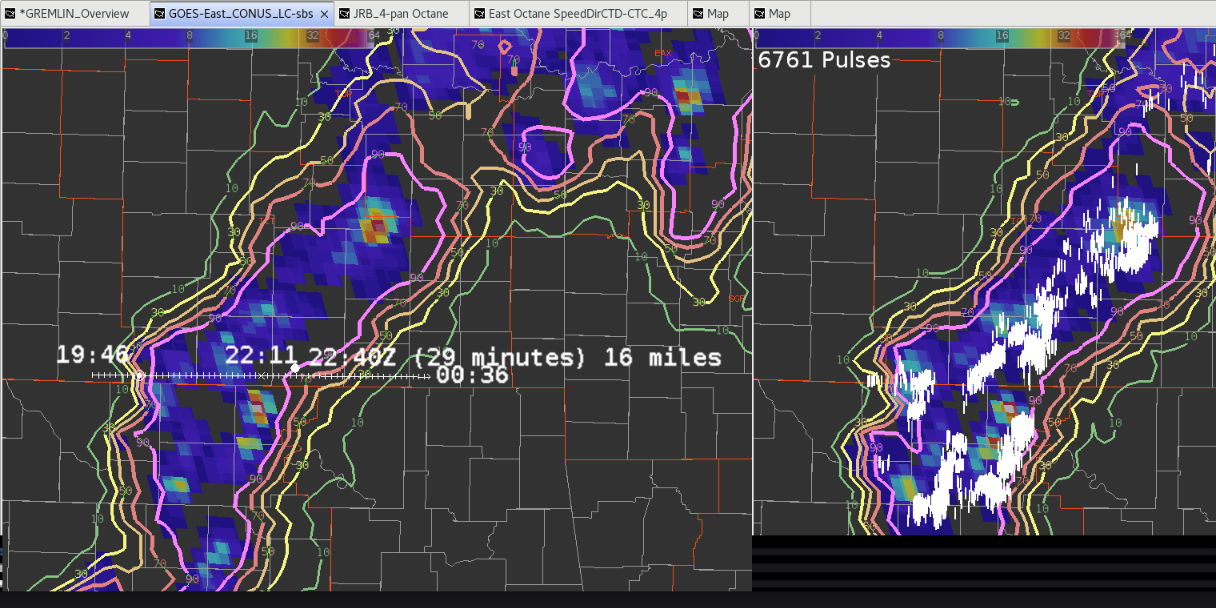
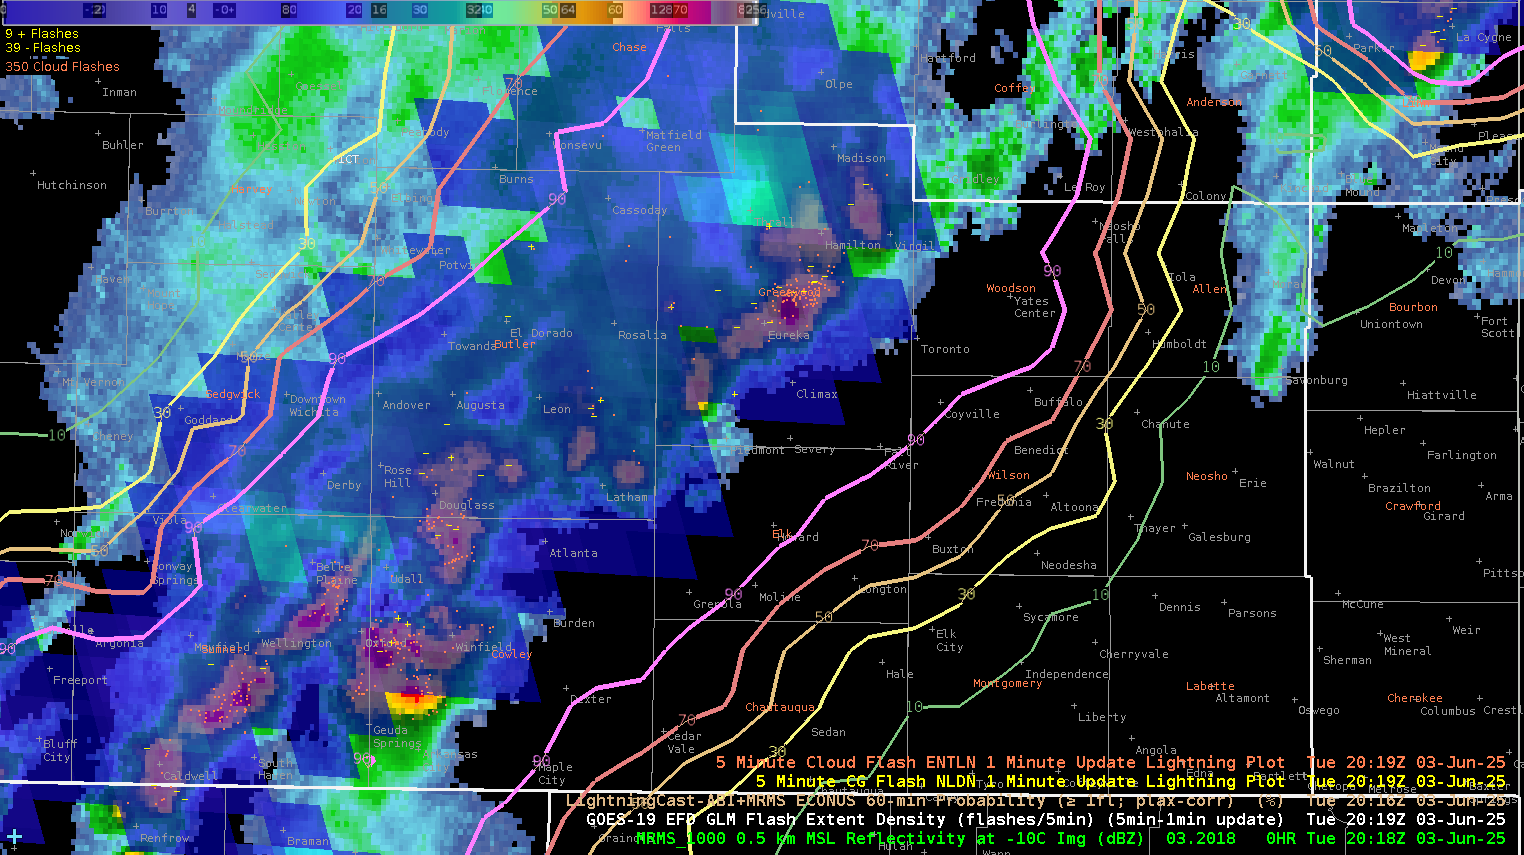
In Figure 1 below, the OCTANE speed product showed an updraft over the central part of WFO LSX (SW of St. Louis) that was strong enough to impede the background flow aloft, suggesting a notably strong updraft. At the same time, there was a significant increase in lightning noted. This information seemed to suggest an increased risk of severe weather with the associated thunderstorm, and a Severe Thunderstorm Warning (yellow box) was issued at 1944z. GREMLIN data was used in tandem with GLM and ENTLN lightning data to help draw the most appropriate polygon possible (Figure 2). Seven minutes later, at 1951z, wind damage and a tornado were reported in the warned area. While this is only one case, it suggests that with satellite and lightning data alone, there is an opportunity to get lead time on severe weather, even in the absence of traditional radar data. It is also noteworthy that GREMLIN emulated radar reflectivity seemed to take on a bit of a bow shape which was later discovered to be not too dissimilar from actual WSR-88d radar data from WFO LSX. This is something I didn’t expect, and was a pleasant surprise. It also seems to give even more credence to the idea that GREMLIN could be a sufficient backup where radar data is lacking.
To me, this suggests an exciting and promising future for OCTANE and GREMLIN products, especially when used in tandem with each other, and especially in areas with limited, or no, radar coverage. For general comparison with GREMLIN data, Figure 3 shows a short radar loop (from WFO LSX) of the thunderstorm that was warned on. This radar data was analyzed after today’s experiment was over, and no radar data was used for warning decisions during today’s experiment.
Figure 1 – Octane Speed + convective warnings (top left), Octane CTD_no smoothing (top right), Octane CTD_medium smoothing + GLM lightning (bottom left), Octane CTD_high smoothing (bottom right)
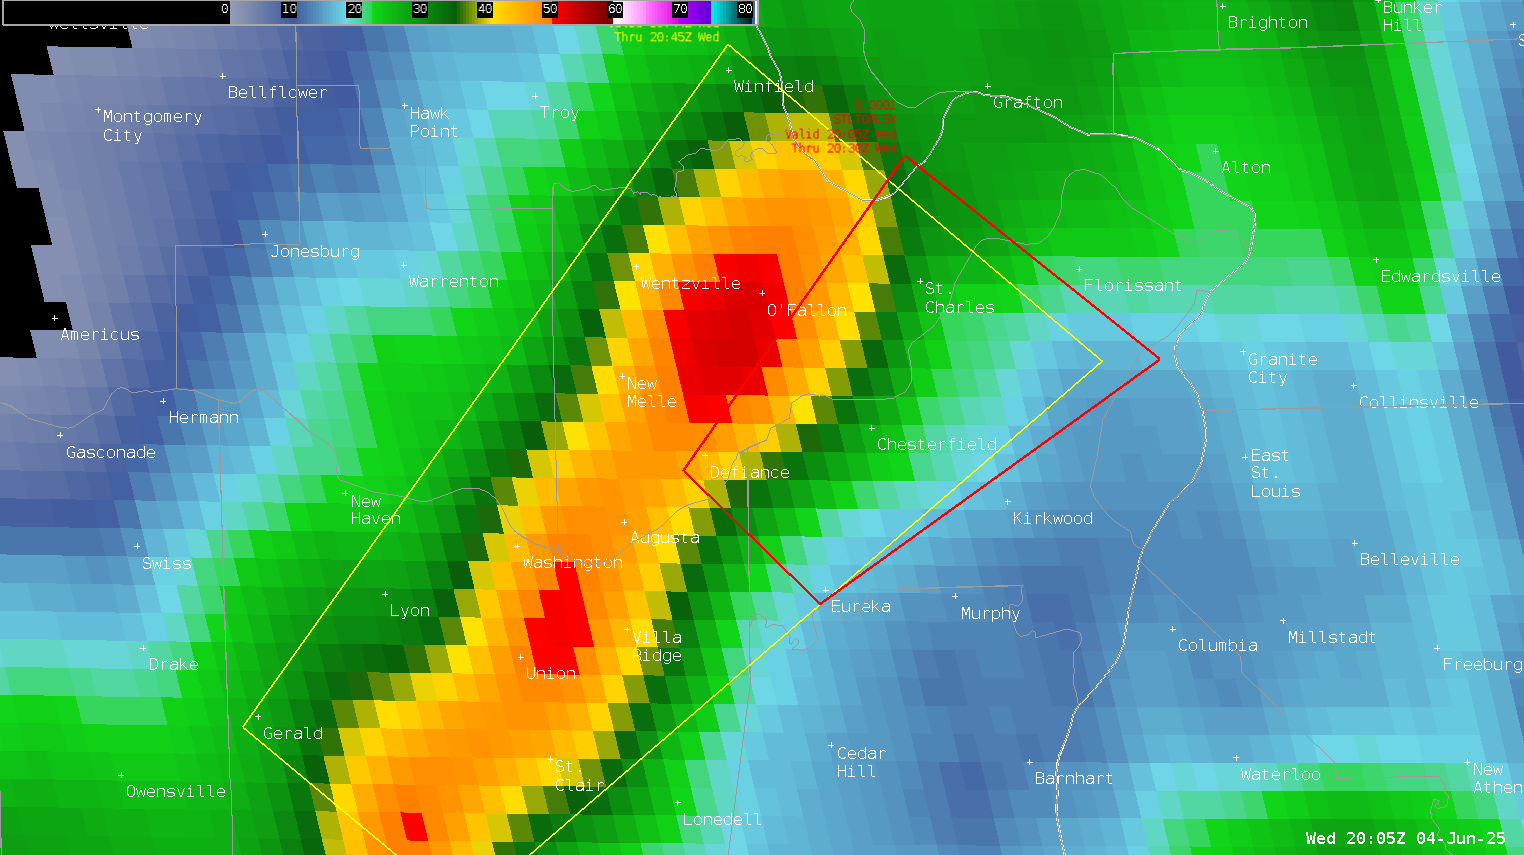
Figure 2 – GREMLIN emulated reflectivity + convective warnings
Figure 3 – WSR 88D Radar Data from WFO LSX
It should be noted that while lead time for severe weather was achieved, the tornado report came without a Tornado Warning. While GREMLIN and OCTANE appear to have skill in identifying which thunderstorms may need a warning and which may not, there appears to be less skill in identifying specific hazards (tornadoes, large hail, damaging winds). This is where traditional 88D radar excels, especially since the advent of Dual Pol data. This is another great example of the need for skillful mesoanalysis during convective events, especially during radar outages. GREMLIN and OCTANE products can provide a probabilistic foundation for where to issue warnings, while skillful mesoanalysis can help provide a probabilistic foundation for what type of warning to issue and for what types of hazards.
– NW Flow


.png)
.png)