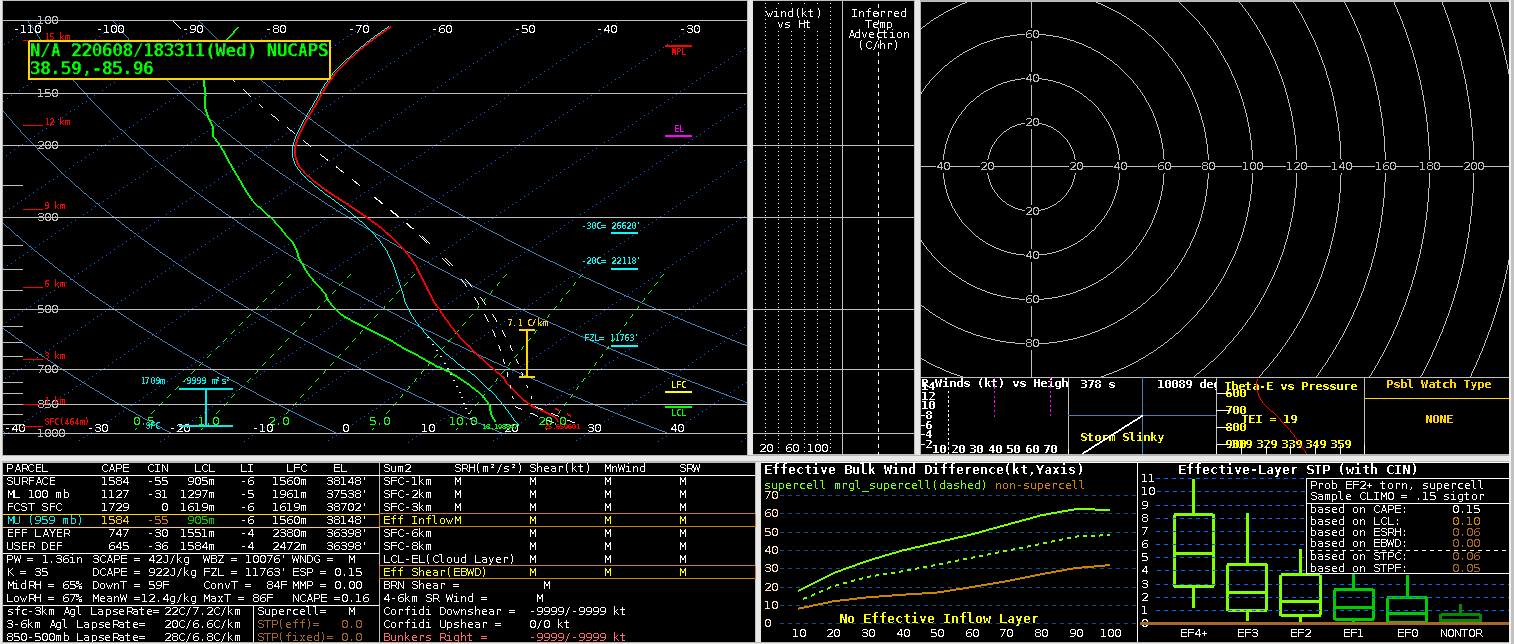
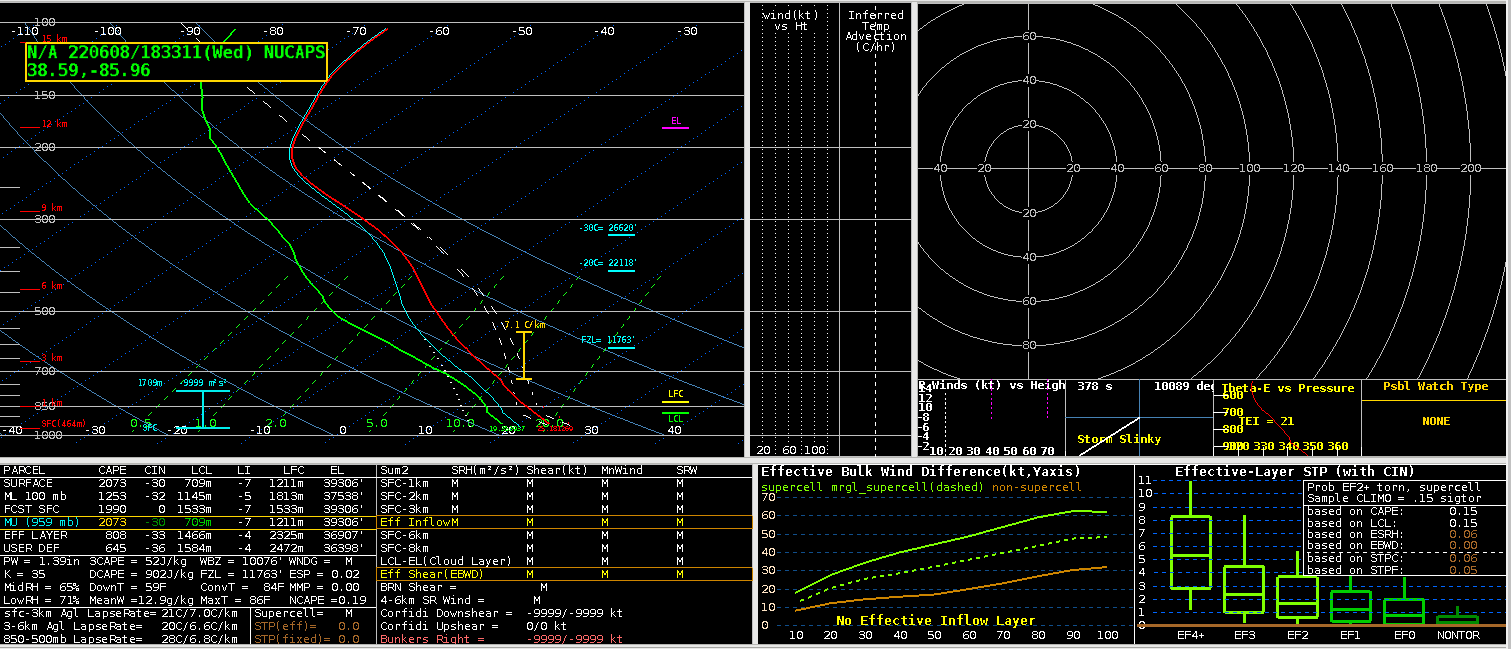
NUCAPS
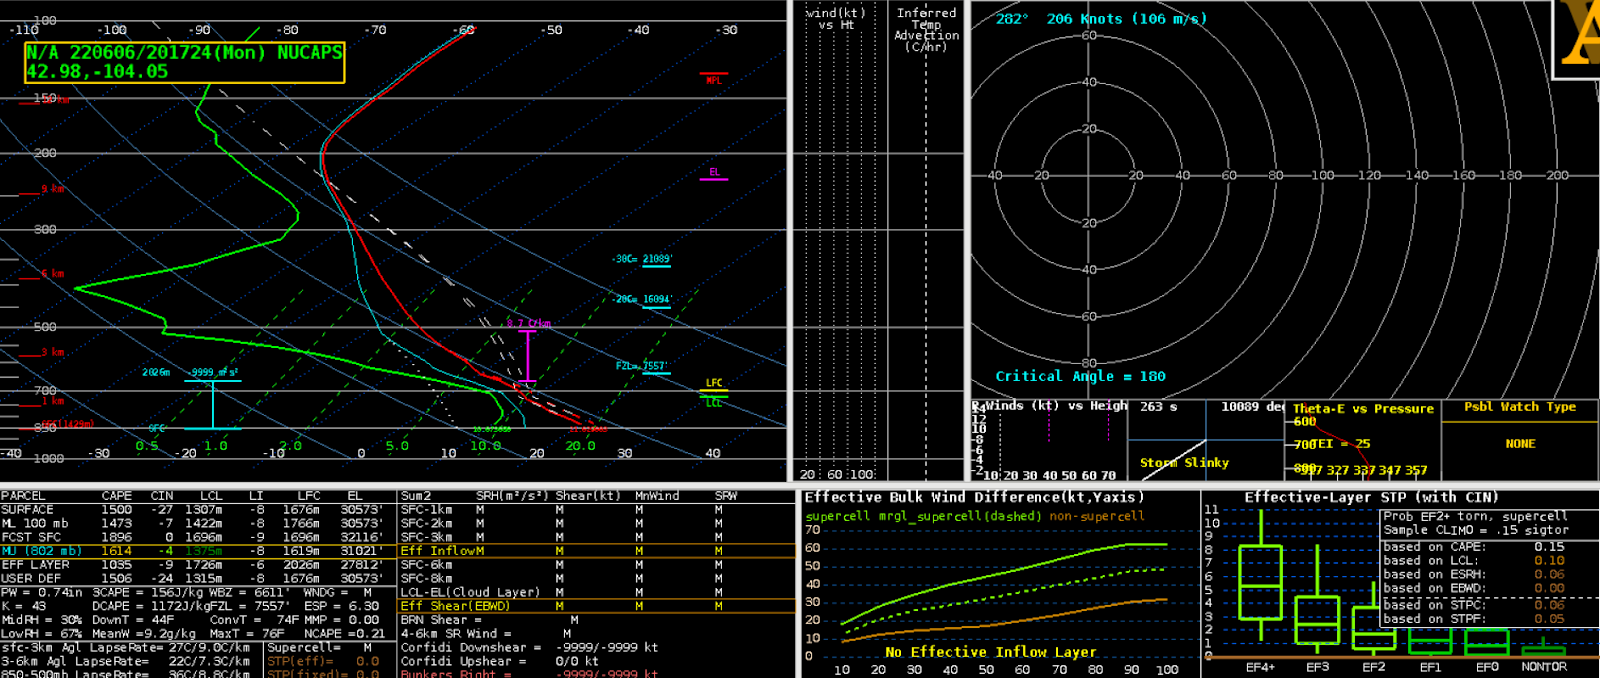
Did finally get a chance to check out NUCAPS for today’s case as the timing and location of the data was more compatible. It was good info ahead of the storms as it showed the low LCL values (mainly noticed in the modified soundings), below 1000 ft which is what you want to see for potential tornadoes. Overall, liked getting to dig into the NUCAP soundings, but given the finicky timing and data quality, it’s not something I could use on a regular basis for warning operations. Would be better suited for short term forecasting or possibly as the mesoanalyst.
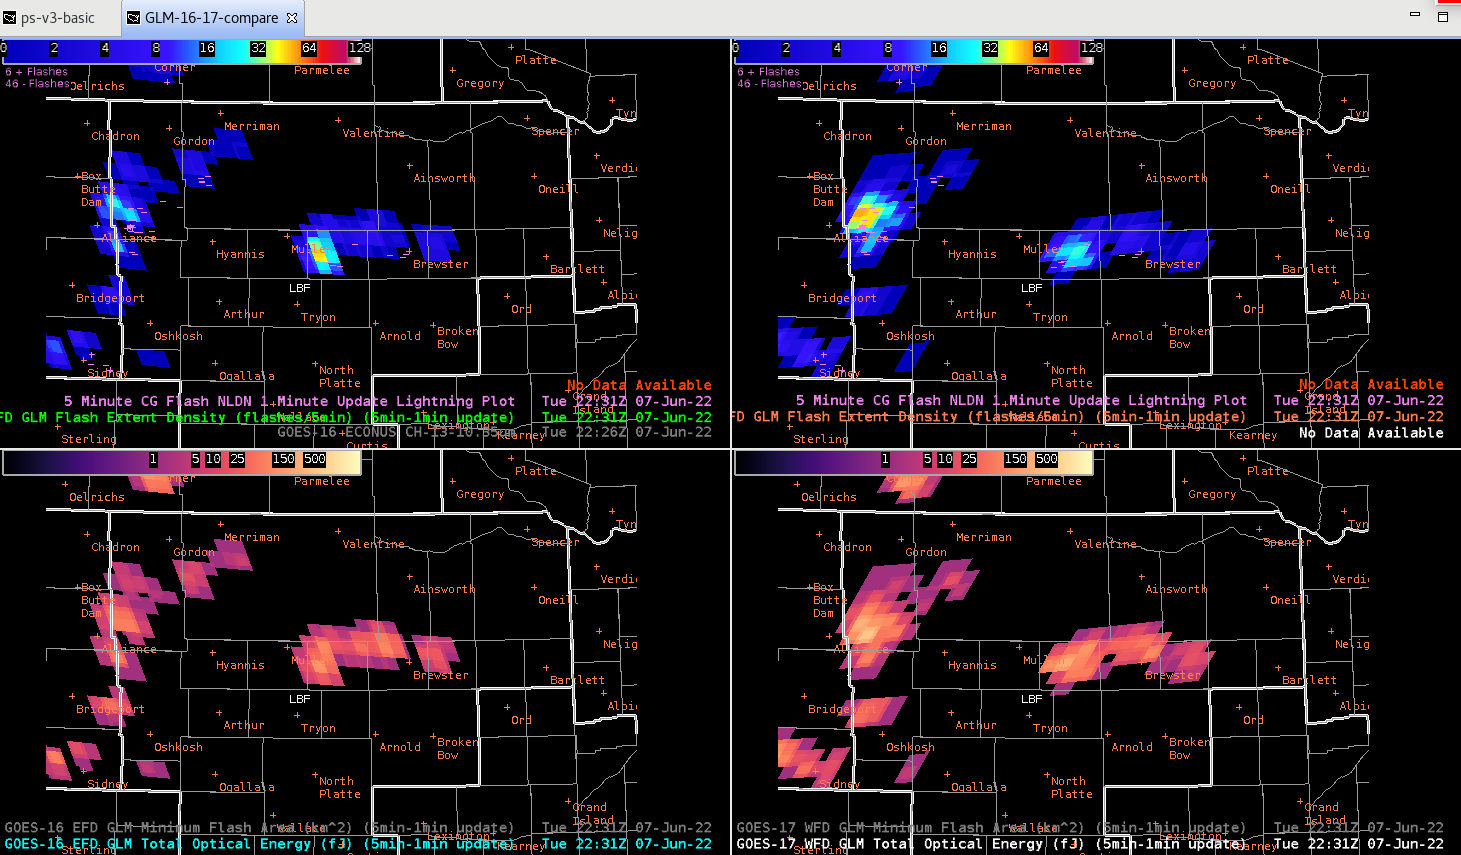
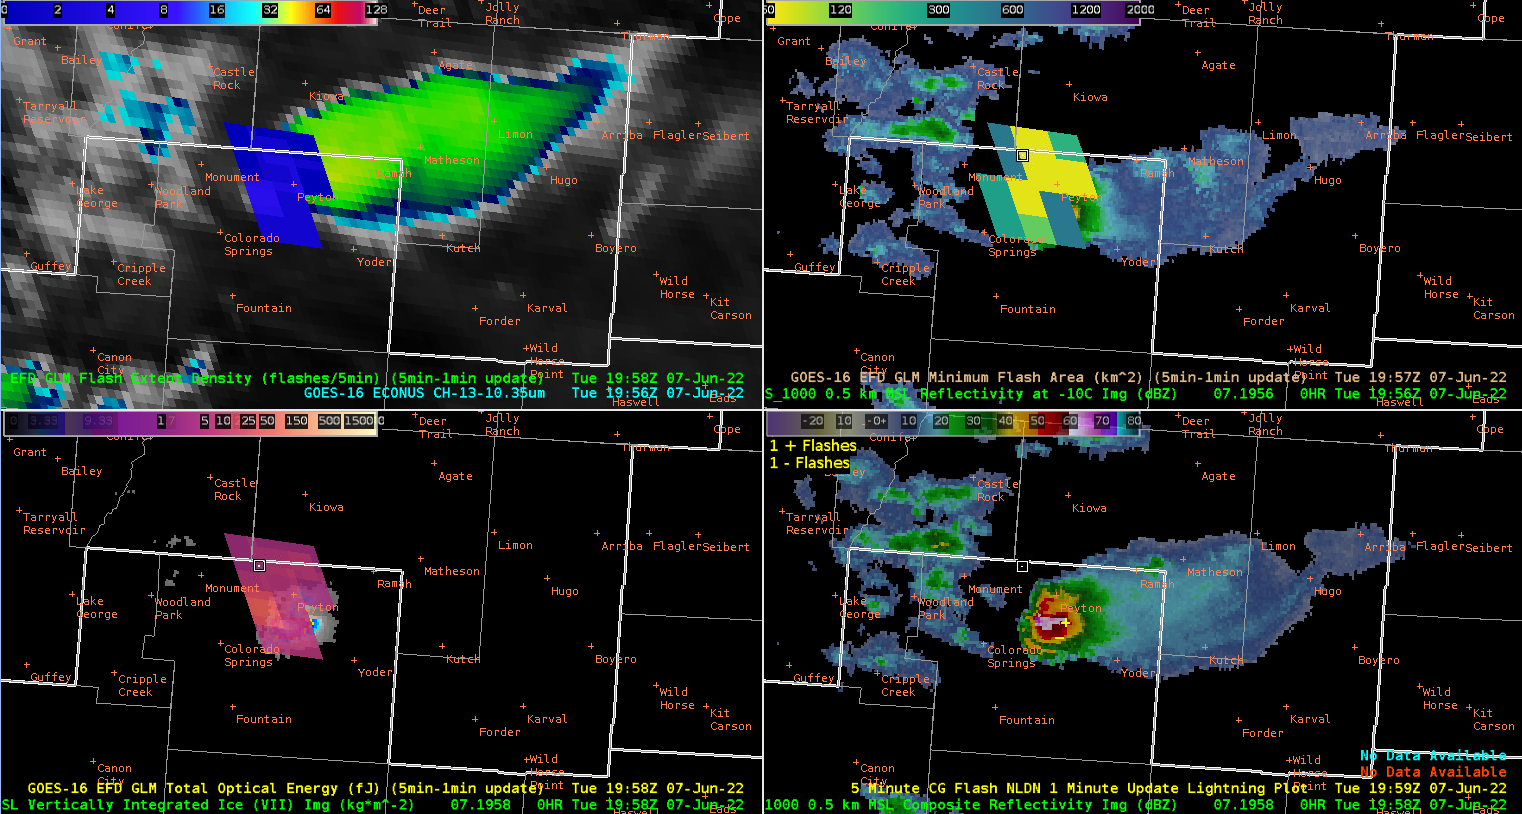
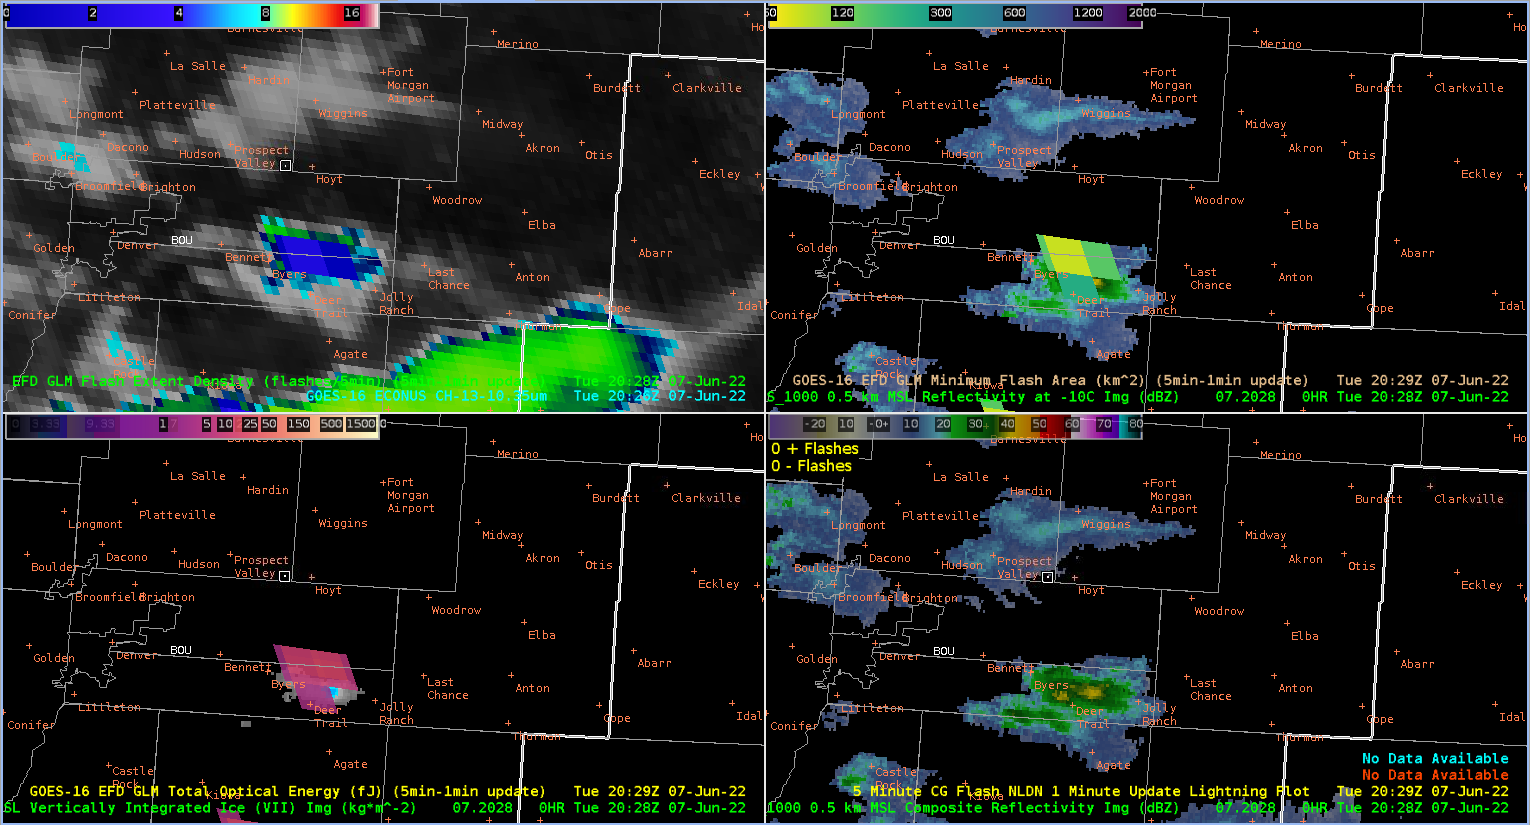
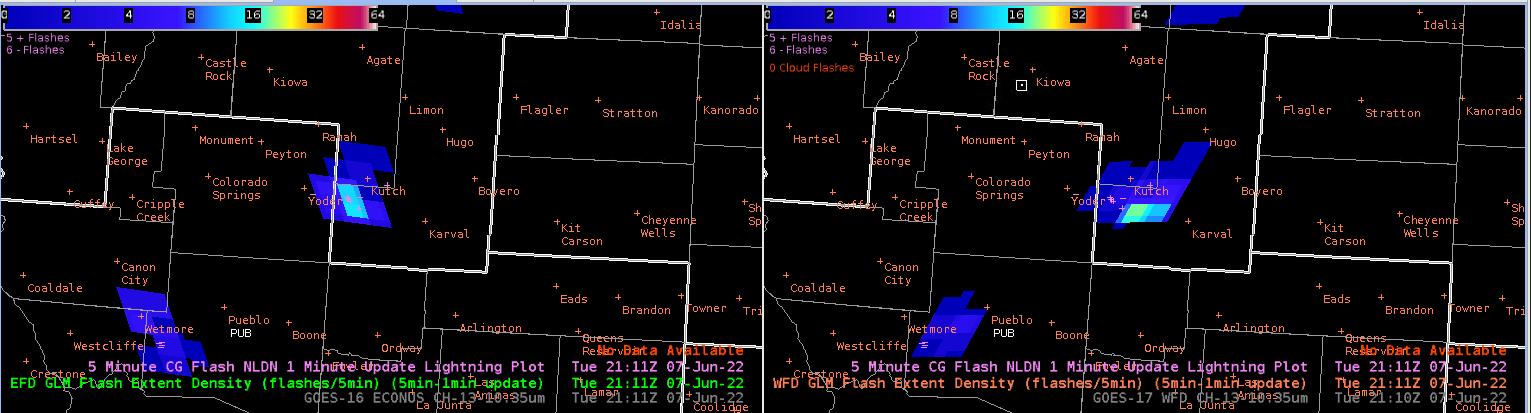
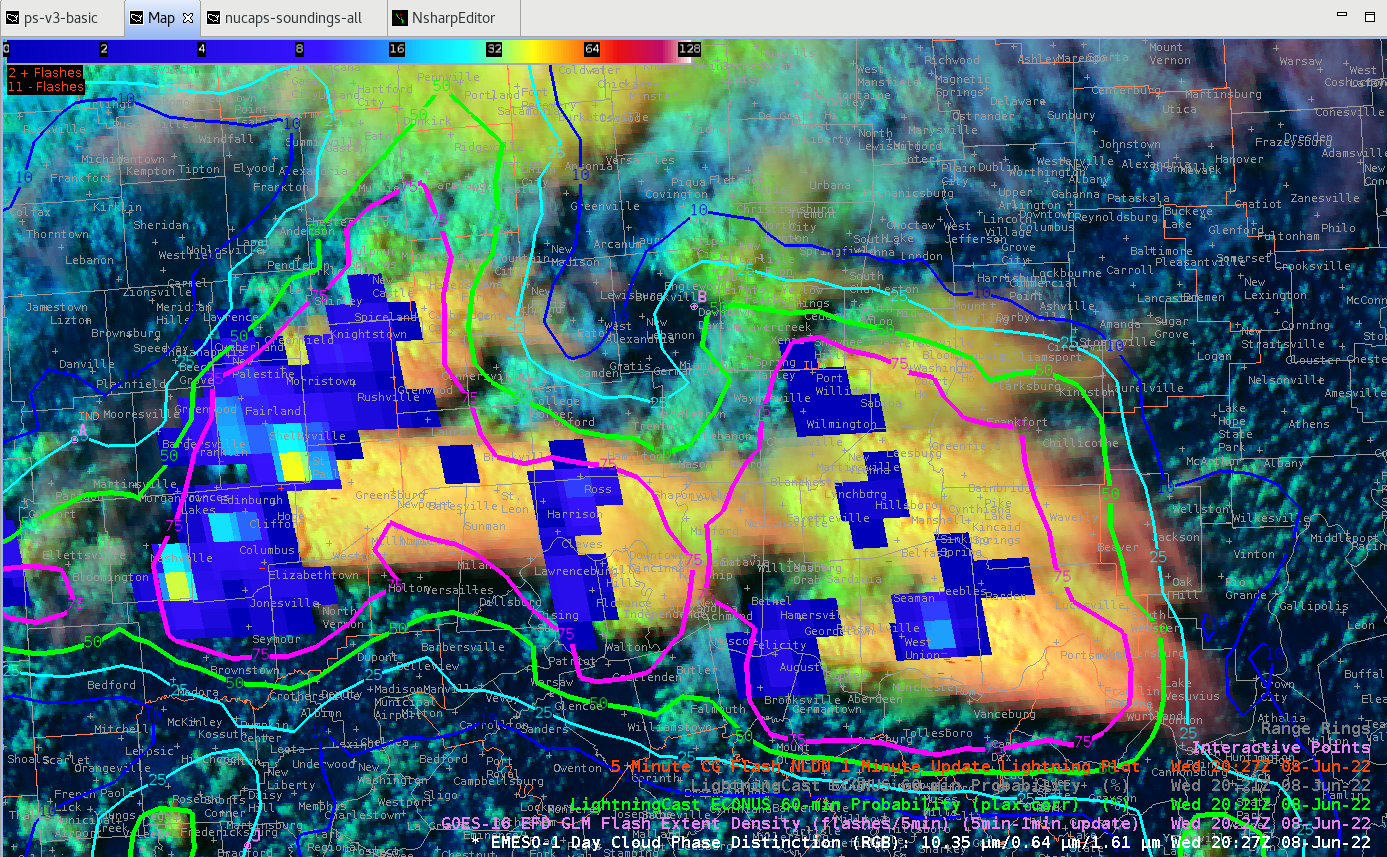
GLM & LightningCast
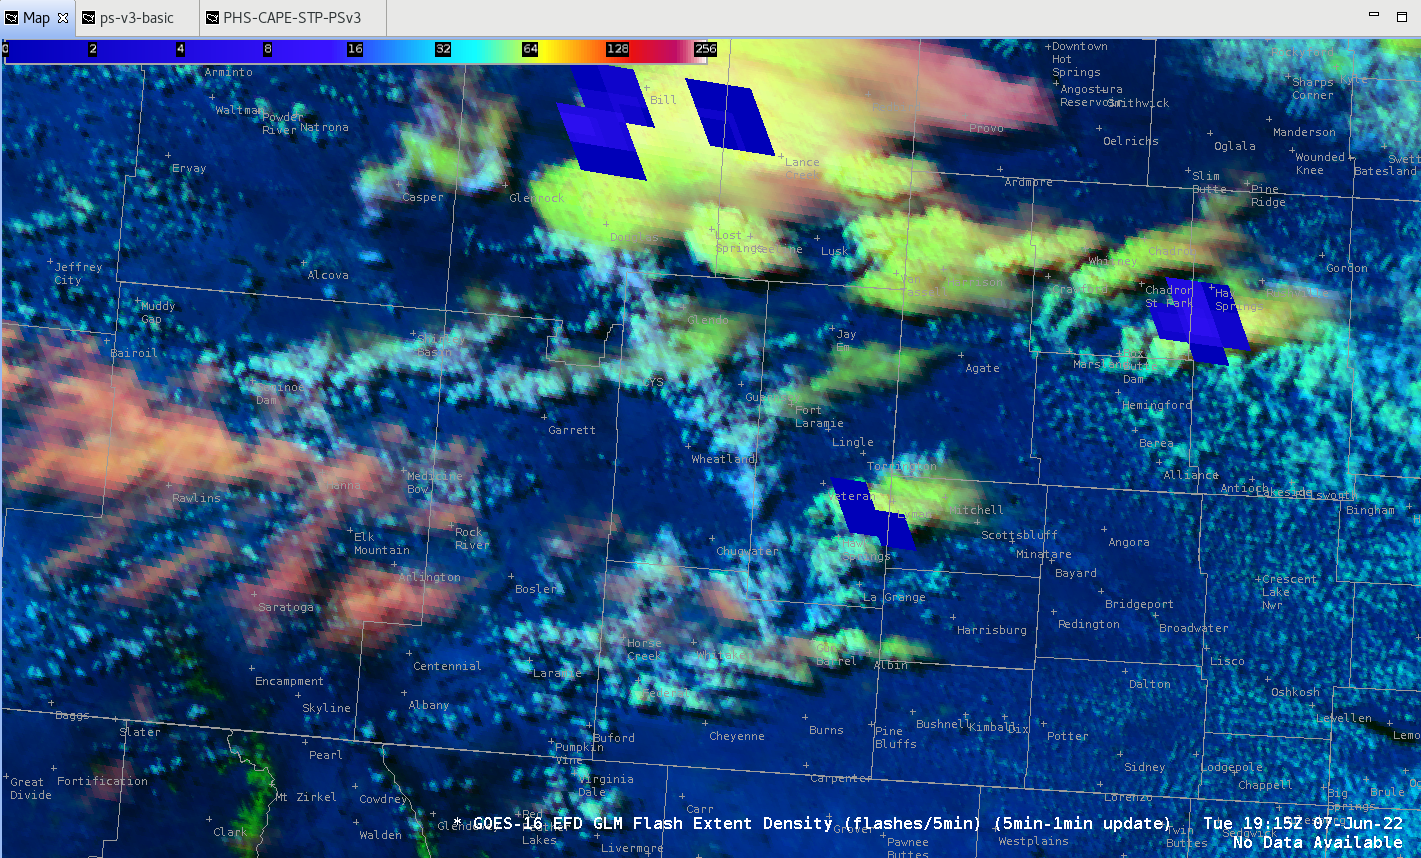
For GLM, I set the max value at 130. I originally set it to 65 as I had been using in the high plains the past few days, but for these midwest storms it seemed too sensitive. 130 was a good value for today, likely because of the larger and more numerous storms than I dealt with today versus the previous days.
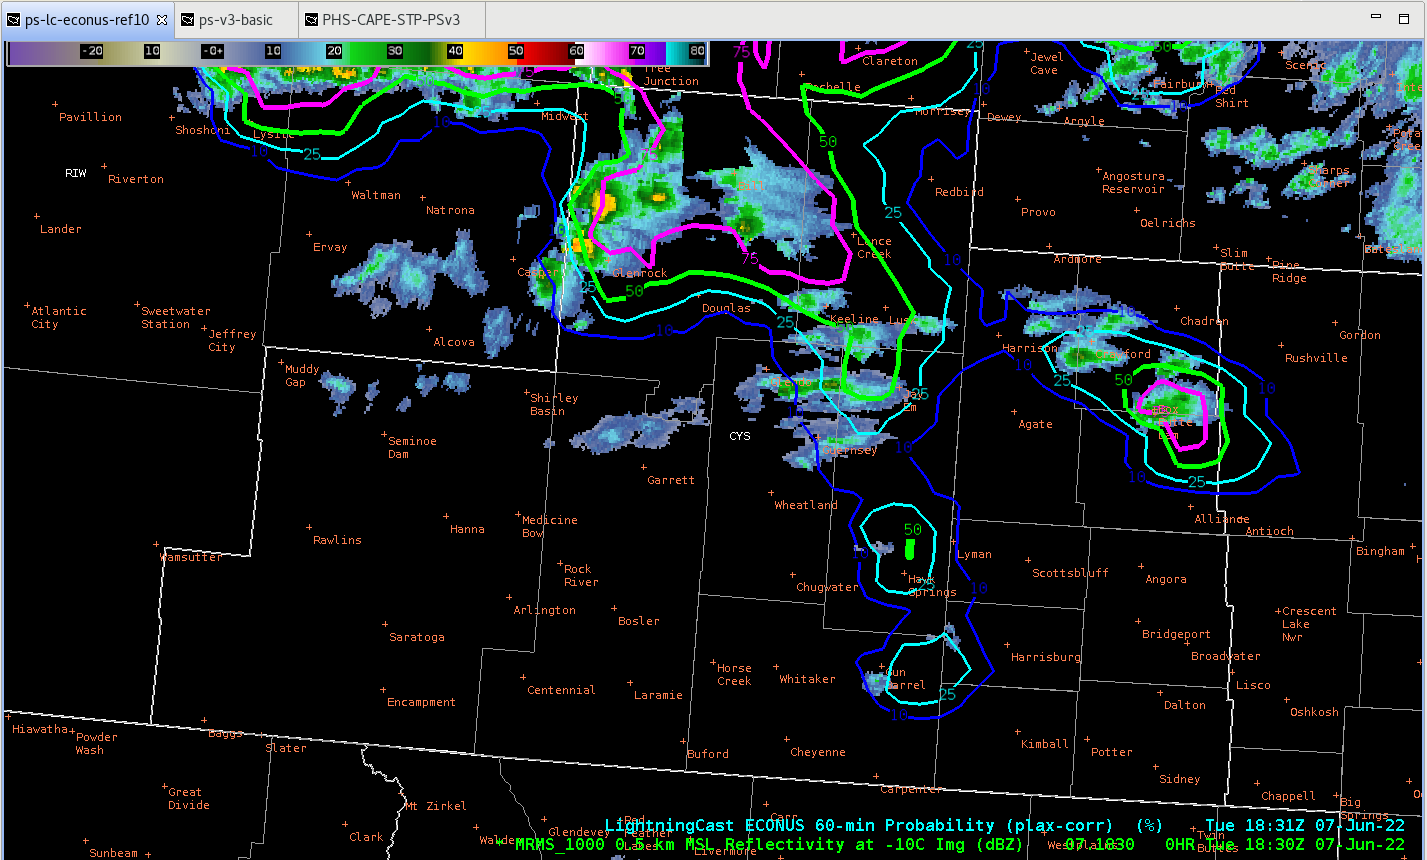
Also tried out the parallax corrected LightningCast today. Liked that it gave a more accurate location when using it for a specific location such as today’s DSS event. While it was made to pair with radar, it was still useful when using it with satellite products – just had to take a few seconds to make the mental adjustments at the beginning.
PHS
Prior to entering the ILN CWA, the PHS STP showed an area of high STP values in and near Rush County, Indiana. The actual IND office did issue a tor warning for this area at 4 PM ET.
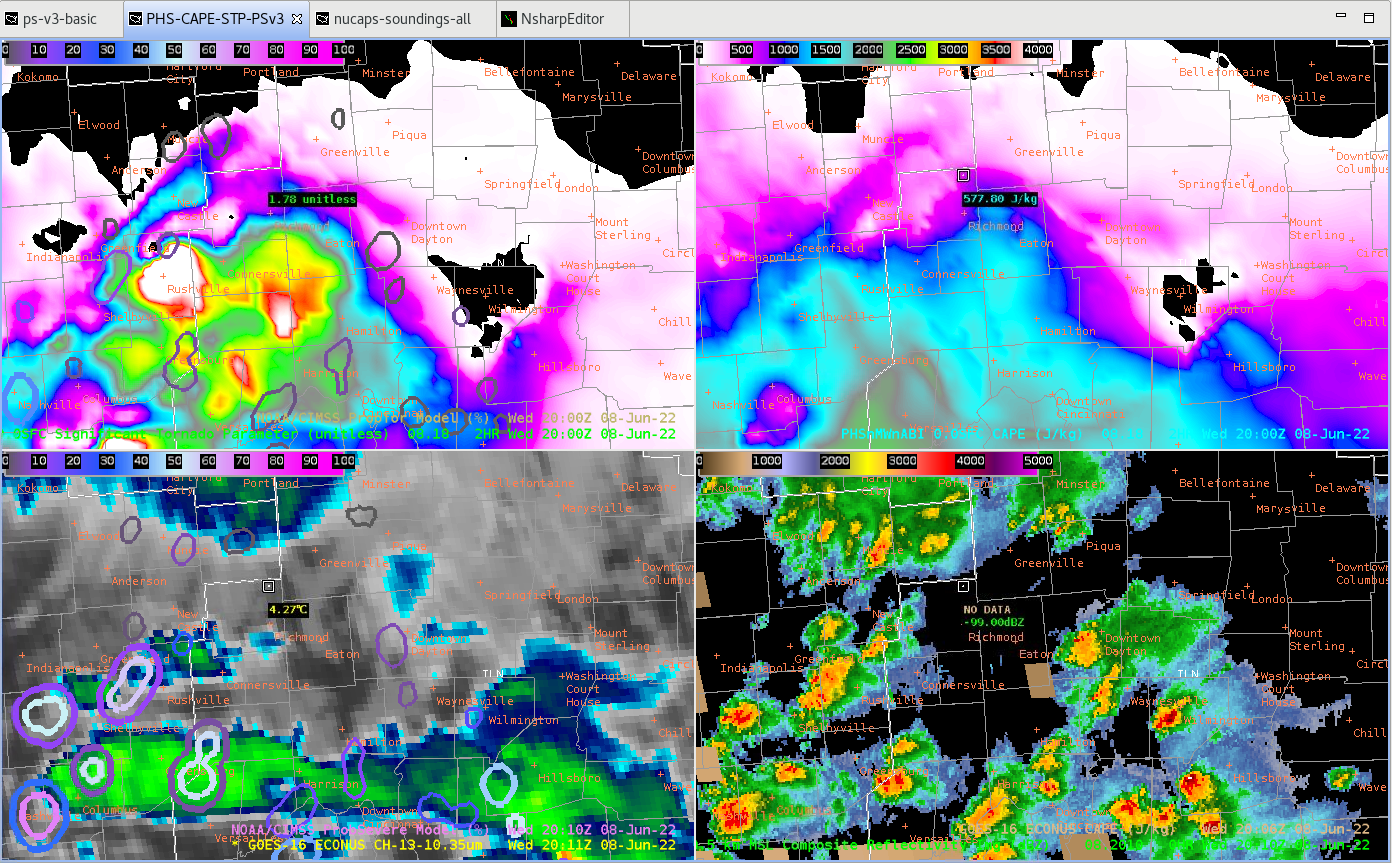
Over time, I did notice that for STP, really just the current hour and the next couple of hours were useful. Jumping to 3 or 4 hours ahead it seemed that the data was missing for areas I expected to see higher values. Once the next run came in and I went back and looked, the data was much better. For an example below, there was a vast difference for 21Z between the 18Z run and the 20Z run where the 18Z run for that time did not seem realistic but the 20Z run was more what I expected to see.
08.18 run for 21Z

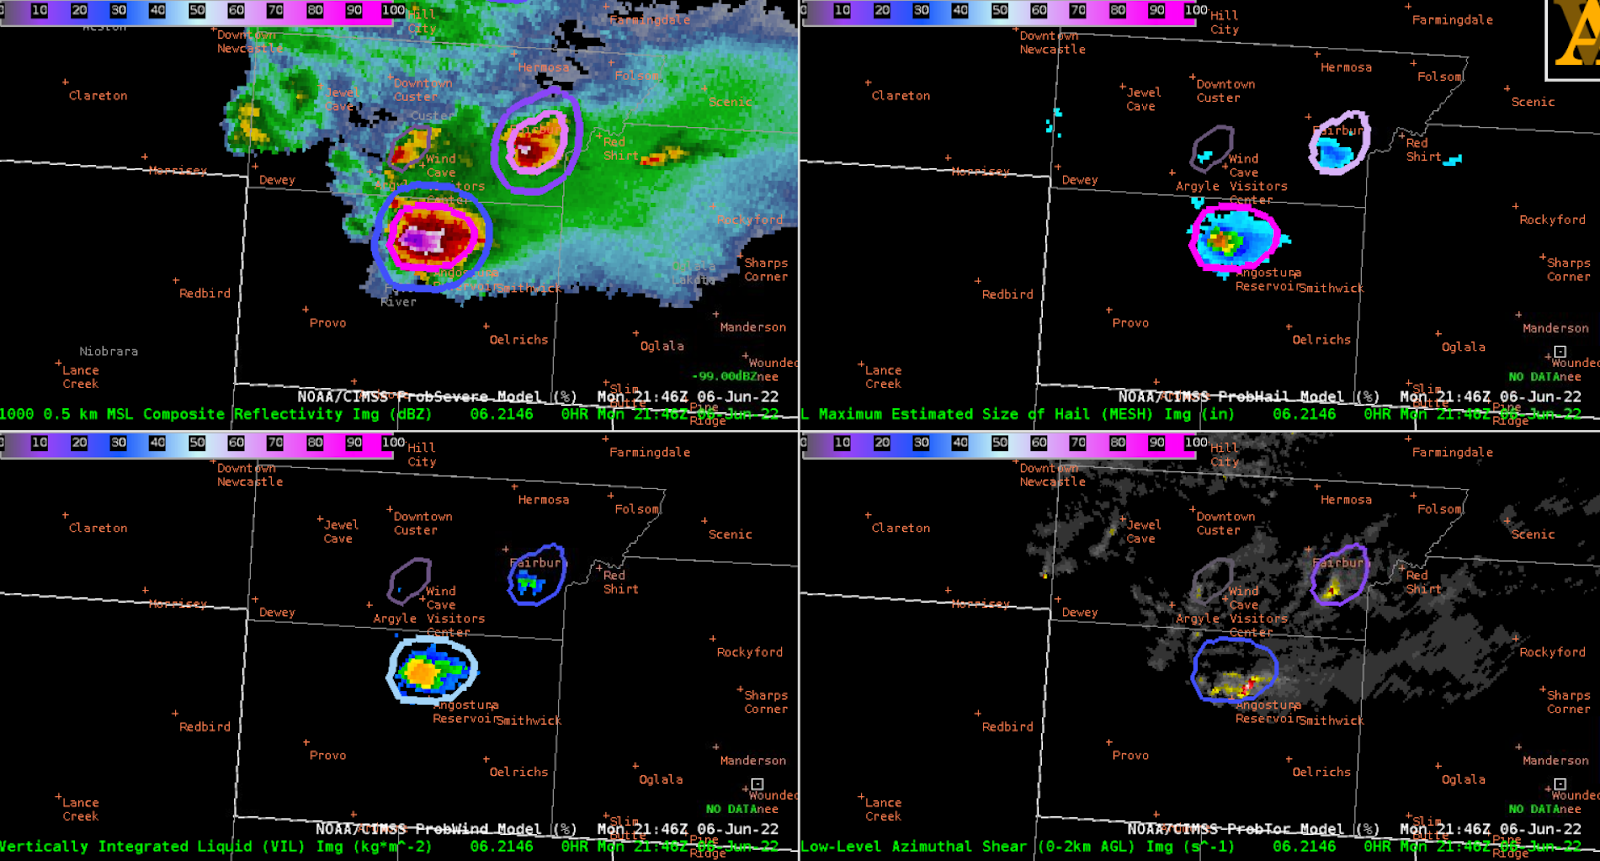
ProbSevere
After talking with one of the ProbSevere people, was able to learn that the threshold for ProbTor is lower than that for Wind or Hail. For training purposes, it would be good to include this information to give a mental threshold for forecasters, such as an ongoing tornado would likely see a max of around 60% for ProbTor. It makes sense that the probs would be lower for tors just as they are for SPC outlooks where the tor percentages are also lower than that for wind or hail.
– Matador