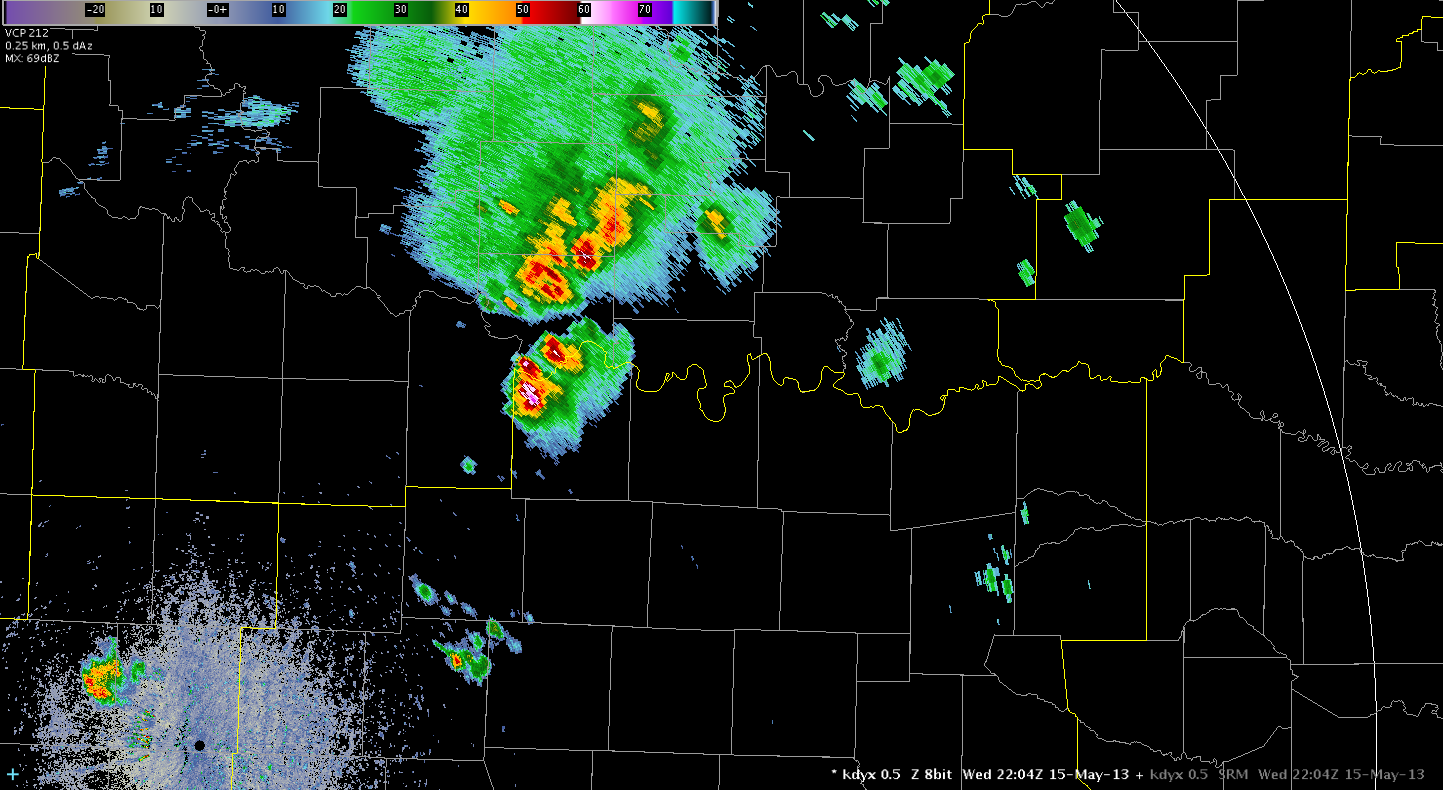
A lightning jump of 18 Flash/Min to 40 Flash/Min between 1908 and 1909Z with a second jump to 51 Flash/Min at 1912Z preceded a rapid increase in vertically integrated ice, MESH, and reflectivity at the -10C isotherm. A 1″ hail report was then acquired at 1926Z in Ratliff City.
The following plot shows the flash extent density trace for the storm approaching Ratliff City, OK. Focus on the timeframe between roughly 1900Z and 1930Z. Notice the strong jump between 1908Z and 1909Z.
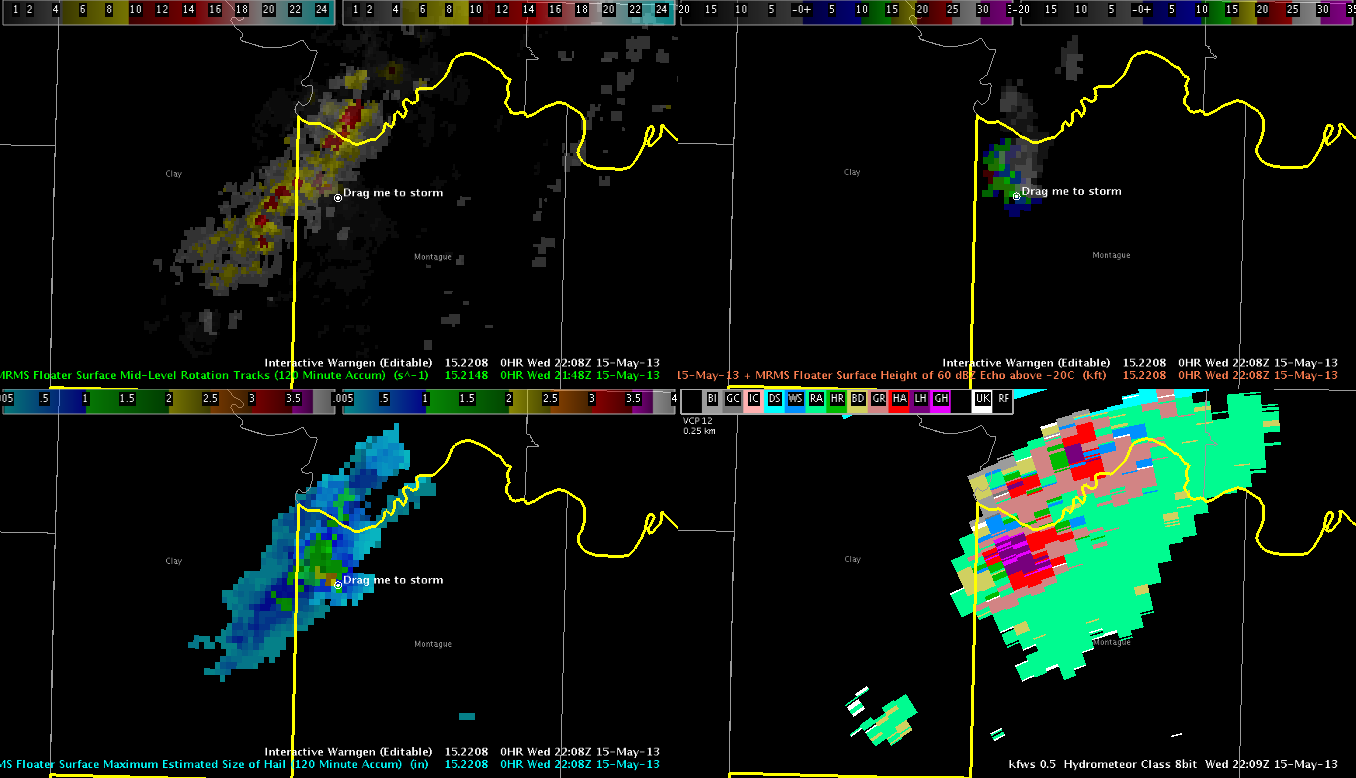
 MESH jumped from 0.63in (1910Z) to 1.10in (1912Z) to 1.26in (1914Z) with the last detection of 1.02in (1924Z) before dropping off thereafter. The following images show the jump from 1910Z to 1912Z.


Looking at the vertically integrated ice product…there was an increase in values from 14 kg/m2 (1908Z) to 20 kg/m2 (1910Z) to 32 kg/m2 (1912Z) with consistently high values above 30 kg/m2 through 1924Z. See the images below as the storm approached Ratliff City.


Regarding reflectivity at the -10C isotherm…there was an increase to 59dBZ by 1912Z then 61dBZ at 1914Z (not shown).
Again, the 1″ hail report was acquired in Ratliff City at 1926Z which gives the lightning flash extent density tool a 17min lead time to the 1″ hail report.
RJM


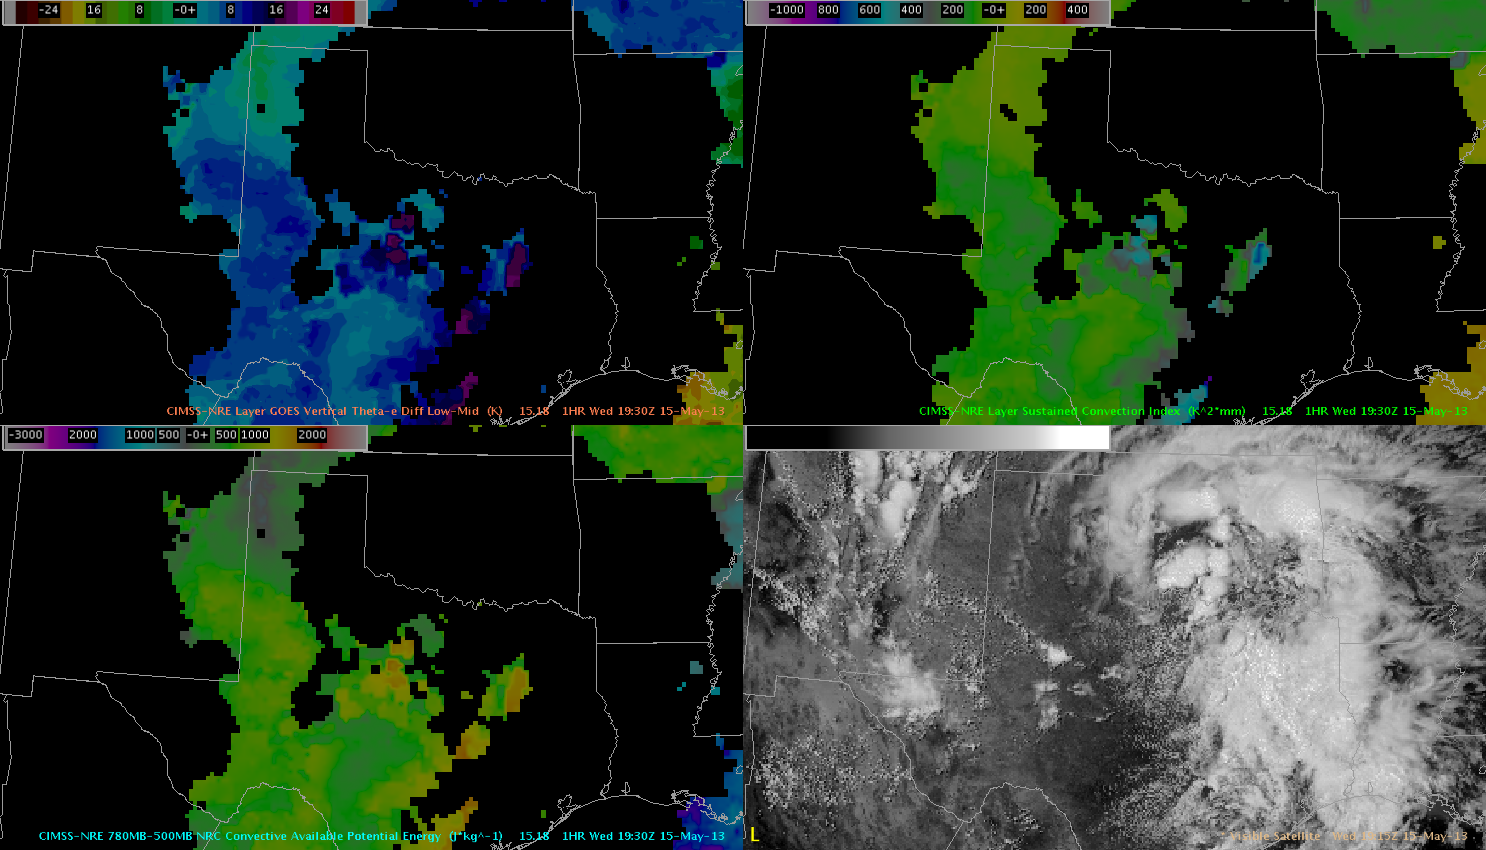
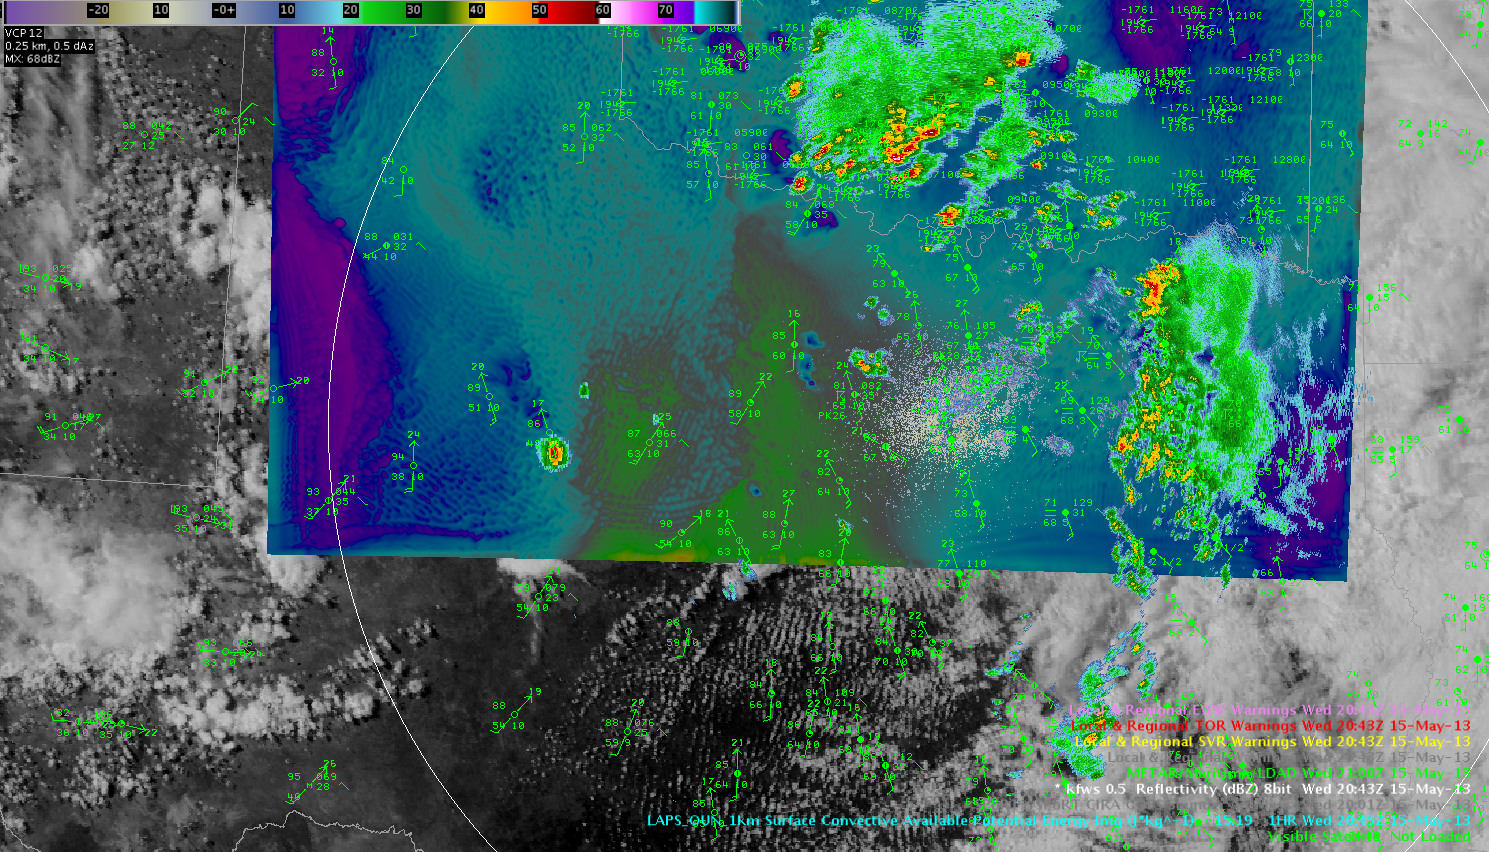
 The top image is CIRA/NSSL WRF Simulated IR while the bottom image is observed IR around 22 UTC. The simulated IR underestimated cloud cover over Oklahoma where a mid/upper low was centered. The convection over the Rockies in Colorado and New Mexico as well as cooler cloud tops over eastern Texas and Louisiana were handled well by the simulated IR. The convection near Lubbock, Texas was captured very well.
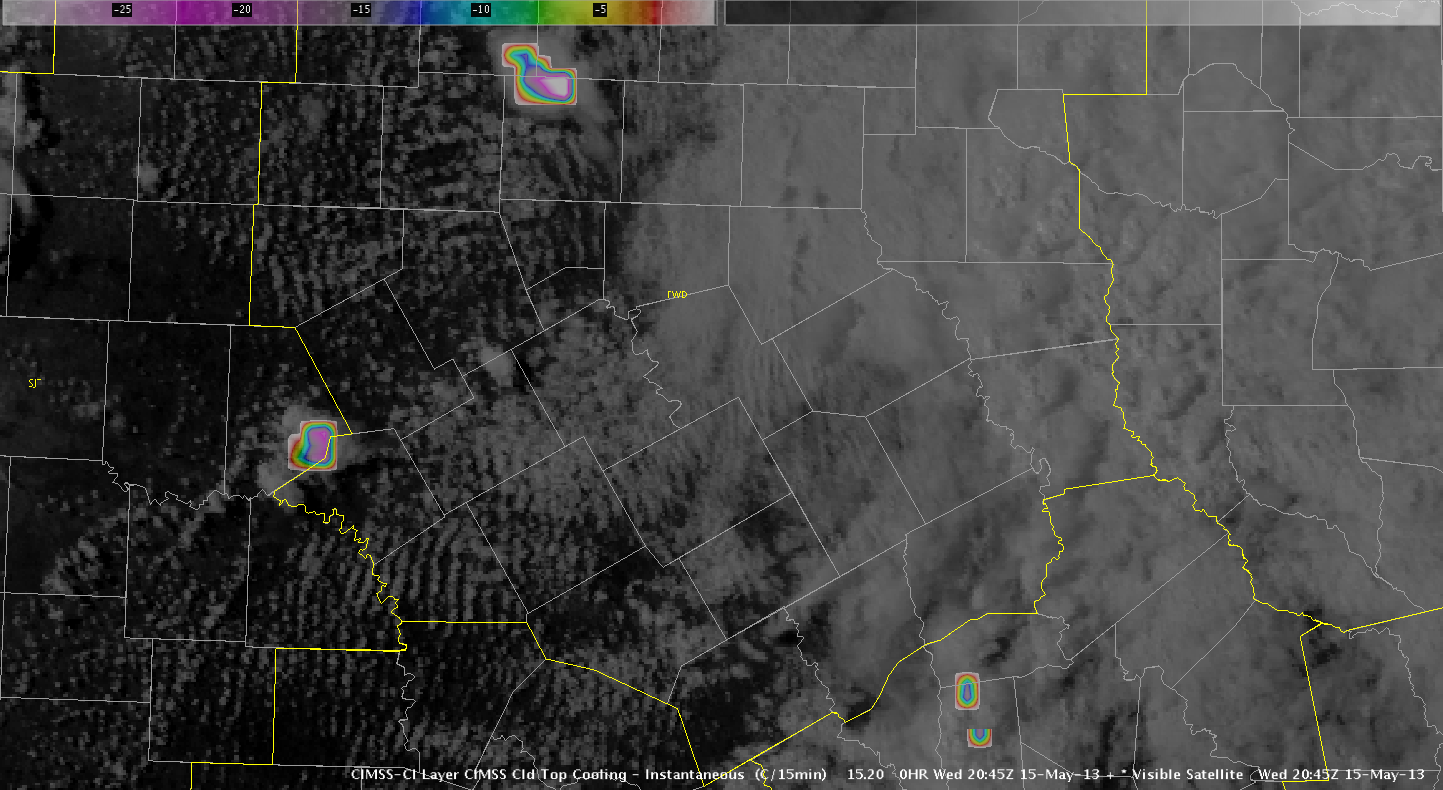


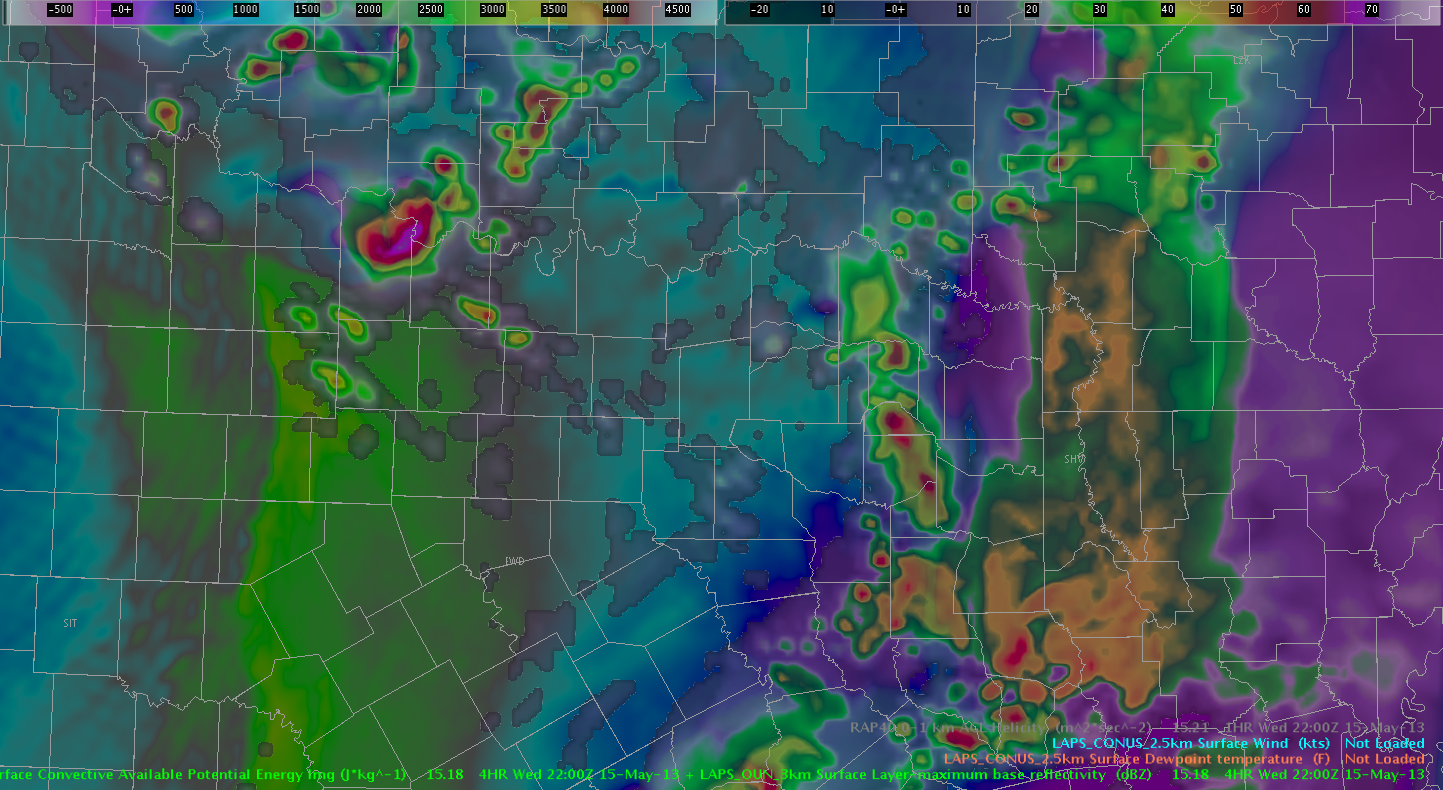
 The images at 19 and 20 UTC respectively depicted an area of drier air, most likely associated with a short wave on the back side of a mid/upper low over southwest Oklahoma. This wave seems to be enhancing cloud top cooling and convection generation over west Texas, near Lubbock. We will keep a close eye on this feature to see if this wave will allow for explosive convection 22-01UTC near a dryline from near Childress to San Angelo with very unstable (2000-3000 J/kg) air near and east of the dryline. Michael Scotten