An official website of the United States government
Here’s how you know
Official websites use .gov A
.gov website belongs to an official government
organization in the United States.
Secure .gov websites use HTTPS A
lock (
) or https:// means you’ve safely connected to
the .gov website. Share sensitive information only on official,
secure websites.
Based on the SRM radar data combined with a few MRMS products, Eric decided to issue a tor warning for the strengthening cell in Cayuga County at approx 1959 UTC. Whether or not this storm has produced or will produce a tornado remains to be seen. Nevertheless, here are some of the imagery which helped with the warning decision process…
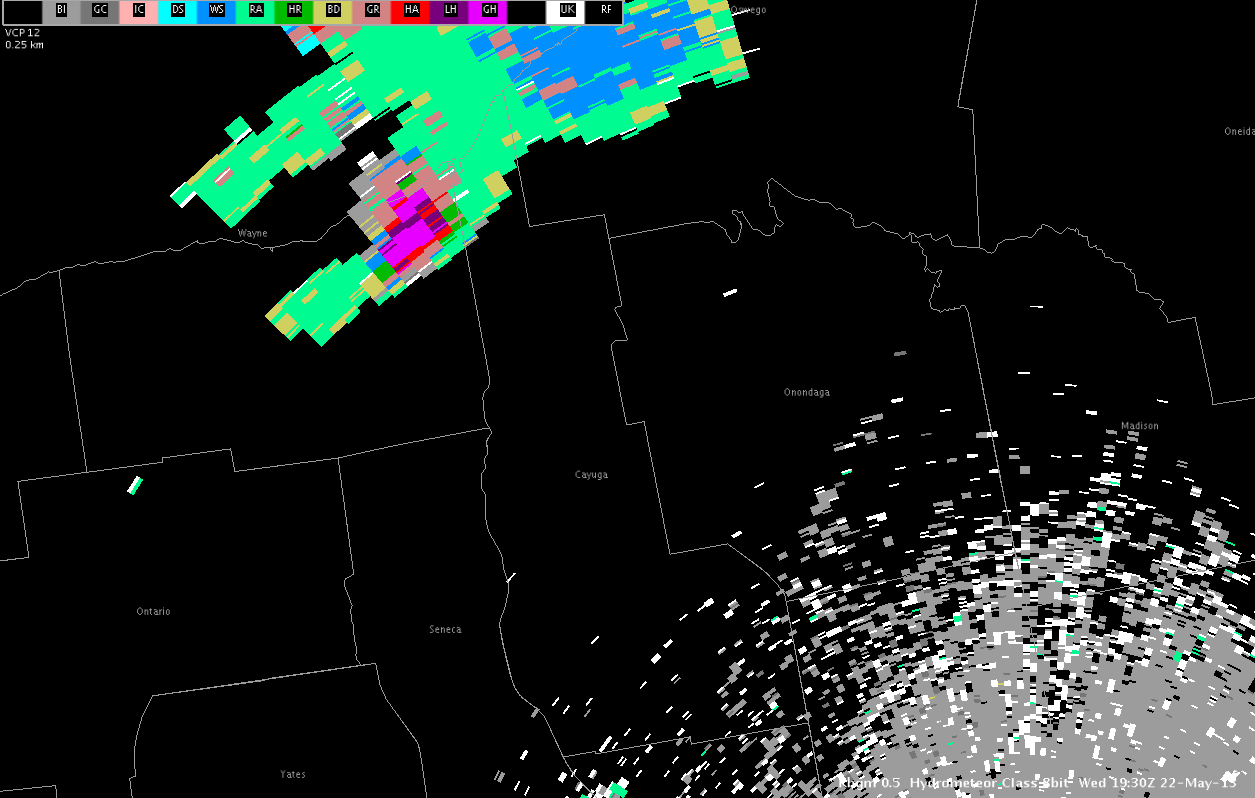
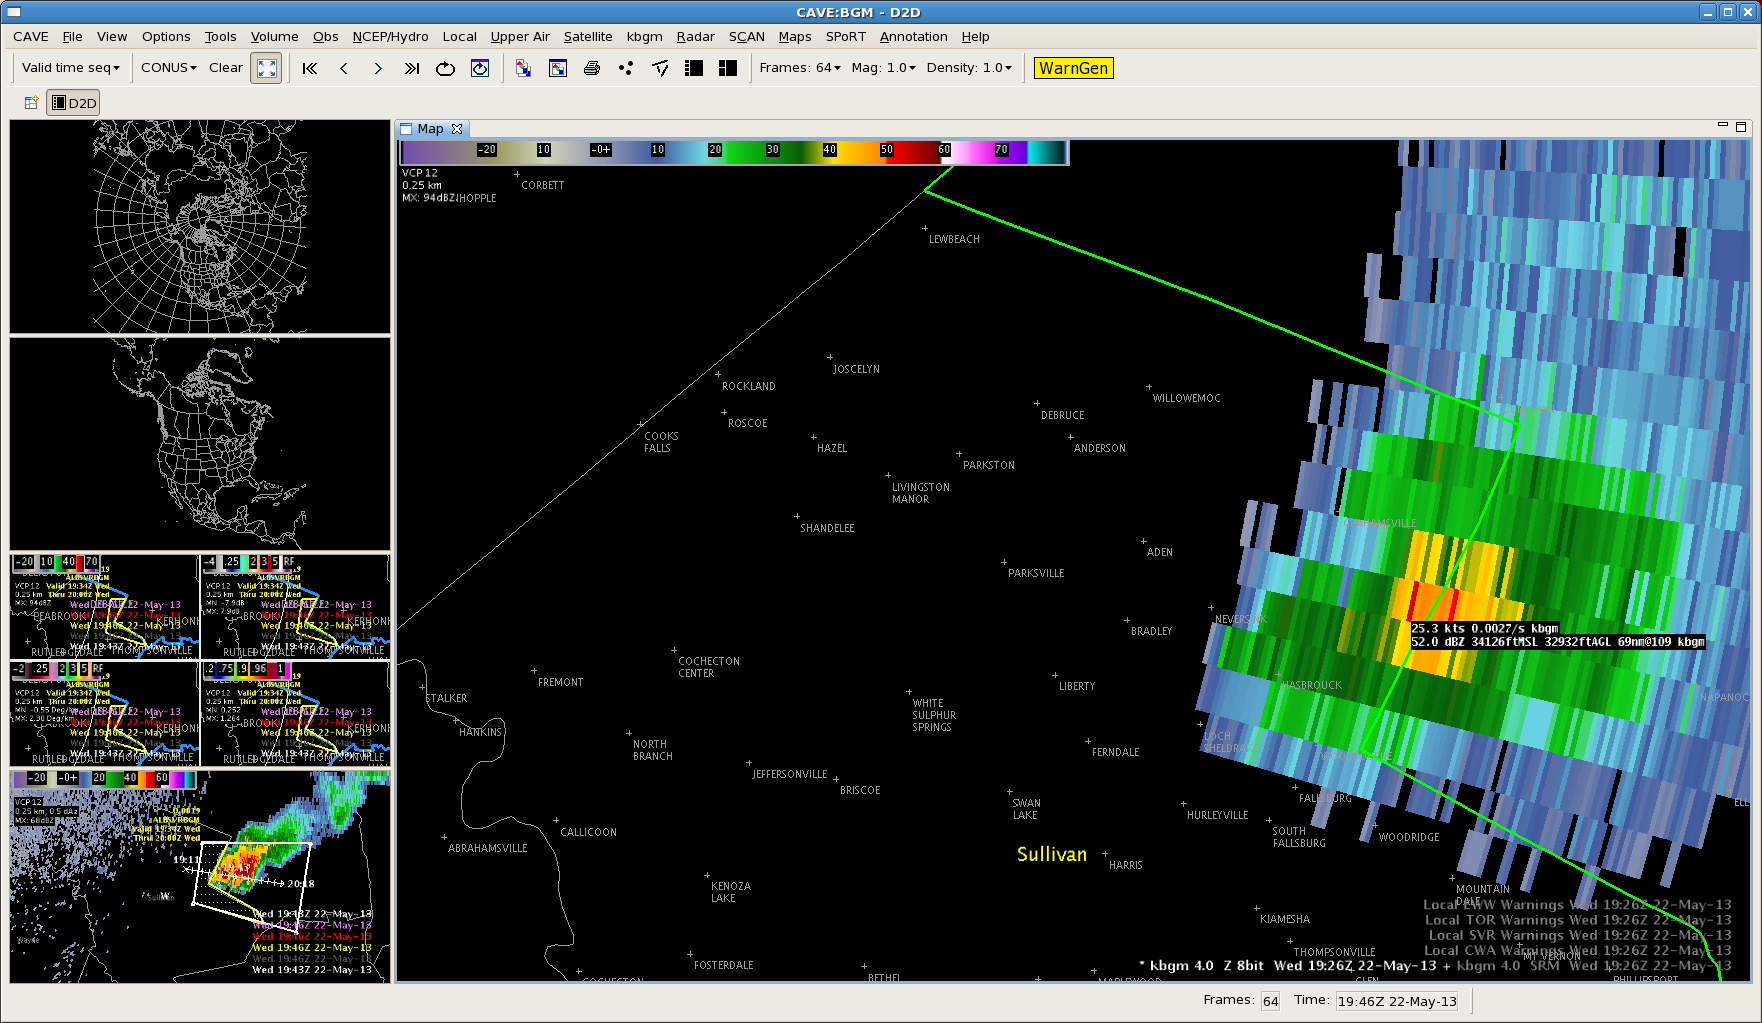
Figure 1. KTYX SRM imagery valid at 2000 UTC indicating the broad rotation in this cell aloft.
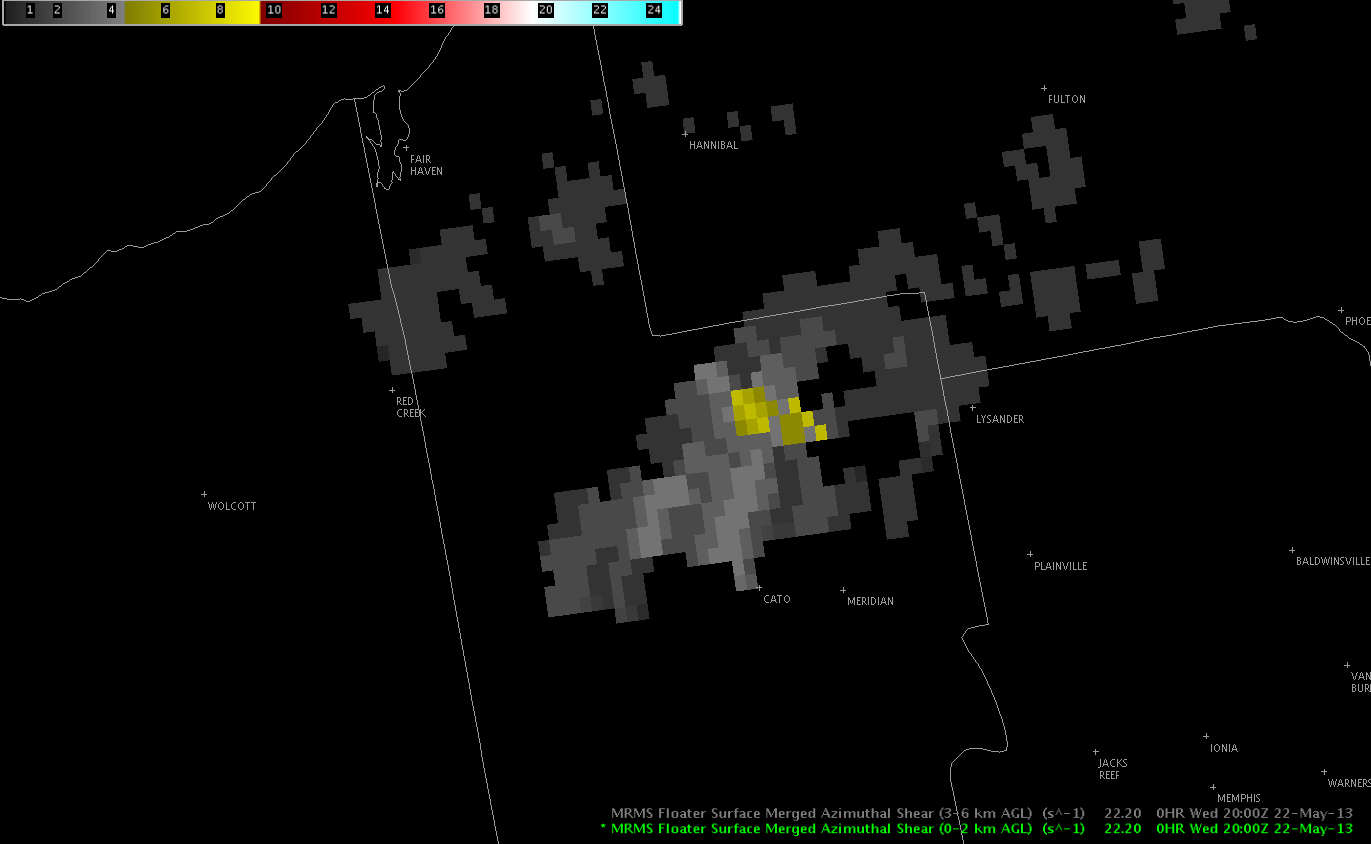
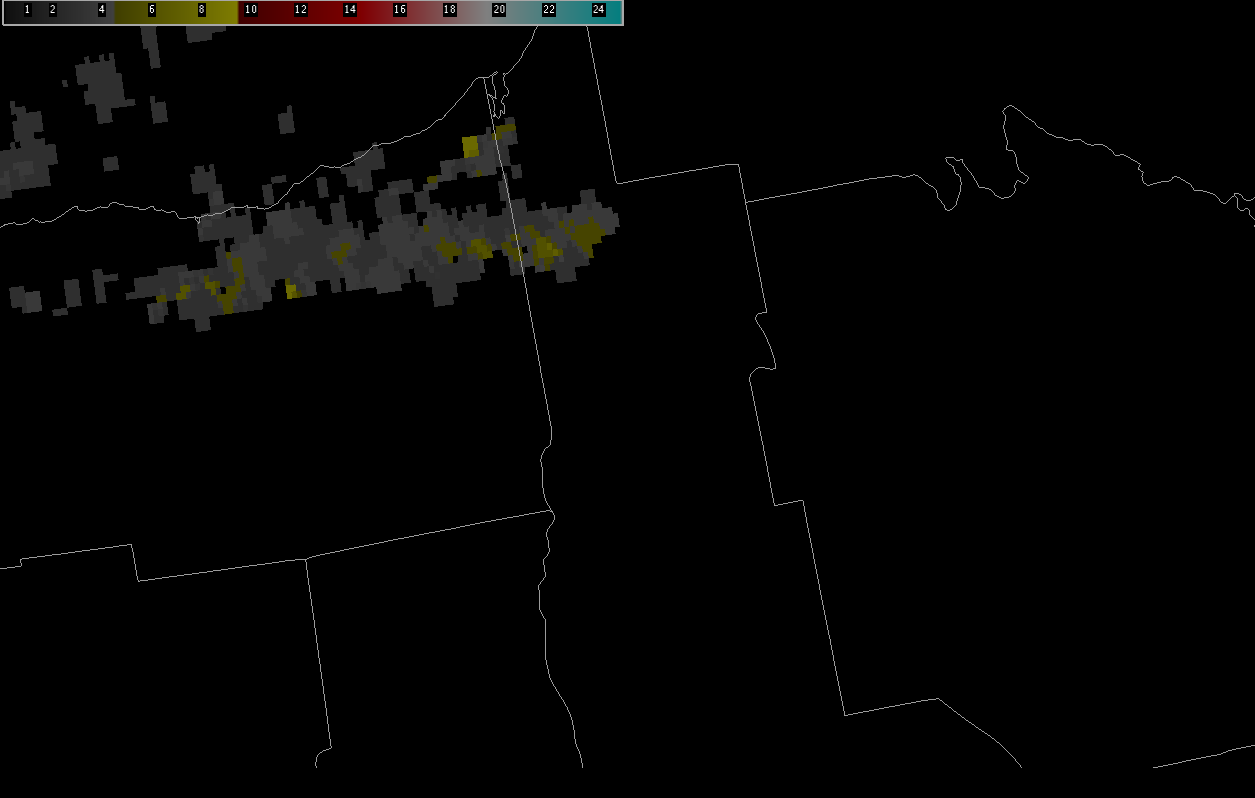
The next image is the MRMS 0-2 km azimuthal shear product valid at approx 2000 UTC. Notice the higher values in NE portions of Cayuga County coincident with the broad rotation noted on the KYTX radar.
Image 2. MRMS 0-2 km azimuthal shear valid 2000 UTC.
Lastly, here is the MRMS low level 30 minute rotation tracks data valid at 1957 UTC.
Image 3. MRMS 30 minute rotation tracks valid at 1957 UTC.
Granted, there is still some product familiarity and pattern recognition needed with these newer types of data.
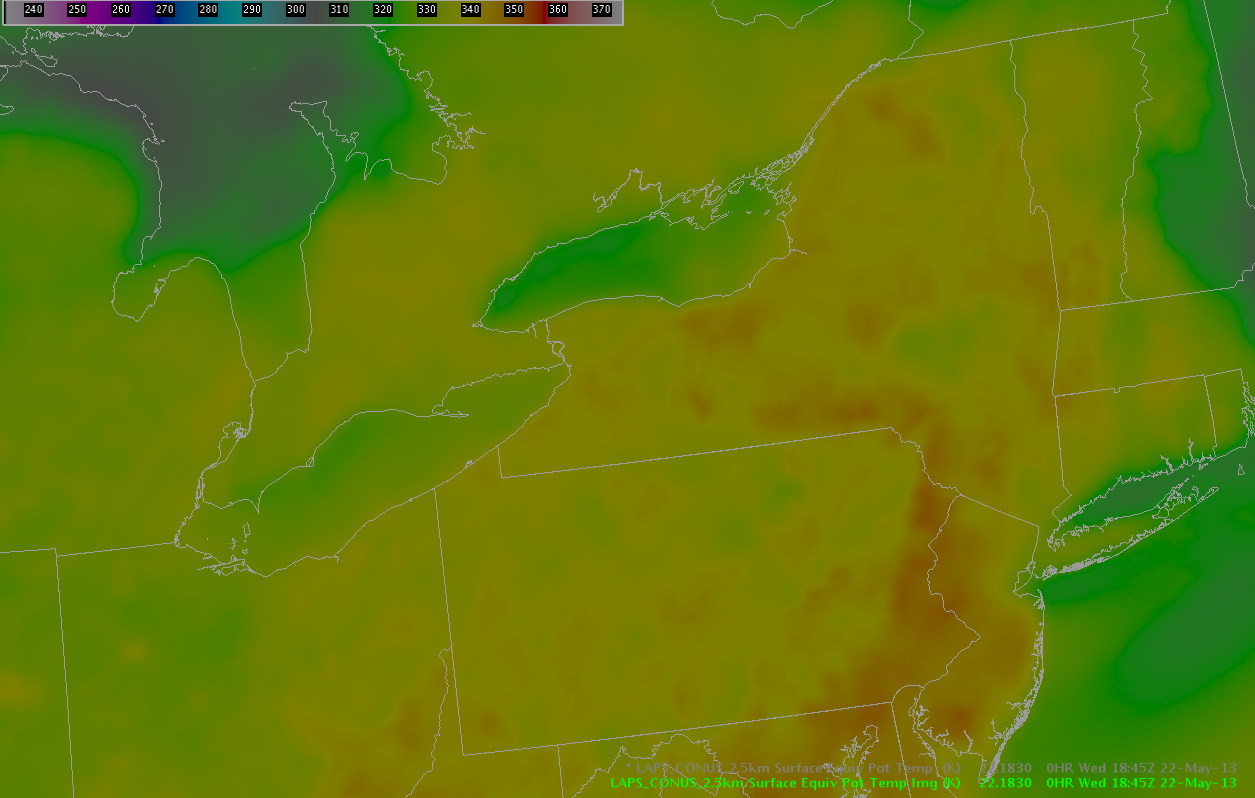
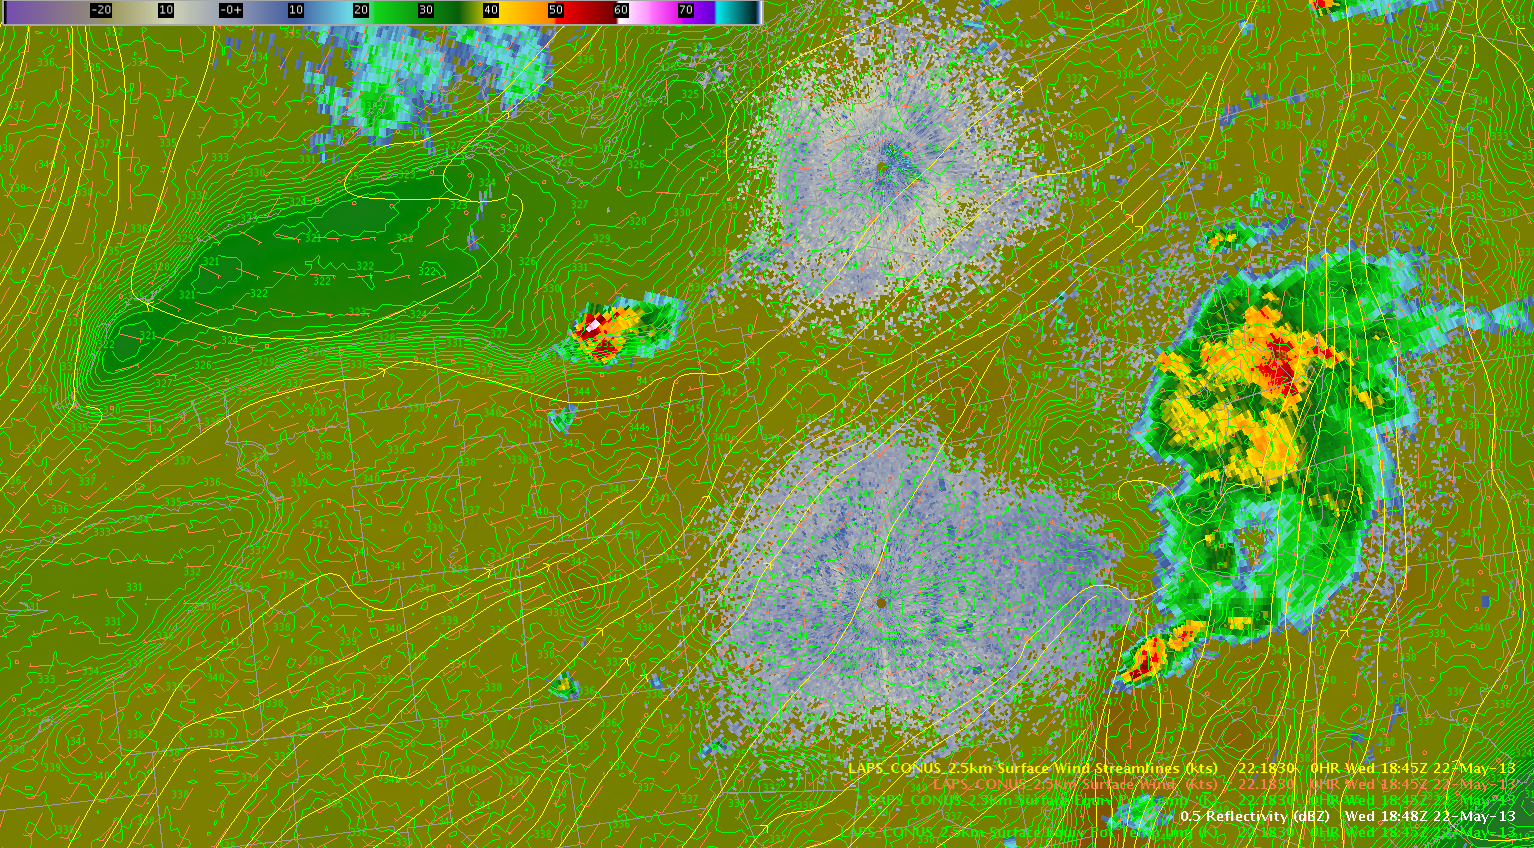
At the current time, one convective complex pushes to the east into New England from New York, with a stronger storm noted moving into Ulster County NY. Behind this complex, a stable layer is noted with lower Theta-E values shown on LAPS imagery.
An isolated storm is also noted in northern Wayne County NY. This second storm continues to exhibit severe potential with an HSDA signature of large hail and MESH values exceeding 2 inches.
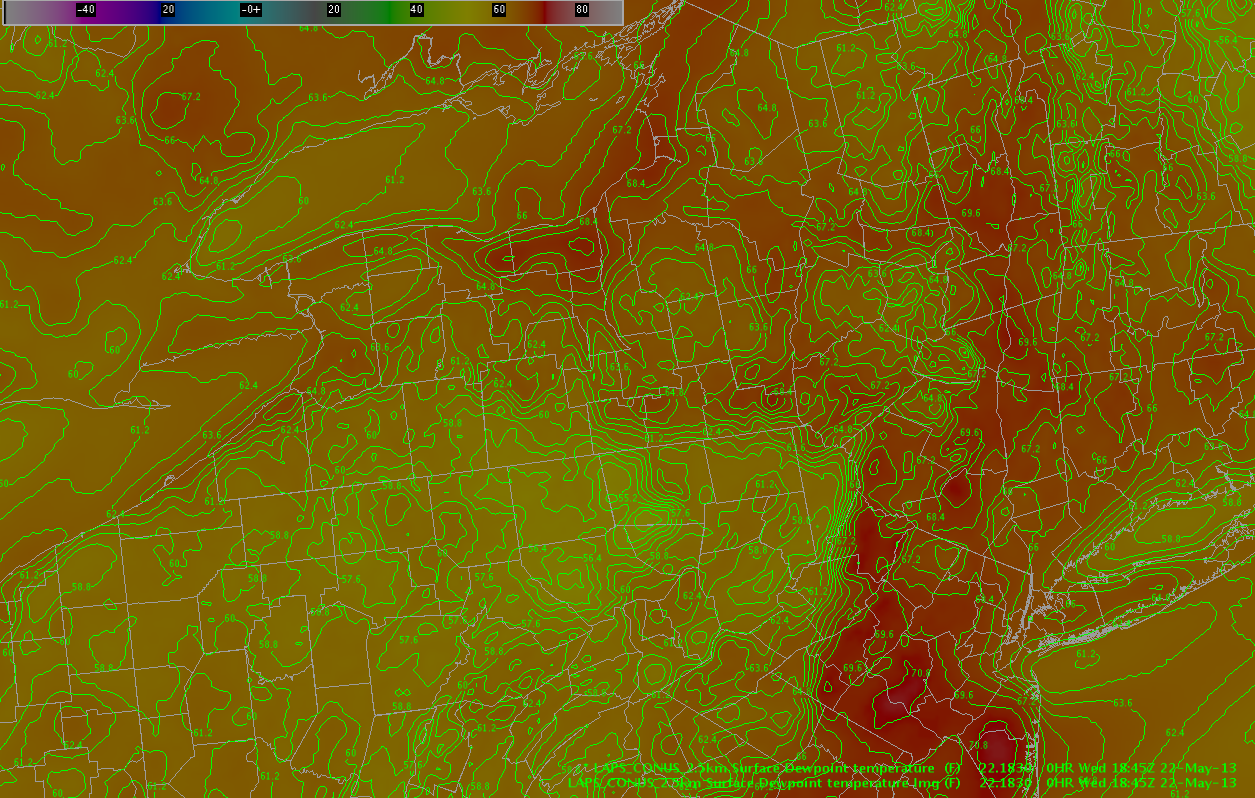
This storm is located along a convergence boundary well noted in LAPS forecast fields, with dew points in the mid to upper 60s noted south of the lakefront.
This supercell storm is expected to continue to pose a threat of severe hail and perhaps a tornado or two as it moves to the east in an environment characterized by rich moisture and unseasonably warm temperatures that have reached the low 80s, even in the presence of modest 6 km shear of 30 kts. The environment to the south is moderately unstable, characterized by RAP indicated instability values of SBCAPE approaching 2000 J/KG. In addition, a gradual increase in mid level rotation has been noted in recent scans, with storm splitting noted and both storms showing mid level rotation.
Farther to the south, in areas of weaker deep layer shear, convection is expected to increase in coverage through the afternoon hours along two particular moisture gradients noted on the LAPS dew point fields. The first boundary is located from north to south from Wayne County NY to Bradford County PA. The second boundary is located from west to east southeast from Erie County NY to Bradford County PA. Cu clouds are increasing in coverage across western NY with a few echoes beginning to appear. One of these echoes is located in Erie County NY, another two are located in Chemung and Tioga Counties. The main threat through the evening hours should be large hail… with some gusty winds in stronger storms.
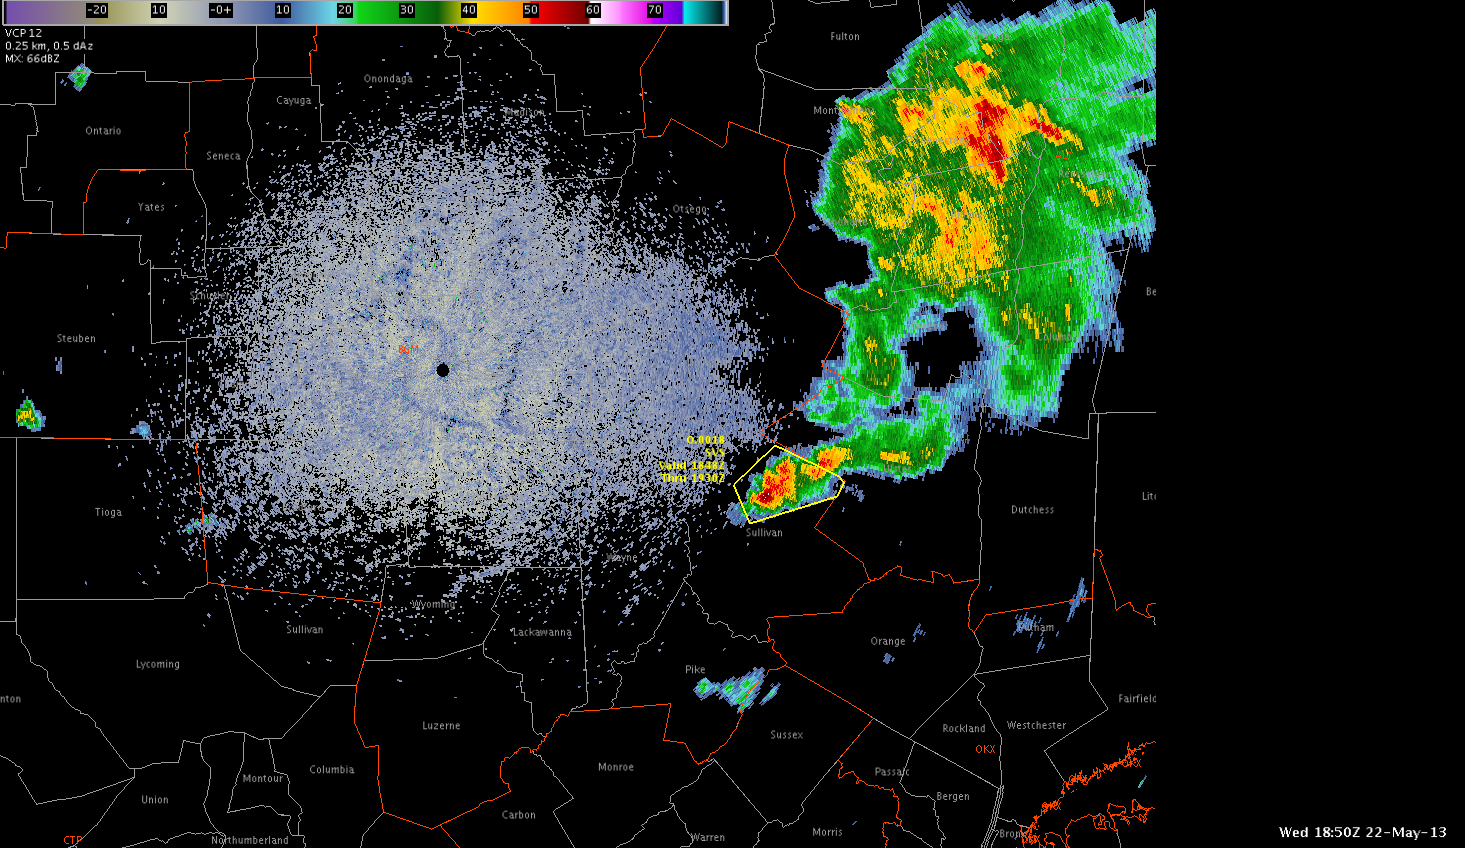
Use of the Donovan method would result in the issuance of a severe thunderstorm warning on this cell in eastern Sullivan County when the 50dbz core reached 28,000 AGL. This cell actually had a small by high 50dbz core of over 30,000 ft. The MESH also spiked up to indicate 1.4 inch hail. The HSDA indicated hail but not large hail. This storm had a history of severe hail. No actual verification since the spike was over open county and not over any towns. But the trend we saw yesterday of HSDA indicating lesser chances of svr hail continues today thus far.
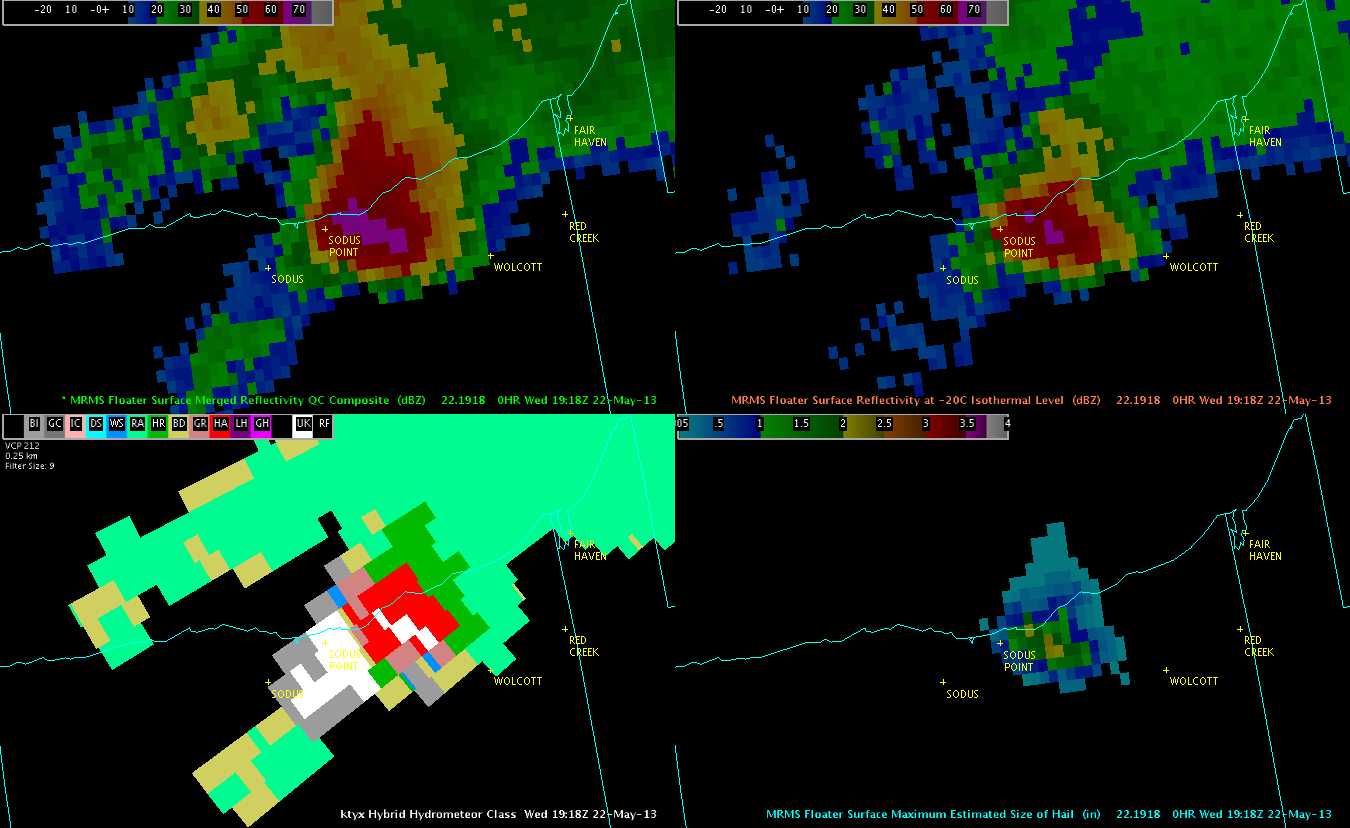
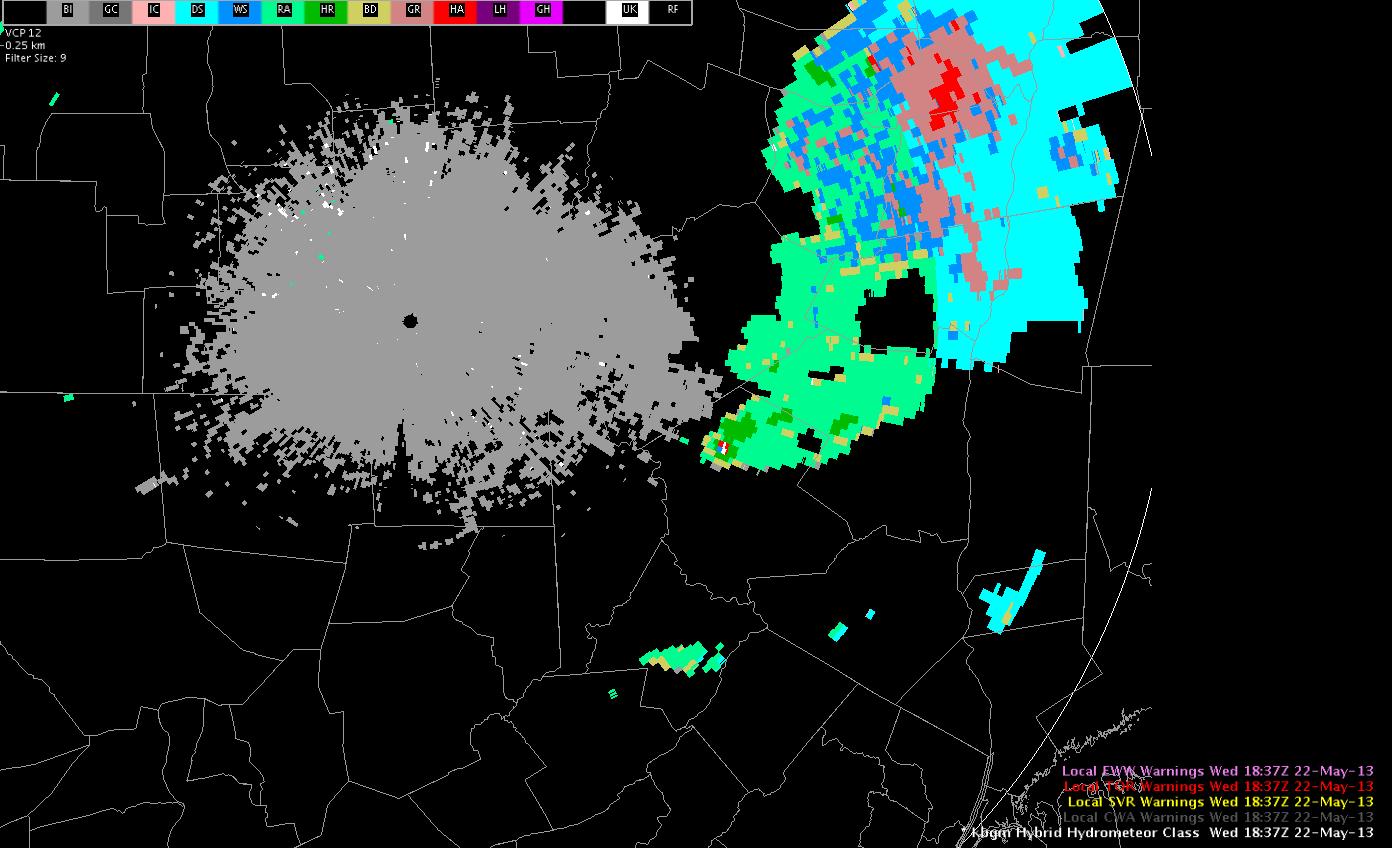
Okay, today we’re in the same region we left last night…back in NY baby! Well, it’s upstate NY, but the baby still applies. =) Anyway, here we are nearing 330 pm EDT, and MRMS data are already suggesting severe hail in a storm moving just south of Lake Ontario in Wayne County. Notice the MESH in the four panel in the image below (lower right). This cell showed very quick development with >1 inch hail beginning at 1914 UTC as shown below. At the same time, reflectivity values of 59 dBZ were colocated with the cell. However, the HSDA data only indicated hail and rain (red colors, lower left).
Figure 1. MRMS imagery valid at 1914 UTC and KYTX imagery valid at 1913 UTC. Upper left – MRMS merged reflectivity QC composite (dBZ), upper right – MRMS surface reflectivity at -20C (dBZ), lower right – MRMS surface MESH (in), lower left – KTYX Hybrid Hydrometeor class
MESH Values over 2 inches then appeared at the 1918 UTC MRMS product update. Notice that 65 dBZ values were indicated by the MRMS -20C reflectivity product. However, the KTYX HSDA product still just indicated a sub-severe hail/rain combination.
Figure 2. MRMS imagery valid at 1918 UTC and KYTX imagery valid at 1913 UTC. Upper left – MRMS merged reflectivity QC composite (dBZ), upper right – MRMS surface reflectivity at -20C (dBZ), lower right – MRMS surface MESH (in), lower left – KTYX Hybrid Hydrometeor class
Based on these data above, we issued a Severe Thunderstorm Warning for hail at approx 1930 UTC, although we may have been a little late getting out due to still setting up and “getting oriented”. Although it’s not shown here, the KBUF HSDA data also did not indicate large or giant hail. The MRMS data appears to be performing fairly well so far, but we’ll watch for these trends into the afternoon.
So, what happened? Well, we just got a report of quarter size hail valid at 1918 UTC, 2 miles east of Lake Bluff in Wayne County. So far, it appears that the MESH may be overestimating the size of hail slightly, with the HSDA from the KTYX and KBUF radars are underestimating a little. Nevertheless, we’ll continue to monitor for reports.
Kris and Eric
UPDATE!! We got a delayed report of golf ball size hail from Wayne County at 1936 UTC. Perusing back through the data, it looks as though the MESH product did quite well, indicating 1.73 inches at 1934 UTC and 1.65 inches at 1936 UTC. However, the HSDA still showed just rain and hail without the large and giant hail mention.
Mid day convection progressing over eastern NY has been producing severe hail reports. Issued first warning based upon current reports as well as MRMS guidance. Image 1 below shows the reflectivity and the warning polygon, indicating the higher dBz indicative of the possible hail. Image 2 shows the MRMS guidance, with MESH values between 1 and 1.5 inches. Reports being received from the public were within this range. Probability of severe hail values had pixels between 70 and 90%. HSDA was having a bit more difficulty capturing the severe hail and even any hail development, with only rain being noted.
Slight Risk for portions of the upper Ohio Valley and the northeast, with the highest probabilities of severe centered over Ohio. The upper level trough continues slowly eastward, and at least one notable wave is progged to swing around the base. Low to moderate instability is expected as a surface cold front moves through the area. Expect convection to develop by early afternoon, and peak in severe potential during the late afternoon and early evening hours, after which it should tail off in severity. Expecting marginally severe hail (up to 1.5″) and possible wind damage up to 65 mph.
Another warning earlier was successfully made in the south end of the FDW area. The MESH and reflectivity values at the -20C isotherm were used once again, in addition to other standard all-tilts base data. The first image below is the 8.7 degree slice of the all-tilts base data, which showed a relatively high reflectivity ~55 dBZ, which was at about 38 kft AGL at this location.
Image 1. KGRK 8.7 degree slice at approx 2333 UTC 21 May 2013.
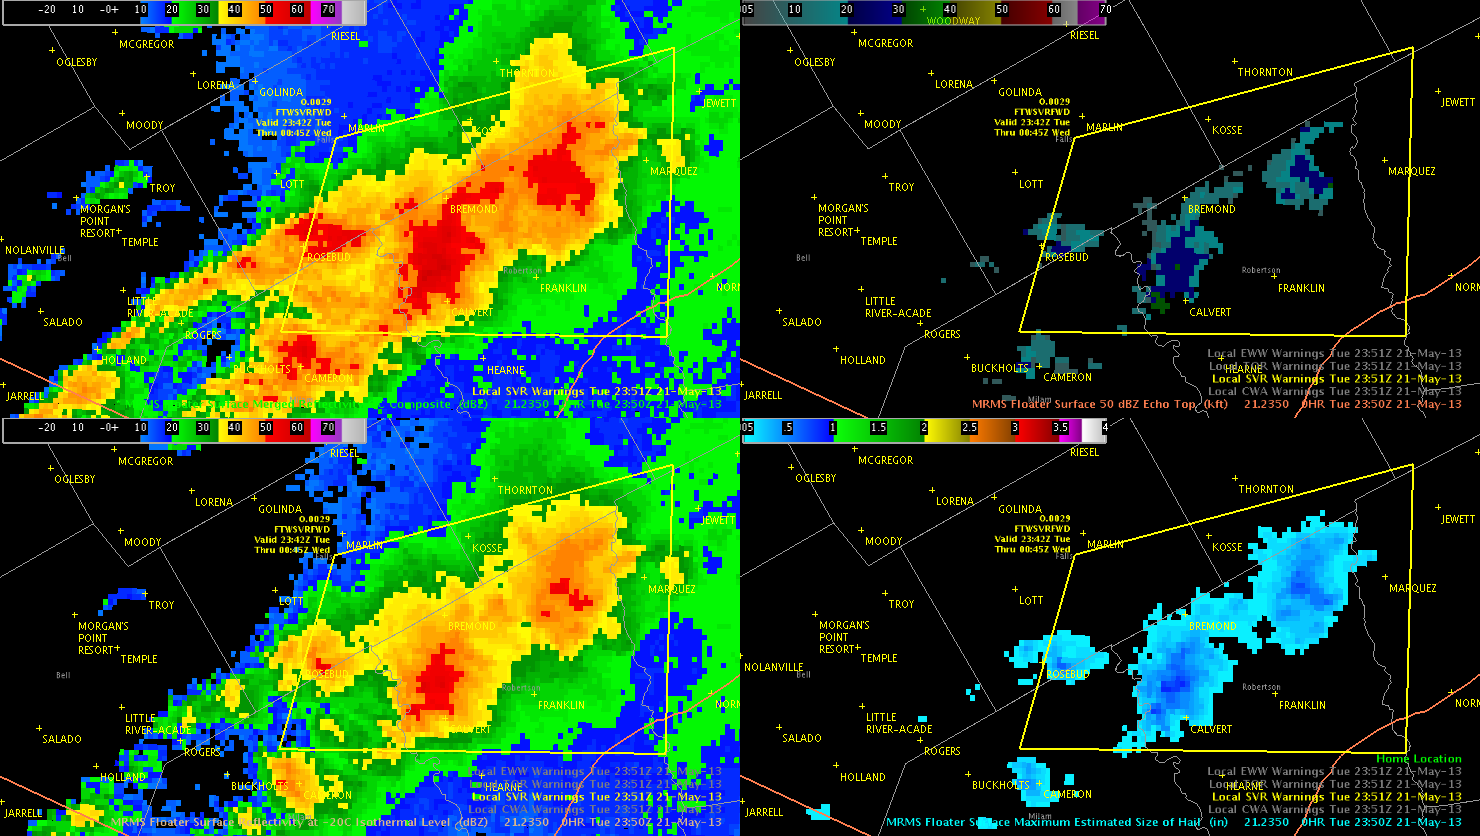
The next image shows a >1 inch MESH value north of the town of Calvert in Robertson County and corresponding high reflectivity values ~57 dBZ in the same location at 2338 UTC. Earlier reports indicated severe hail was common near these thresholds, so the decision to warn was made. In the first image, notice the MESH (lower right) and the high dBZ at -20C (lower left).
Image 2. 2338 UTC MRMS imagery: upper left – Merged reflectivity composite, upper right – 50 dBZ echo top, lower right – MESH, lower left – reflectivity at -20C Isothermal level.
In the next image, the eventual warning box can be seen. This warning was issued shortly after observing the earlier data. Notice that the box was drawn trying to incorporate the areas with reflectivity at the -20C level greater than 55 dBZ. However, notice that the MESH values had decreased a little by the time this image was taken at 2351 UTC.
Image 3. 2351 UTC MRMS imagery: upper left – Merged reflectivity composite, upper right – 50 dBZ echo top, lower right – MESH, lower left – reflectivity at -20C Isothermal level.
This storm did eventually produce severe hail with the a report of 1.75 inch hail in the southeast corner of the warning box at 0041 UTC.
Another example of verification comparing the MESH vs HSDA. There was a report of 1 inch hail in Berkshire County around 0050z. The MESH included 1 inch hail but the HSDA did not indicate large hail, but at least indicated hail.
Just a note that MESH was indicating 1 inch hail consistently for a storm despite the HSDA indicating < 1 inch hail. Verification was severe hail for the one storm in Hamilton County. This storm actually produced ping pong ball sized hail.
Traditional radar analysis indicates little potential for severe hail in the NW portion of BGMs area. This is supported by MRMS data as there is a lack of depth in the 50 dBZ core above the 0C isotherm, and MESH shows sub-severe hail.