Meteogram Tracking Want

tracking_tool

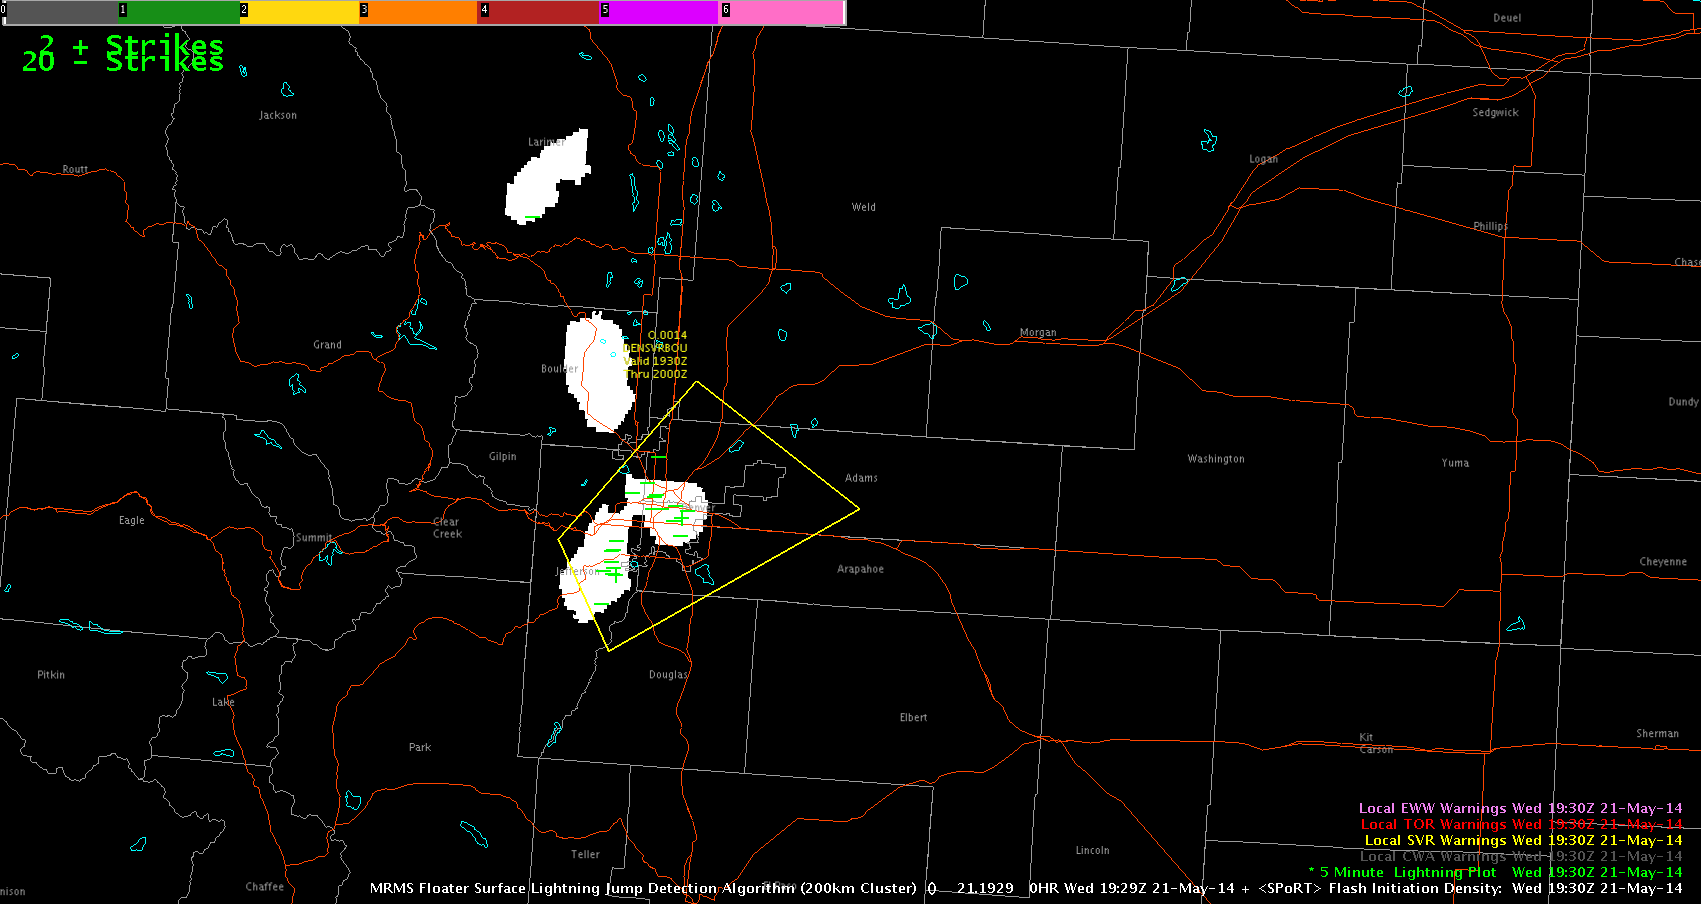
I was using the Tracking Tool Meteogram and it was very useful to track the changes in the lightning density and jumps, but when i closed out of the tool by clicking on the X it didn’t take away the rings. It would be nice if you excited out of the tool it also removed the Tracking Meteogram circles from the panel as well.

-JB

Tags: None

How’s the overshooting top detecting doing?

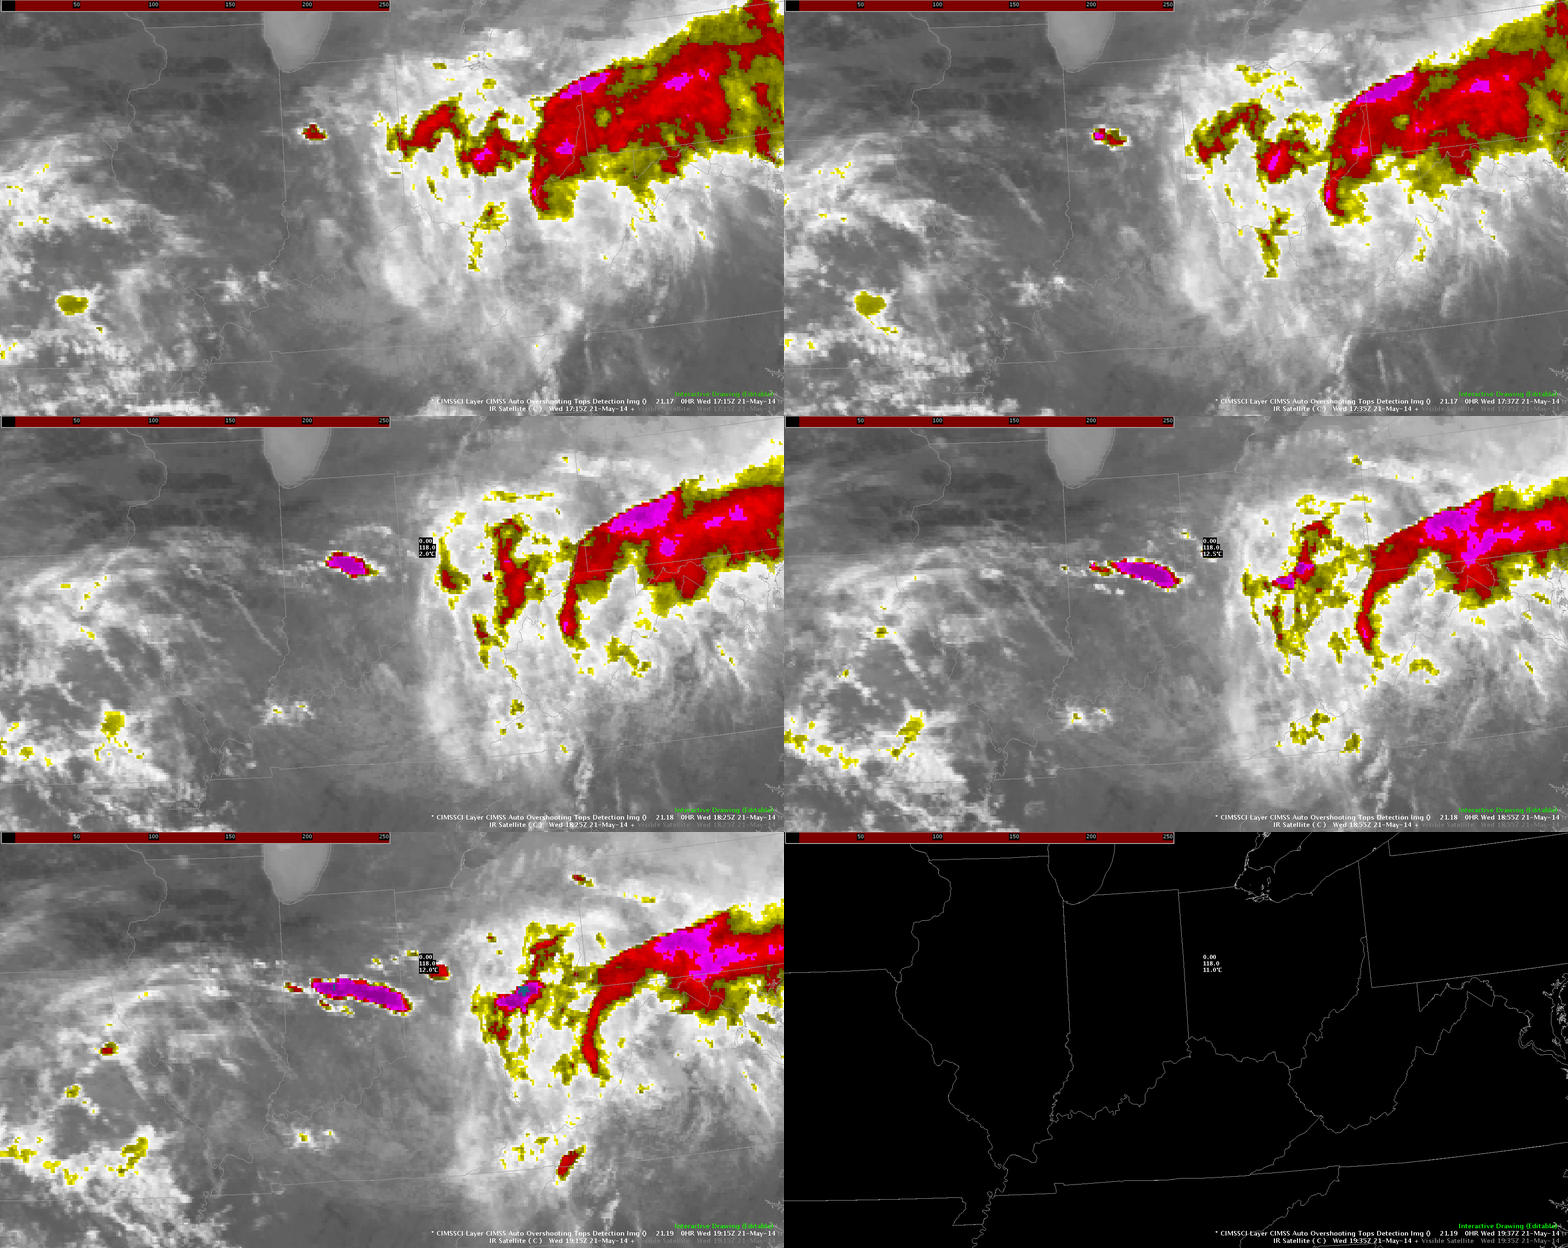
So far, no detections have been identified. Storms are still developing across central Indiana so I’ll continue to monitor this to see if something gets detected this afternoon. Here’s a loop of the OTD product overlaid on IR (there’s nothing detected in this loop).

1715Z-1930Z_IR&OT~Linda

Tags: None


NearCast


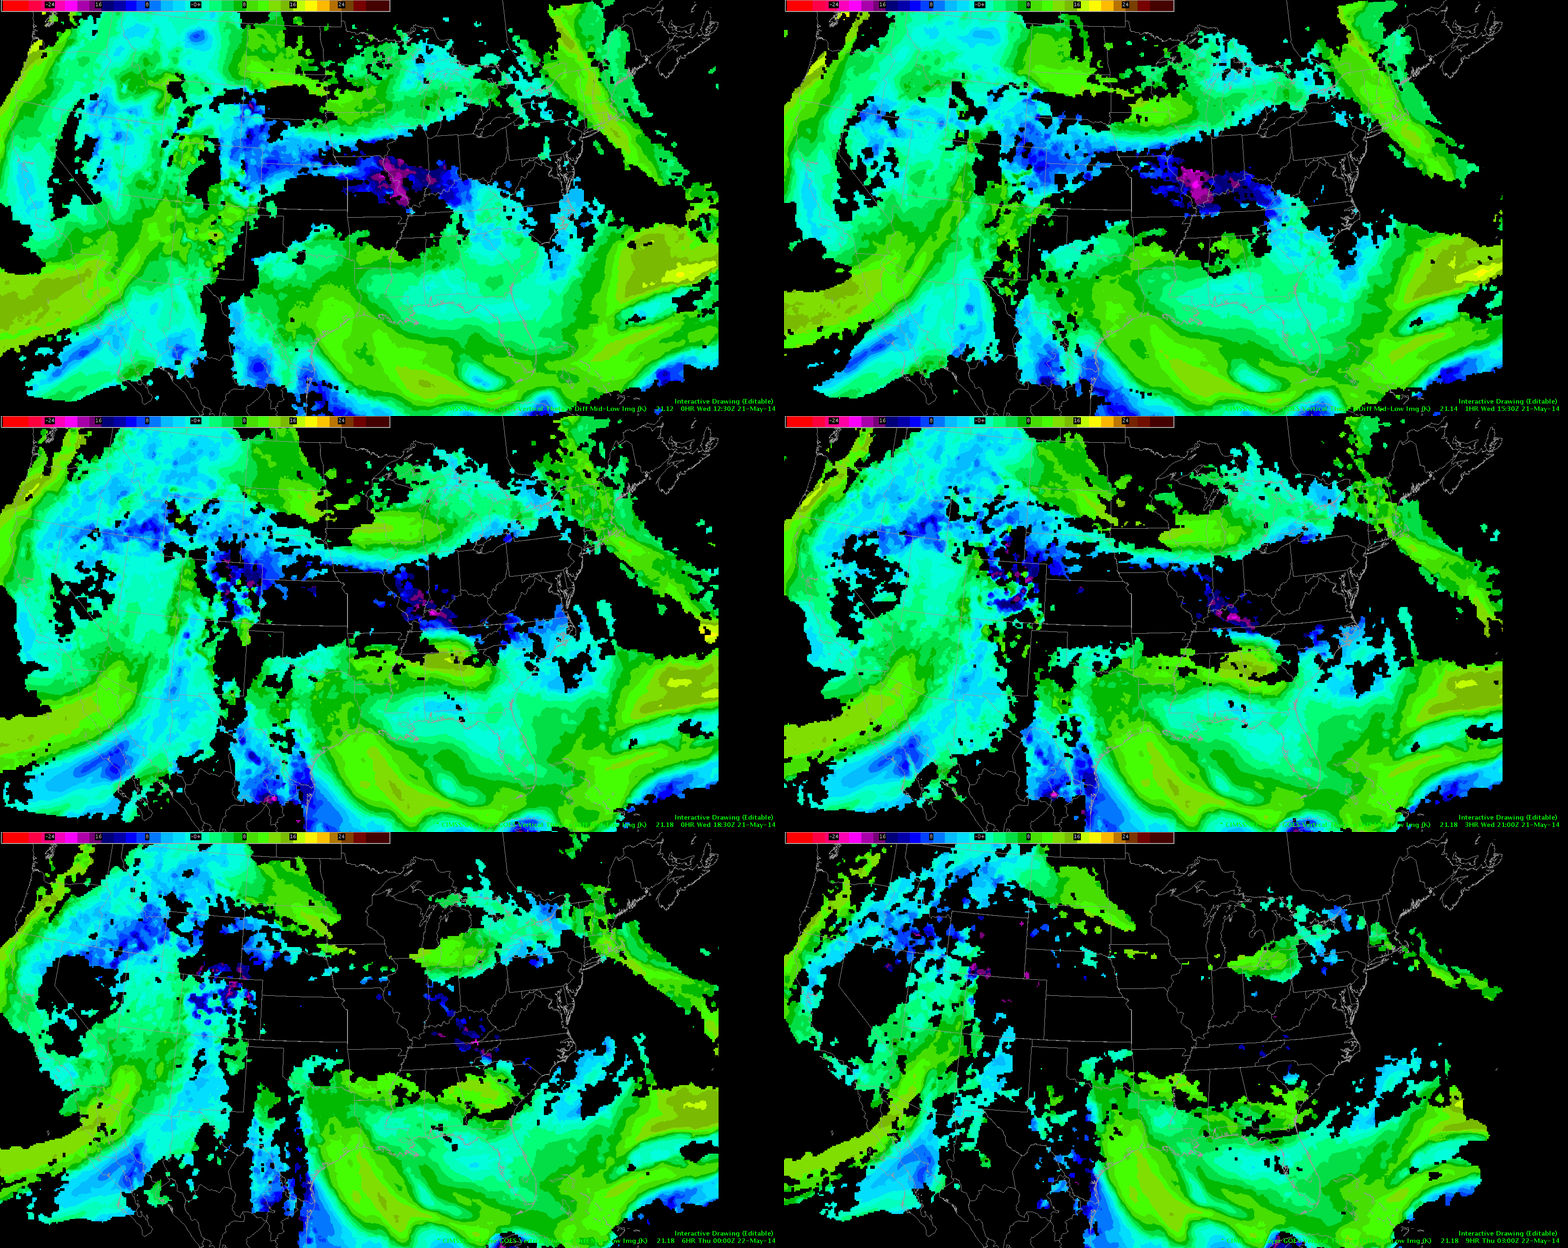
I was looking at the NearCast Theta E Diff Mid-Low and unfortunately there was a lot of black on this map in the area where I am looking for the potential for convection.  I was able to go back in time and see more data and based on the movement I would say that the area on instability is moving in the same area of the convection so the environment is good to sustain the storms that have formed in Indiana.  However, I wish we could have more data instead of the blank areas because I never like to assume things.  One thing we discussed is using model data that is contoured to fill in the blanks and I do like that idea.  ~Vollmar


3..2..1..INITIATION – EWP Operations Update – Wednesday 5/21 – 2:10pm

We were greeted post-EFP briefing with an explosion of development across across the Ohio Valley and out west in Colorado. Forecasters were quickly allocated to work out of the Indianapolis, IN (IND) to diagnose the rapidly developing cumulus field from Montgomery Country westward.

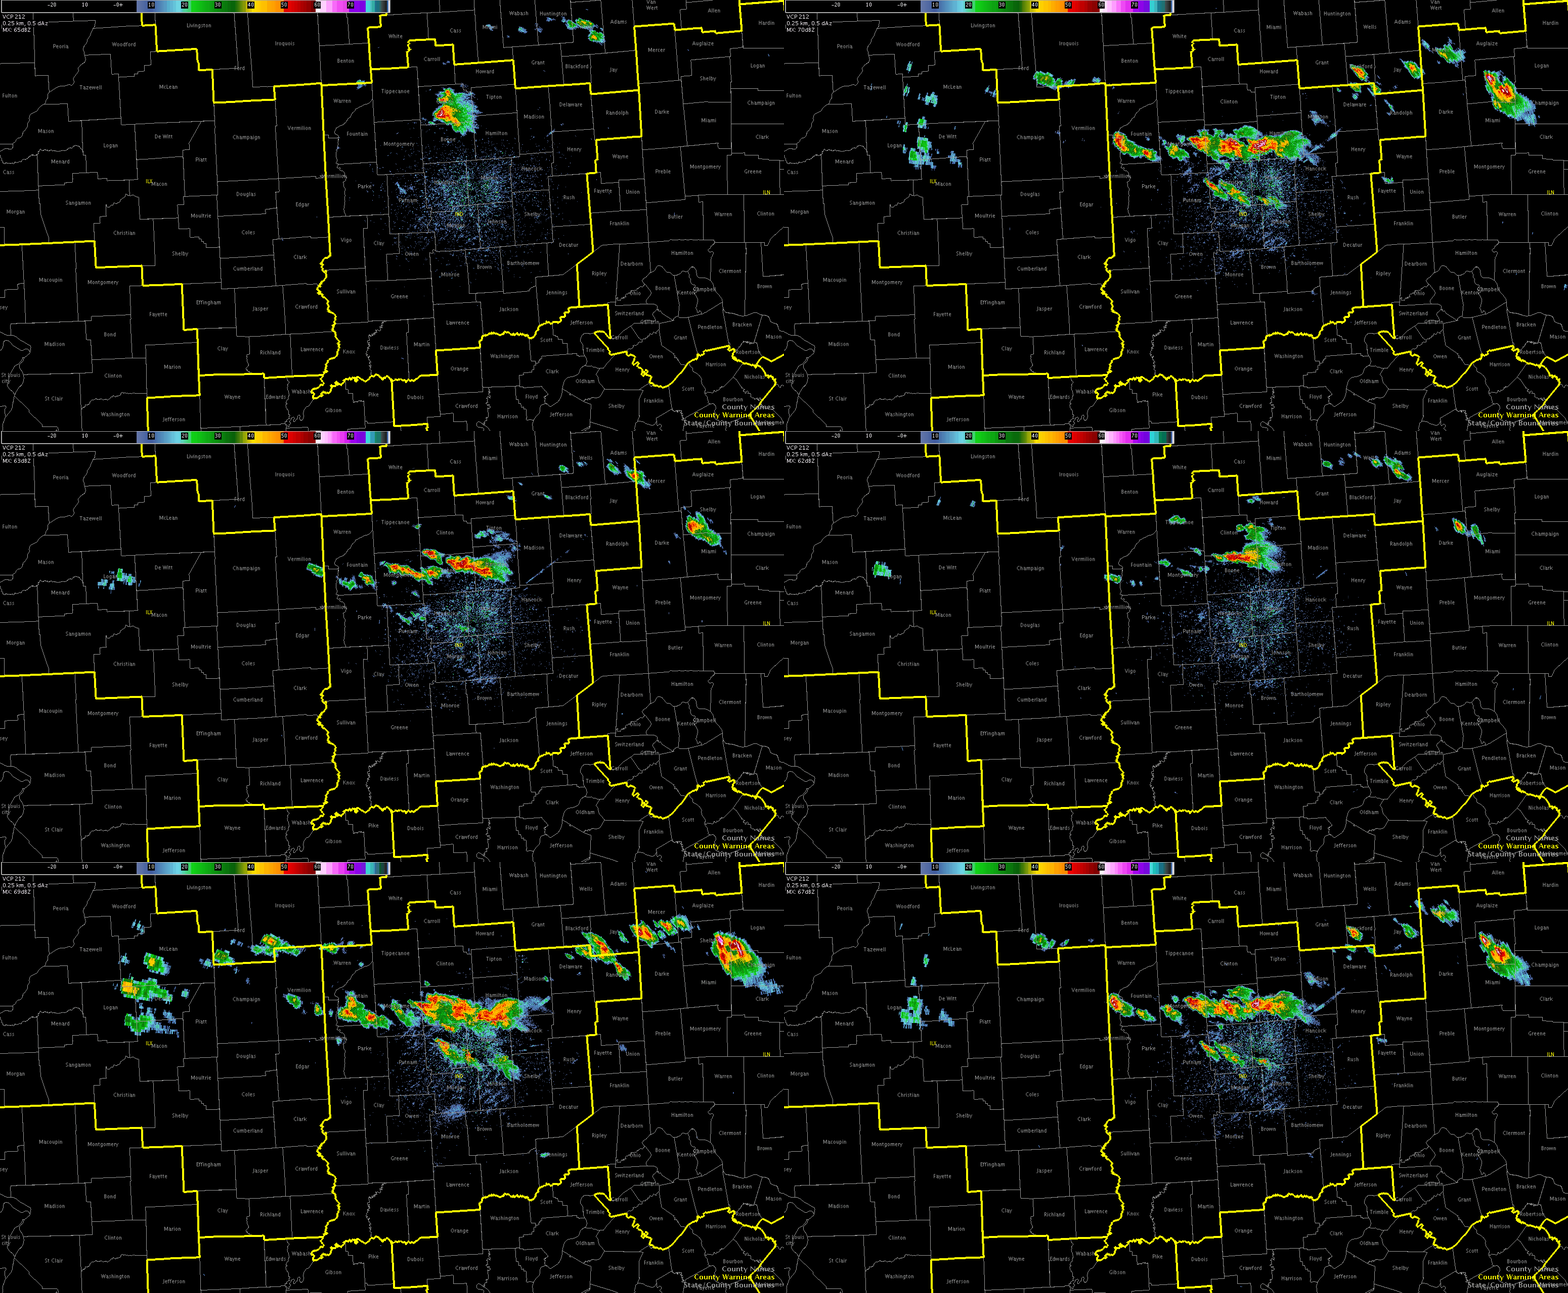
0.5 deg reflectivity from KIND from 1813z - 1929z on May 21, 2014
0.5 deg reflectivity from KIND from 1813z – 1929z on May 21, 2014

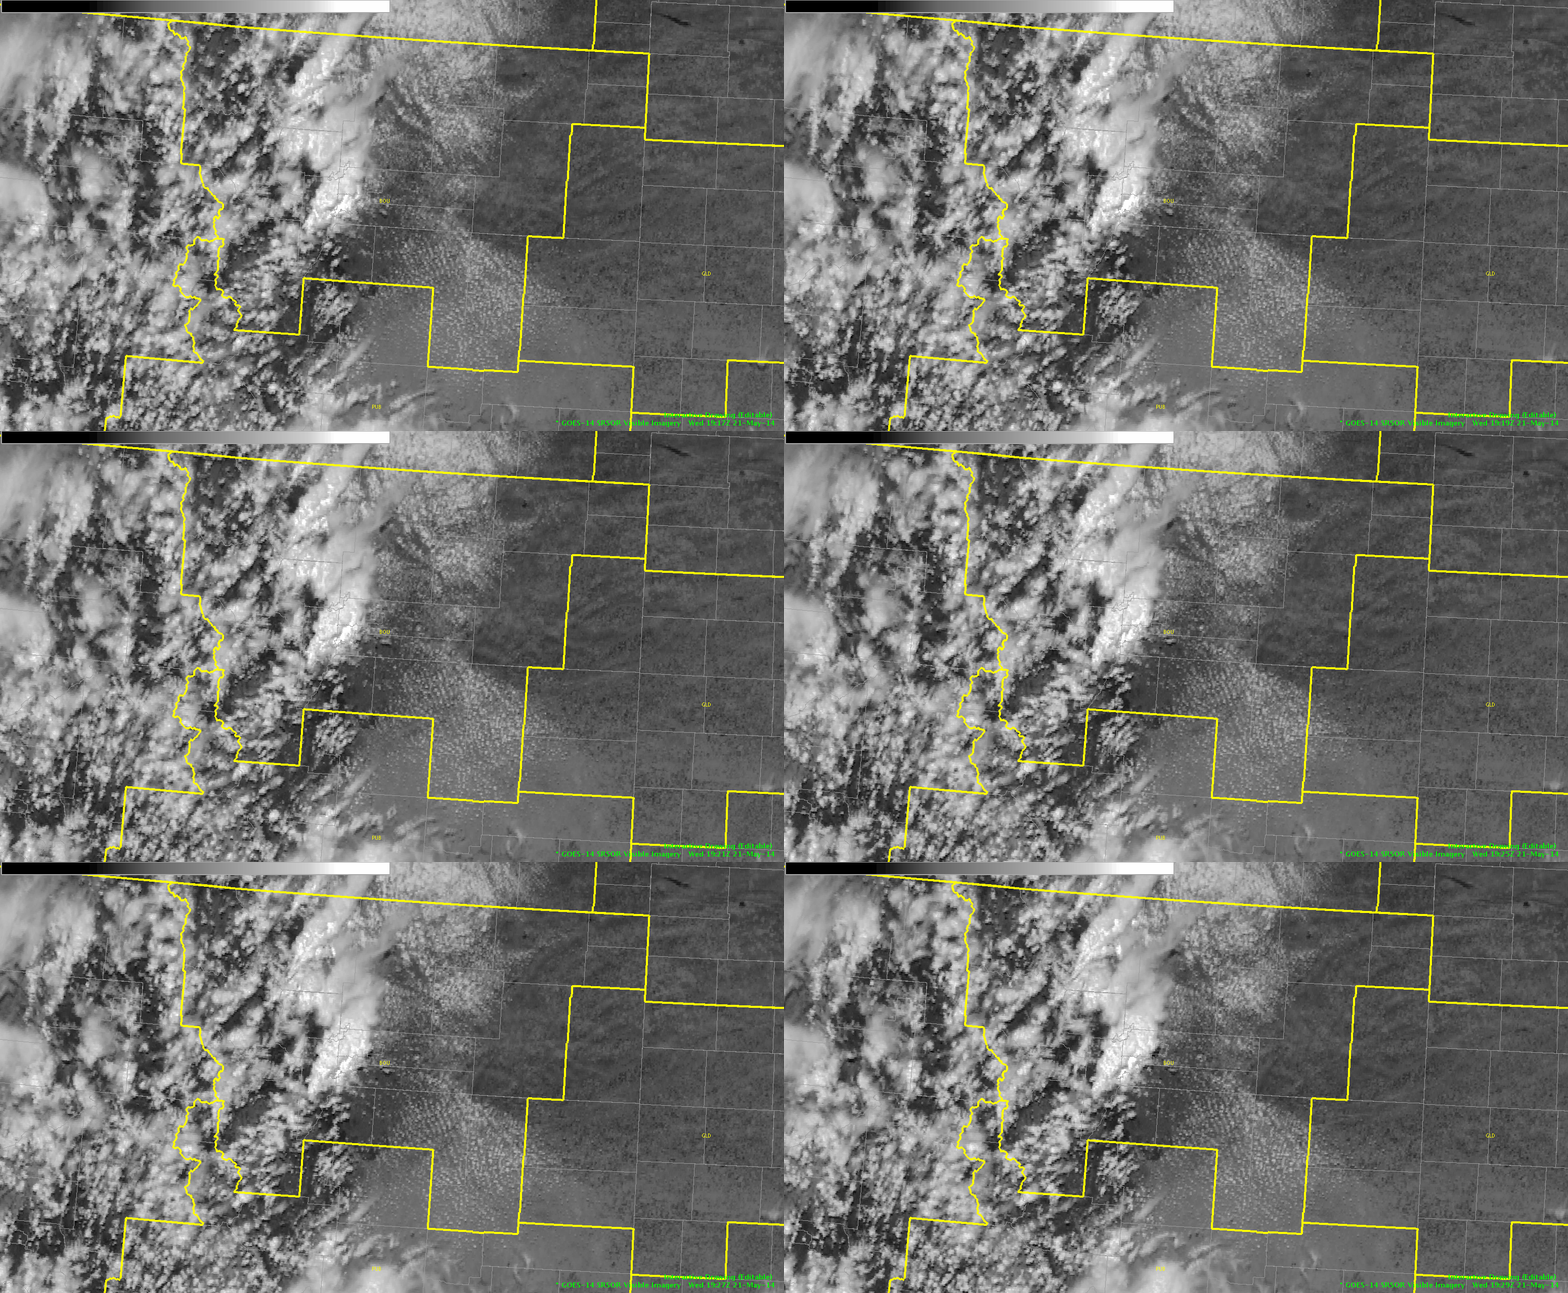
Our second team is working out of the Boulder/Denver, CO (BOU) CWA diagnosing the rapidly developing convection from N/S near the Front Range Mountains.

Super-Rapid Scan visible imagery from 1917z-1929z

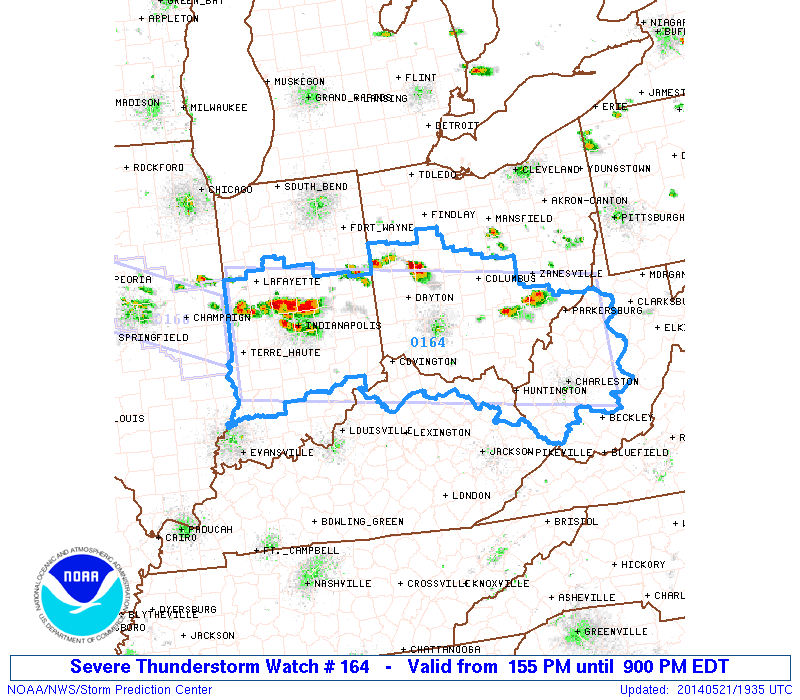
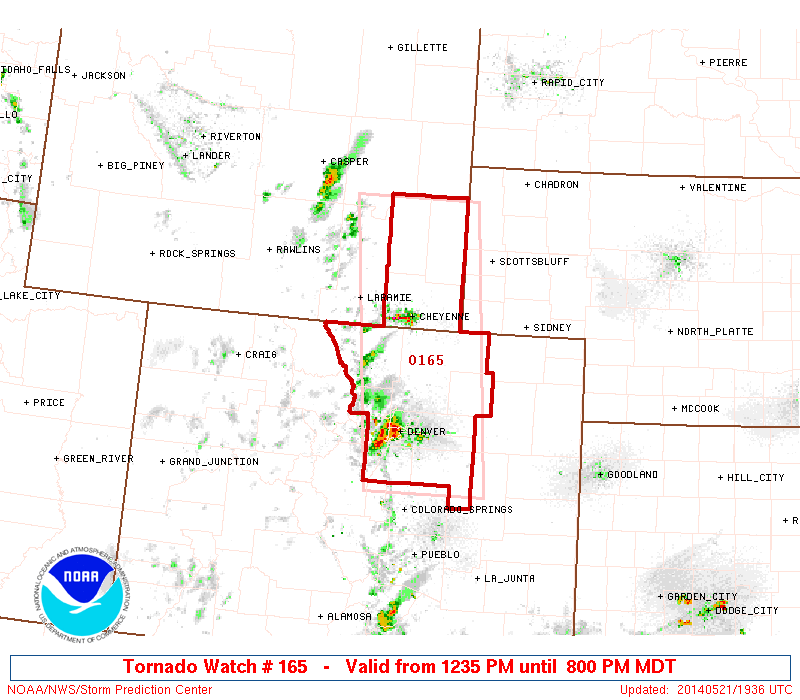
With a Severe Thunderstorm Watch issued for the Ohio Valley and a Tornado Watch issued in CO/WY region until 9pm, it looks like a busy afternoon ahead.

WW #164 from the Storm Prediction Center.
WW #165 from the Storm Prediction Center.

-Darrel Kingfield
EWP Week 3 Coordinator

Tags: None

PROB-SVR and MRMS Products in Western Ohio

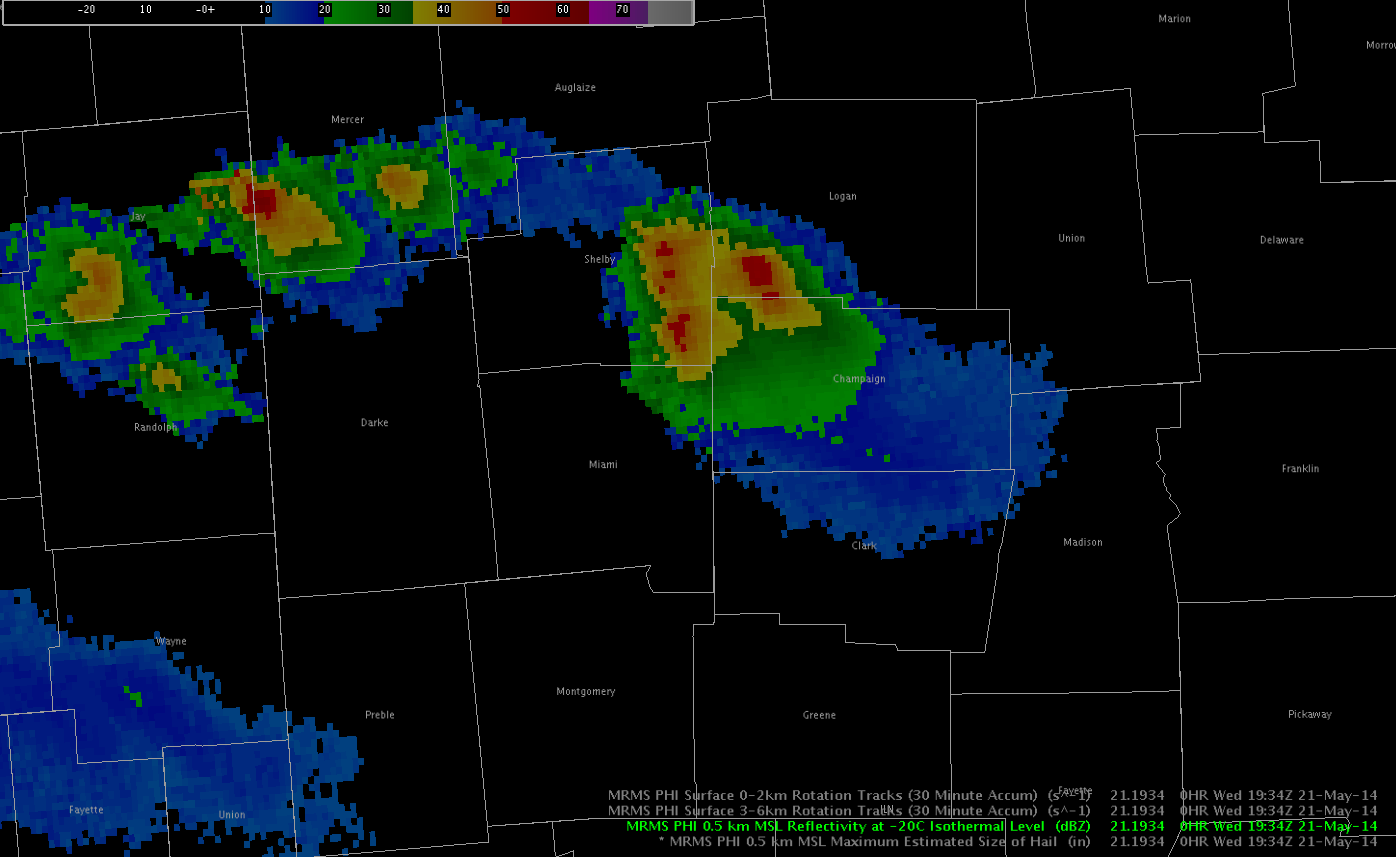
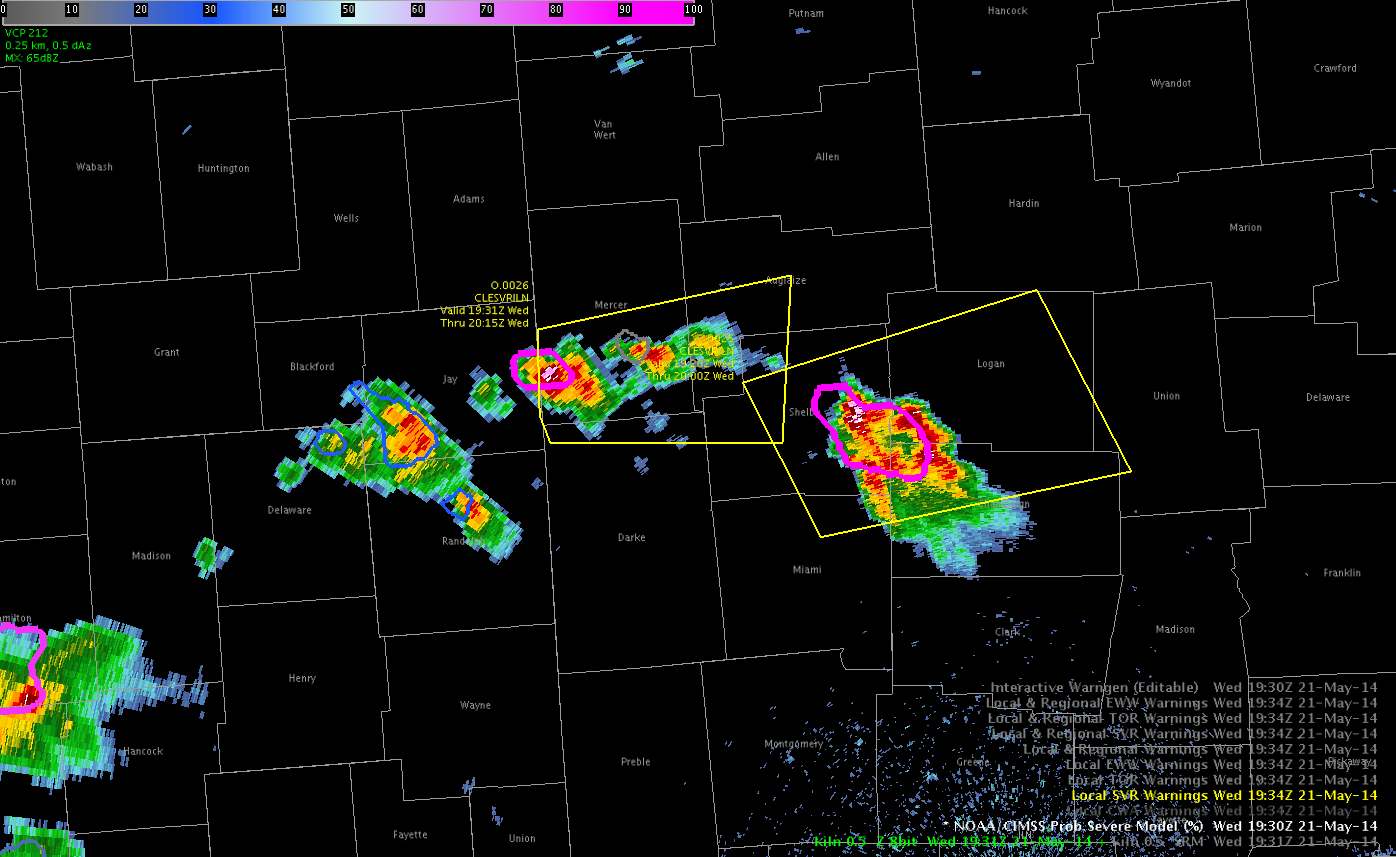
Two early severe thunderstorm warnings have been issued based on MEHS, Reflectivity Above -20C, and Probability of Severe Products.  MEHS increased rapidly with each storm increasing confidence that storm was rapidly developing.  Used previous analysis of LAPS information to increase confidence that storms in this area could be supercellular.

21May2014-1934Z-ReflectivityAboveM20 21May2014-1934Z-PROBSVRBR

– JRM

Tags: None

Convection Initiating Across N. IND

The convective initiation product is performing much better today as compared to what I was looking at yesterday. At 1815Z, 50% probs began to appear across the northern portions of IND’s CWA with a 60% area appearing at the intersection of the LOT/IWX/IND CWAs. At 1825Z & 1830Z, 70% CI probs had appeared just to the west of the supercell that was already underway and by 1837Z, the probabilities maxed out over 90%. Check out the loop below.

1715Z-1855Z_VisIn the next still image, I outlined the area that my partner and I are watching this afternoon, which matches exactly with where the CI product is highlighting (1837Z).

1835Z_Vis&CIBelow is a KIND radar loop between 1832Z and 1910Z, again outlining where convection is firing up across the northern CWA.

1832Z-1910Z_KIND0.5ref~Linda

Tags: None

LAPS Expected Convective Mode

LAPS products show widespread convection developing across the ILN CWA by 21Z this afternoon.

21May2014-2045Z-LapseReflectivity

In addition, some updraft helicity signals are noted.  Helicity signals are paired, which tend to suggest to me that stronger storms will be of a favored mode for splitting.  Large hail will be the initial threat.  The strongest signals are in the western portion of the CWA and the southeastern portion of the CWA, and convection has started in both locations, though both areas of convection appear to be sub-severe (at the time of writing this post, the Shelby County storm intensified quickly).

21May2014-2045Z-LapsHelicity


– JRM

Tags: None

Thought Expirament

While in Glasgow, our office about 4 to 5 years ago experienced a point where the lightning had taken out the main radar during severe weather…. about 5 minutes later another strike made all land line phones go dead.

What to do? Well at that time everything we had the backup office had. So, it was up to us.

At that time Satellite, lightning, and the one office emergency cell phone went into action.

It just so happens that a large portion of the products now being tested including nearcast, LAPs, rapid scan satellite with cradle to grave diagnostic algorithms for it, and total lightning and each have nothing to do with radar. I would like to see what happens when the radar goes down and how much difference there will be between me and the neighbouring forecaster for warning boxes. Finding things that work the best and seeing how much a box can be physically shrunk down as compared to an operator with radar is key in this scenario.

Grant H.

Tags: None

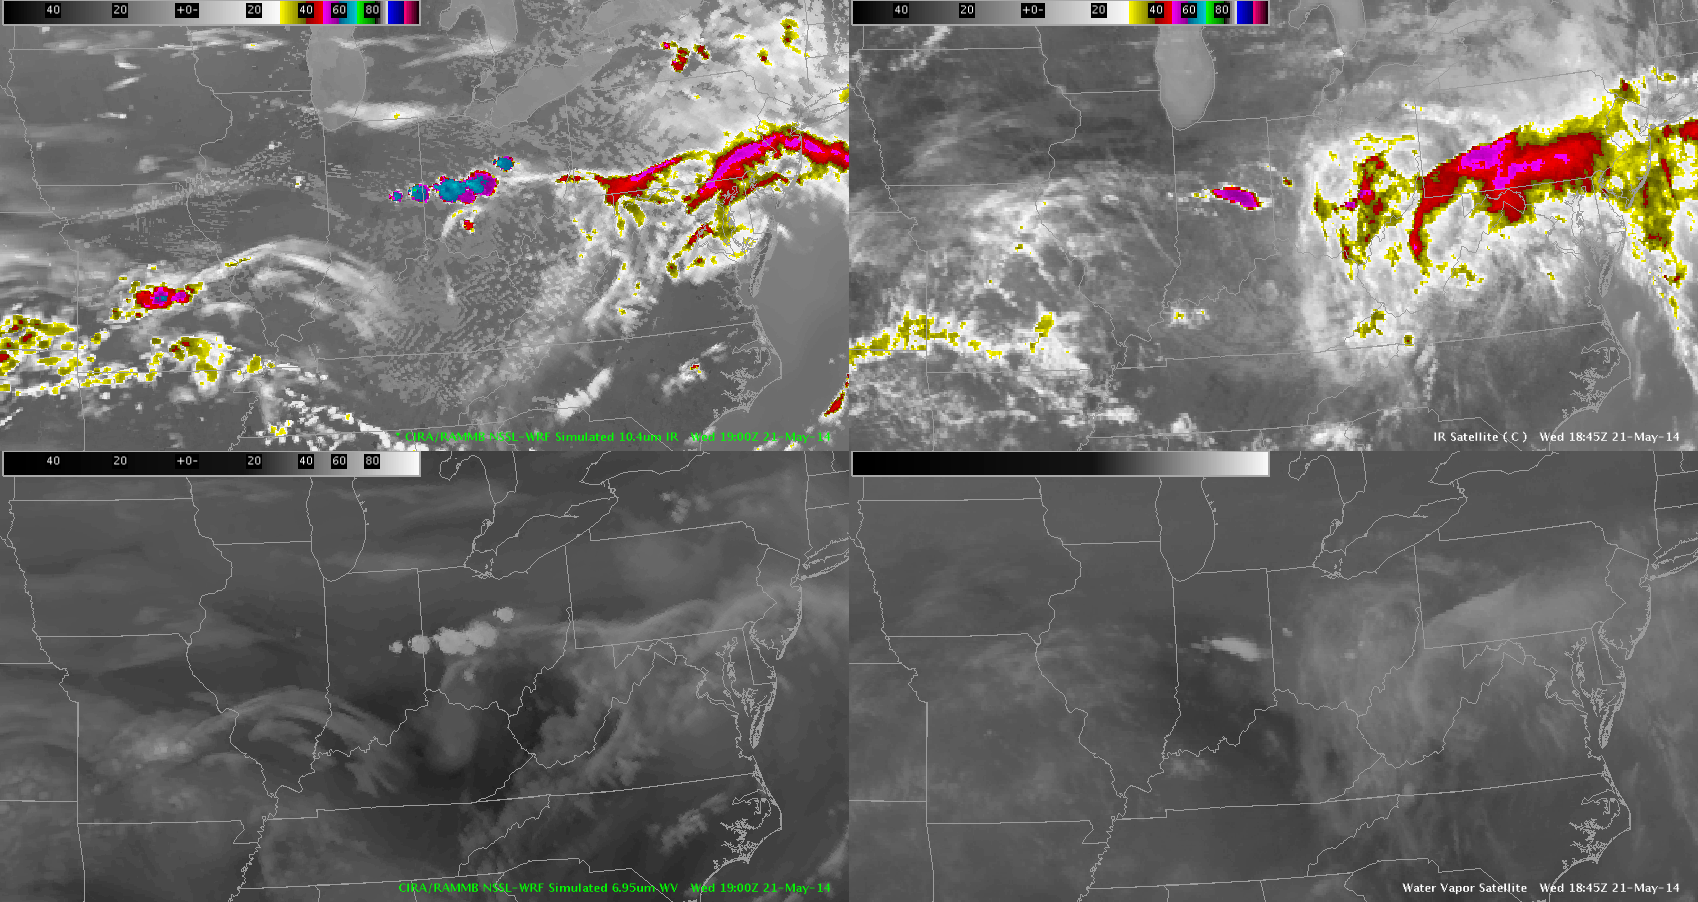
May 21 Simulated Satellite Vs. IR Sat


May 21 Simulated Sat 1845When comparing the NSSL-WRF simulated satellite to the IR satellite the timing of convection as you can see is right on.  However, the location of convection is farther west in central Indiana so it does make me hesitate for where convection will actually move too. ~Vollmar


Tags: None