Warned Storm Lightning Data (OUN)

Thought I would do a quick post on the lightning data from a warned storm in the SW part of OUN area. Earlier, there were a few cell mergers that caused some jumps on the time series (right around 2020Z on the image below), but otherwise there was a steady rise in the total lightning data, with a few smaller jumps as it reached its peak.

20150507_2052Z_WarnTimeSeriesThe second image has the two main lightning cells within the warning, but you can see one smaller cell that was seperated out at that time before quickly merging back into the larger cell.

20150507_2052Z_WarnLightningCell-SRF


Tags: None

pGLM, lightning jump, and prob severe

Amongst a mess of convection in the Lubbock CWA, some of the new tools definitely help focus your attention on certain cells.

One sigma lightning jump

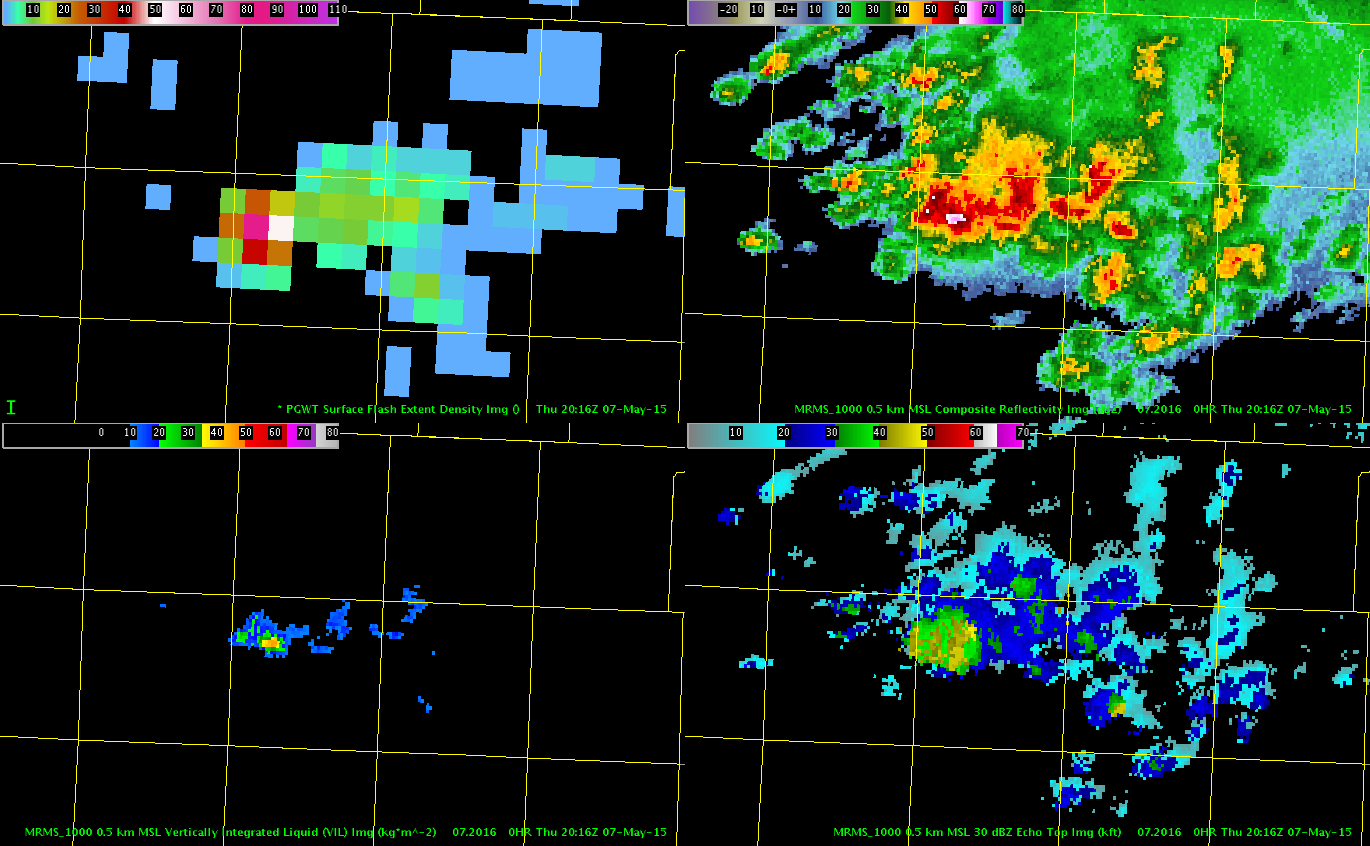
Just looking at the radar data, not much stands out. However, the lightning jump and prob severe (86%) definitely catch your attention.

KLBB pGLM 2016ZAt 2016Z, the lightning density peaked at 81, the highest I’ve seen so far.

KLBB prob severe 2016ZBy this time the prob severe was up to 94%. Based on radar data the storm looked like it intensified for a short time and was definitely stronger than other cells in the CWA. Nothing was reported with it (so far). This is a good case for using these tools for situational awareness, and perhaps giving you longer lead time on certain cells within a mult-cell cluster or line of convection.

-V. Darkbloom


Tags: None

UAH/GOES-R CI across southern LUB

The predominant scenario for convection across the central/northern LUB CWA is the continued slow movement of the MCS. A weak outflow/remnant boundary exists west and south of the slowly easterly moving MCS that has acted as a trigger from some storms to fire as the mean southerly flow advects a shallow cumulus field toward the MCS. The dryline remains just west of the CWA and may be a focus for storms later this afternoon.

The CI field below continues to possess high percentages as it advects towards the outflow/remnant boundary. Overall it has been a good situational awareness aid. The example below shows a small cluster of cumulus with higher percentages near Girard, TX, at 2007Z that crossed the outflow boundary and quickly ramped up with increasing reflectivity values well above 35 dBZ (images from 2003 to 2011Z).

CI_2007Z_southernLUB2003ZLUB2006ZLUB2008ZLUB2011ZLUBBrick Tamland

Tags: None

Currently Using ProbSvr for Situational Awareness

Storm in the southern portion of our forecast area have been posing the greatest threat for severe weather, actually receiving a 2 inch hail report near Mabelle TX.  While focusing my attention there, I have been using the ProbSevere model to provide me with general situational awareness for the north-south line of storms further to the north.  I will also run through the all tilts base data just to confirm there is no significant threat to monitor but this is a nice tool to have to provide situational awareness for multiple storms in the forecast area, especially if you are in a situation where staffing would not allow for sectorization.  Notice in the image below the very low ProbSevere values along the north-south line of storms.

ProbSevere_SA

Jack Bauer

Tags: None

Update on Warning for SW OUN CWA

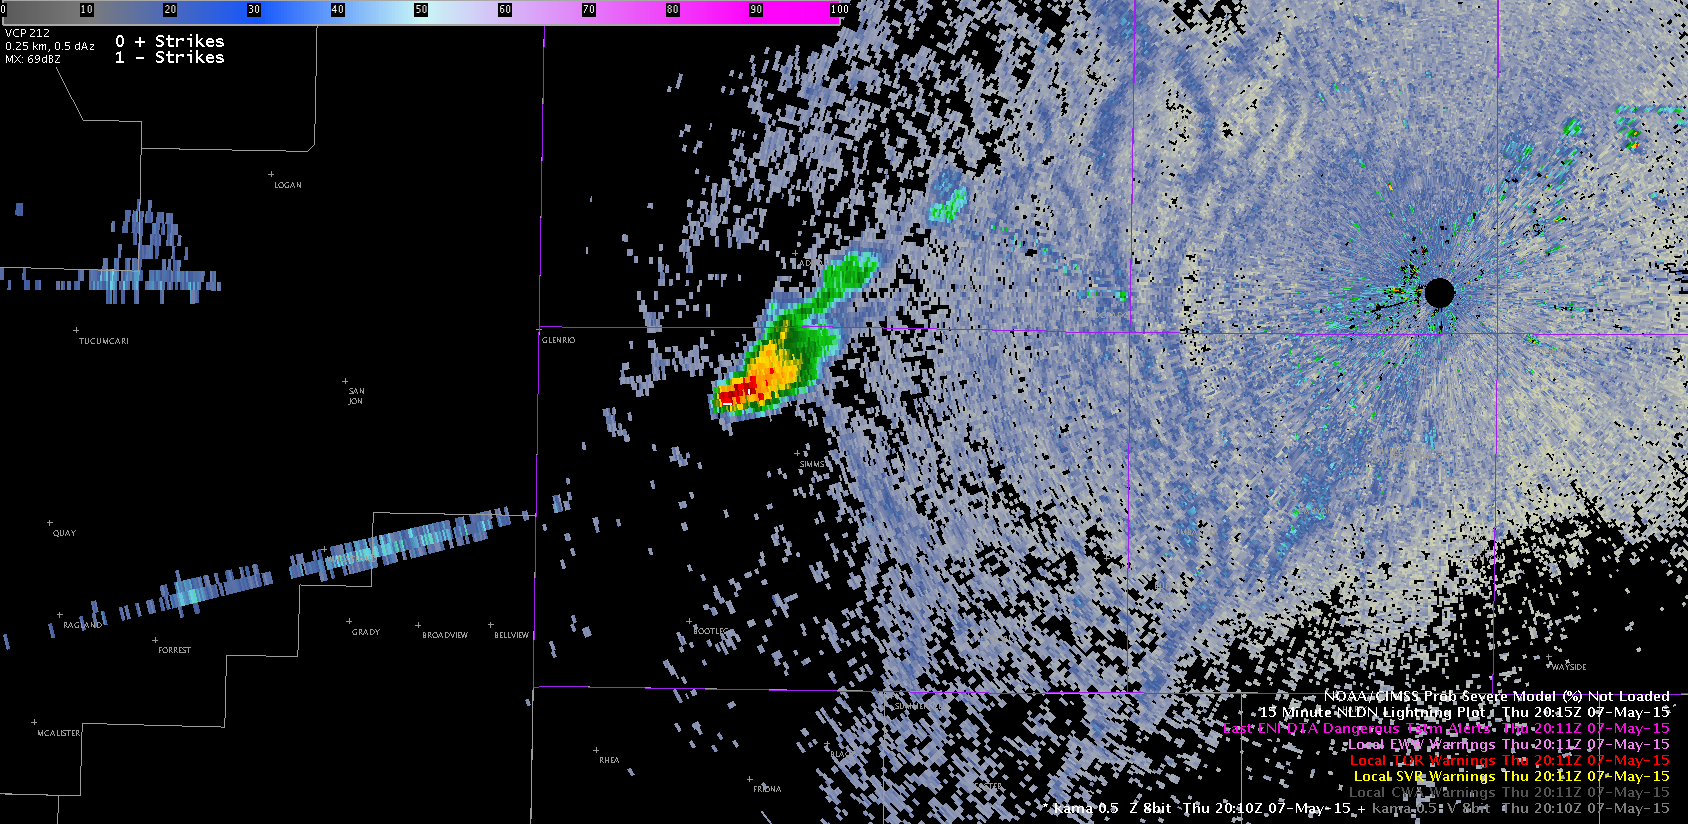
Have issued another warning to the northeast of the initial warning. The southeast storm is the strongest with a large hail core aloft, but lightning cell data shows lower lightning than the storm to the northwest that is starting to merge with the existing line. Opted to keep the warning farther to the northwest from the strongest cell due to the amount of lightning (and a 100 flash/min alert).

20150507_2008Z_WarnLightningCell-SRF

Tags: None

GOES CI in Amarillo CWA

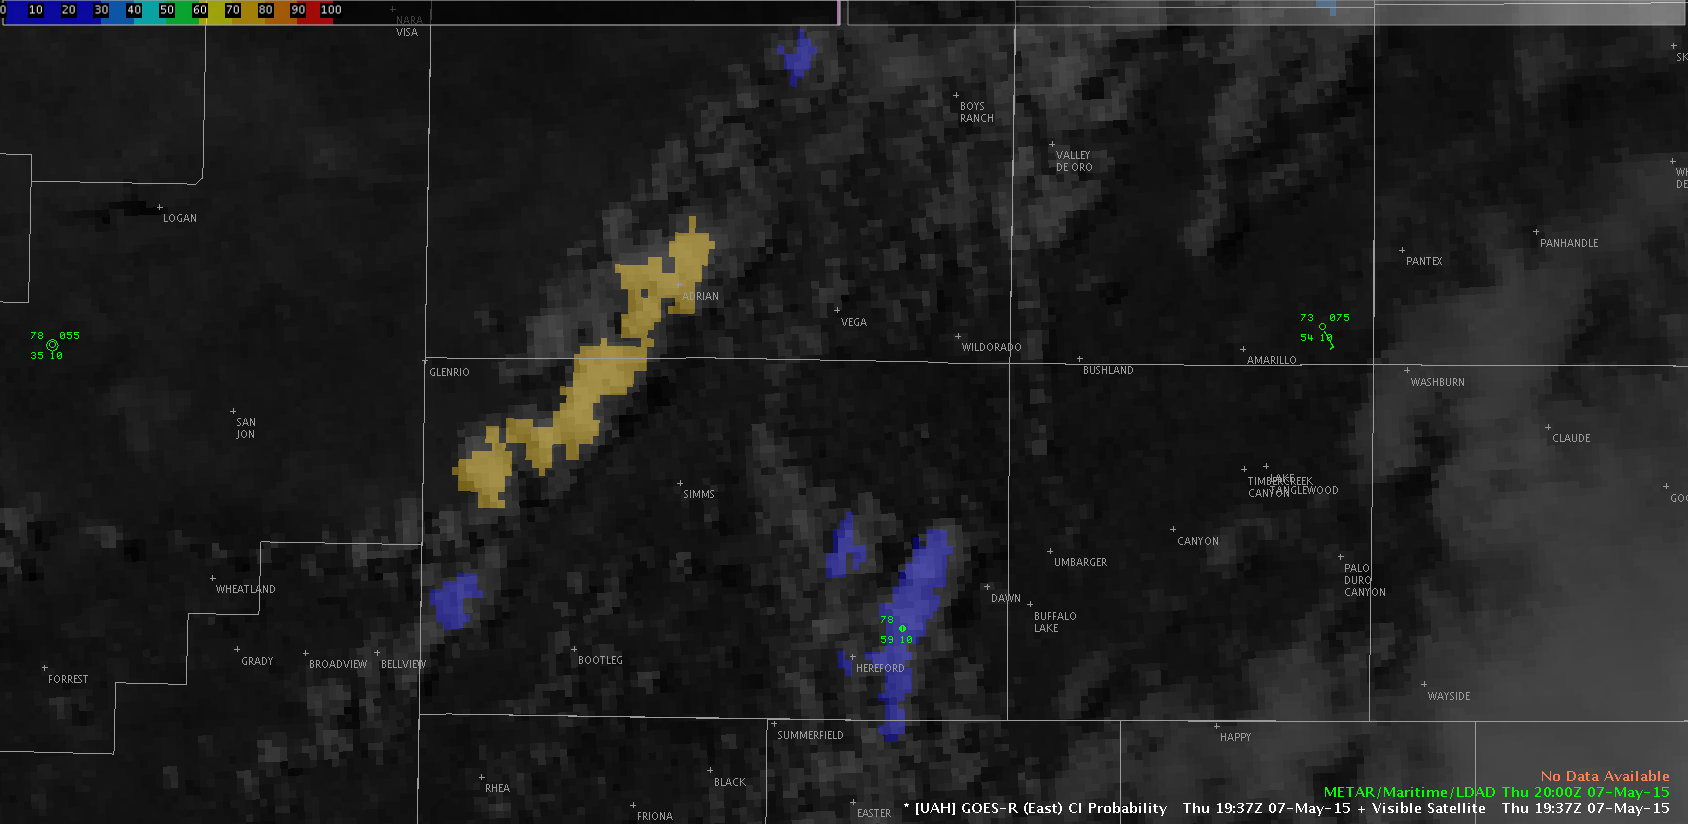
Morning MCS over the southeastern Texas panhandle has resulted in a north-westward propagating outflow boundary.  This boundary has merged with a loosely defined dryline in northern parts of the CWA, with the dryline then extending further to the south.  More elevated values of GOES CI (30-60%) has focused very well along these boundaries.  An area of 75% probability was indicated at 1937 UTC.  By 1956, a weak echo was apparent in the AMA radar reflectivity.  By 2008 UTC, the intensity had increased to 50-60 dBz.

AMACI75 AMAreflecGOESCI

ALEXANDERS DARK BAND/LYNFORD

Tags: None

LBB Prob Severe and Lightning Jump

Looking at prob severe and the lightning jump associated with a particularly nasty looking storm.

The prob severe at 1918Z - 52%
The prob severe at 1918Z – 52%
1924Z - prob severe jumps to 70%
1924Z – prob severe jumps to 70%
1926Z prob svr - up to 85% with a 3 sigma lightning jump
1926Z prob svr – up to 85% with a 3 sigma lightning jump
1927Z - 65 dBZ at almost 27 kft AGL!
1927Z – 65 dBZ at almost 27 kft AGL!

A severe thunderstorm warning was issued at 1932Z. No reports yet.


-V. Darkbloom

Tags: None

Warning issued for Storms over SW OUN CWA

Rapidly intensifying storms entering the OUN cwa where picked up well on ProbSevere, with them quickly rising to 90%. Based of the reflectivity cores aloft, broad rotation, and the rapid increase in ProbSevere, have issued warnings for multiple storms in the SW corner of the cwa (at 1922 and 1924Z).

20150507_1920Z_Radar_PSWhile the ProbSevere and cores aloft support the warnings, lightning data has been struggling so far with the peak lightning cell data only around the mid 20s.

20150507_1926Z_Radar_Warning_PS20150507_1931Z_Radar_Warning_LightningCellFinally, here is a look at the time series for the strongest cell, with a few jumps but overall limited flash amounts.

20150507_1936Z_LightningTSWill be monitoring the lightning trends and see if the data catches up with the radar and ProbSevere appearance.

-SRF

Tags: None

ENI Time Series and Storm Merger

While looking at the ENI cell polygons and flash rate data on a storm near the border of Greer and Jackson counties I noticed a significant jump in the values from below 20 up to well over 100 in about a 10 minute period.  The cell polygons at 1821 UTC on the image below showed two separate storms, one with a flash rate of 12 and another to the north with a flash rate of 54.  During the following 10 minute period the southern storm merged with the northern storm.Radar_1821utc

The radar data at 1832 UTC showed the two storms had merged and there was one large cell polygon now (111 flashs) which encompassed both of the previous cells.  The base radar data at this time did not support a warning and this is a case where the lightning data should not be used alone and it yet another tool in the storm interrogation and warning process.

Radar_1832

Below is the ENI time series showing the large jump in the lightning flashes.  It is important to note that the cell area can be a valuable piece of information for forecasters to look at in situations like this as it can be an indicator of the cell merger that took place.

ENI_TimeSeries

Jack Bauer

Tags: None

Comparison of ProbSevere and Custom DTA

After setting up the custom Thunderstorm Alerts (75/min and 100/min), there were a couple areas of focus on the 100/min alerts (to the west-southwest and southwest of KTLX).

20150507_1859Z_Radar_LightningAlertBut when comparing to the ProbSevere data, we are seeing different representations on the strength of the storms. The storm to the WSW only had a ProbSevere around 11% (that had the greatest flash rate around 149 per min), while the storm to the SW had a ProbSevere of 88%, but a weaker flash rate (87 per min).

20150507_1901Z_Radar_ProbSevereThese differences highlights the need for analyzing multiple data sources and comparing to radar.

-SRF


Tags: None