ProbSvr First Look

One of my favorite things today about the ProbSvr is the ability to make it a “quick look.” This image is after marginally severe weather a little earlier, so environmental wise in general, it isn’t favorable. But what if it was favorable and I was just glancing, waiting for things to pop? Like the example below, I can quick glance at this mess and see that all the ProbSvr is under 10% so I shouldn’t be worried for severe weather without having to look through various levels of radar data.


lowprobsvr


Lauren13

Tags: None

Observed Radiosonde Data/NUCAPS Comparison

A special 18Z radiosonde launch was done at Wilmington, Ohio. The special launch allows for direct comparison to a dervived NUCAPS sounding.

Here is the observed radiosonde data:

soundingHere is a NUCAPS sounding from nearby:

NUCAPS_1Note that the NUCAPS sounding is not representative, especially near the surface. The surface temperature is 77F and the dew point is 55F on the derived sounding. A nearby METAR close by the NUCAPS sounding was 85F/61F.

However, if the boundary layer temperature and dew point profile is modified using nearby METAR observations (85/61), the SBCAPE is more representative to the observed sounding (1761 vs. 1688 J/kg):

NUCAPS_2Therefore, it is critical to look at the near-surface temperature and dew point profile when using NUCAPS derived soundings.

Polarimetric Researcher

Tags: None

First Impressions – ENI products

Day 1, two words: Data. Overload. So many new products to look at. However, once you dig into each individually, there is a lot of cool stuff there. Just getting an initial look and feel for all the GOES-R and ENI products available to us today.  Decided to focus mainly on the ENI stuff today. The ENI total lightning counts are really eye-opening. The addition of the in-cloud component reveals a lot more activity that we weren’t previously aware of.

The ENI Cell flash rates and cell polygons are really interesting as well. The two combined would give a better indication of which cells to focus on. Especially in the West, for fire weather/dry lightning situations, this will be very helpful. Due to the pop-up, nearly stationary nature of the storms over terrain, the cell tracking and motion projection features may not be very useful, but can be turned off or simply not used. Need to remember if you are using the cell flash rates and comparing to the ENI total lightning counts, to use the 1-min TL counts since the cell flash rates update every 1 min – compare apples to apples.

Loving the ENI time series plots. It’s helpful to see the trends with a particular cell. Is it strengthening/weakening electrically, and a visual distribution of the different flash types and how they vary over time. These would be especially helpful in the Southwest in the warning process, as a component in whether to warn or not based on the overall upward or downward trends in flash rates. The storms there tend to be short-lived and more isolated in nature, which this product seems geared for. Interesting to note and a caveat with the time series is trying to pick out possible lightning jumps with it. The “jump” on the time series could be tied to an increase in cell polygon size, not flash rate, caused by mergers of two or more individual cell polygons.

First impressions of the ENI Thunderstorm Alerts…jury is still out on the usefulness of these alerts. I tended to use the time series if looking at a specific storm or the Cell Flash Rates if looking more generally at which cell is more active.

Still trying to figure out which products among all the ENI and GOES-R can be overlaid or used together (taking into account what goes into each product); that is, if you can overlay Lightning Jump with cell flash rates and have them be compatible.

~ Regina Phalange

Tags: None

Pitfalls of Automated Warnings

One of the pitfalls of automated warnings (regardless of what they are based on) is they tend to “hold on” to warnings too long, since they cannot be expired early. Here is an example where a cell had been weakening for some time (>20 min), yet the 45 min Dangerous Thunderstorm Alert (DTA) from ENTLN was still valid. I imagine a forecaster in this situation would expire the warning long before the DTA expired.

AutomatedWarningsHoldOn

Ertel

Tags: None

ProbSevere vs ENTLN Time Series

Here is a good example showing the similarities in trends of ProbSevere, ENTLN total lightning data, and radar data. At 1908 UTC, lightning flash rates neared a peak and ProbSevere was ~50%. At  1919 UTC, the lightning flash rates had dropped significantly as did ProbSevere. By 1925 UTC ProbSevere quickly increased to ~75% at the same time that lightning flash rates were rapidly increasing. Finally, by 1945 UTC, ProbSevere decreased to 9% and lightning flash rates plummeted. Soon after this the storm dissipated. These types of products could help forecasters “hold onto” or “let go” of a warning sooner.

ENTLN Time Series
ENTLN Time Series
1908 UTC
1908 UTC
1920 UTC
1919 UTC
1925 UTC
1925 UTC
probsevere-18
1946 UTC

Ertel

Tags: None

ENTLN last frame can be misleading…

Depending on when you look at the last frame of the gridded lightning data you might not get the whole picture. The two screen captures below show this. One of the screen captures was taken at 1924 UTC, but if you look at the legend, the gridded lightning data says 1925 UTC. However, there are only 4 minutes of lightning data going into the 5 minute lightning product.  The next image was taken at 1925 UTC and includes the whole 5 minutes of lightning data. As you might expect, there is more lightning when it includes the whole time frame. If a forecaster was not aware of this, it might appear as though the storm is weakening when in reality it is just an artifact of how the product is generated. I would suggest waiting until the full time period is over before displaying the product…which would make analyzing trends much easier!

ENInotComplete
5 min gridded data with only 4 minutes of data
ENIComplete
5 min gridded lightning data that has a whole 5 minute period worth of data

Ertel

Tags: None

Day 1-Svr Prob Example

Hello everyone! This is day one of Week 2 of the Experimental Warning Program and we are getting situated and learning the products and making procedures. I personally was excited to try out the ProbSvr model as I think it could help with storms that pulse and that become severe or near severe within a scan or two- this is extremely useful in the northeast and even in squall line situations. While looking at it today in LMK’s area, we got a report of power lines down and I captured some of the ProbSvr data and I found it very interesting. I’ll step through the times.

1818z- This is as the northern storm was strengthening and the ProbSvr is hinting about 24%.

1818z

Next, at 1823Z, the ProbSvr bumped up to 61%

1823p

At 1825Z, the next scan, the 61% is still there (probably the same run).

1825_61percent

At 1829, the ProbSvr has decreased once again.

1829Z


Although I didn’t put velocity here, it isn’t overly impressive. Important to note is the rear inflow notch that looks like it is trying to develop.

At 1830z, the office received a report of power lines down with this northern storm.

In the training on ProbSvr, the examples were giving huge lead times when the model went above 50% but this isn’t always the case. I found this case interesting because it only gave about a 7 minute “lead time” before the first event. It looks like the storm surged/pulsed right at that time but noticed how the model surged back down before the event. How does a forecaster handle this? When it surges up and goes right back down? Would it change my warning process if it decreased next scan? It is still too early to say what the implication is but I will definitely be keeping an eye on these probabilities as I go forward!


Lauren13

Tags: None

Best Practices for the use of the NOAA/CIMSS ProbSevere Model

The NOAA/CIMSS ProbSevere Model is an excellent tool for situational awareness–especially in situations with widespread convection. The tool essentially allows for a quick all-tilts view without looking at all the radar tilts because it integrates data from the entire radar volume (and assimilates other non-radar data as well). For example, overlaying the tool on the lowest radar elevation (e.g., 0.5 degrees), you can monitor trends and areas of interest by the rate of change of the probability of severe. Rapidly increasing probability of severe gives the warning forecaster insight that the storm is rapidly intensifying aloft. At this point, a forecaster can do further interrogation on the storm of interest.

Here’s an example where there is widespread convection in southeast Texas:

Probsevere-1 Probsevere-2 Probsevere-3Probsevere-4Note the probability of severe rapidly increases (10% to 86% in 8 minutes on one storm) across the western storms. This immediately signals to the warning forecaster that these storms need further interrogation and are the storms of interest.

Polarimetric Researcher

Tags: None

Default color scale of gridded lightning data

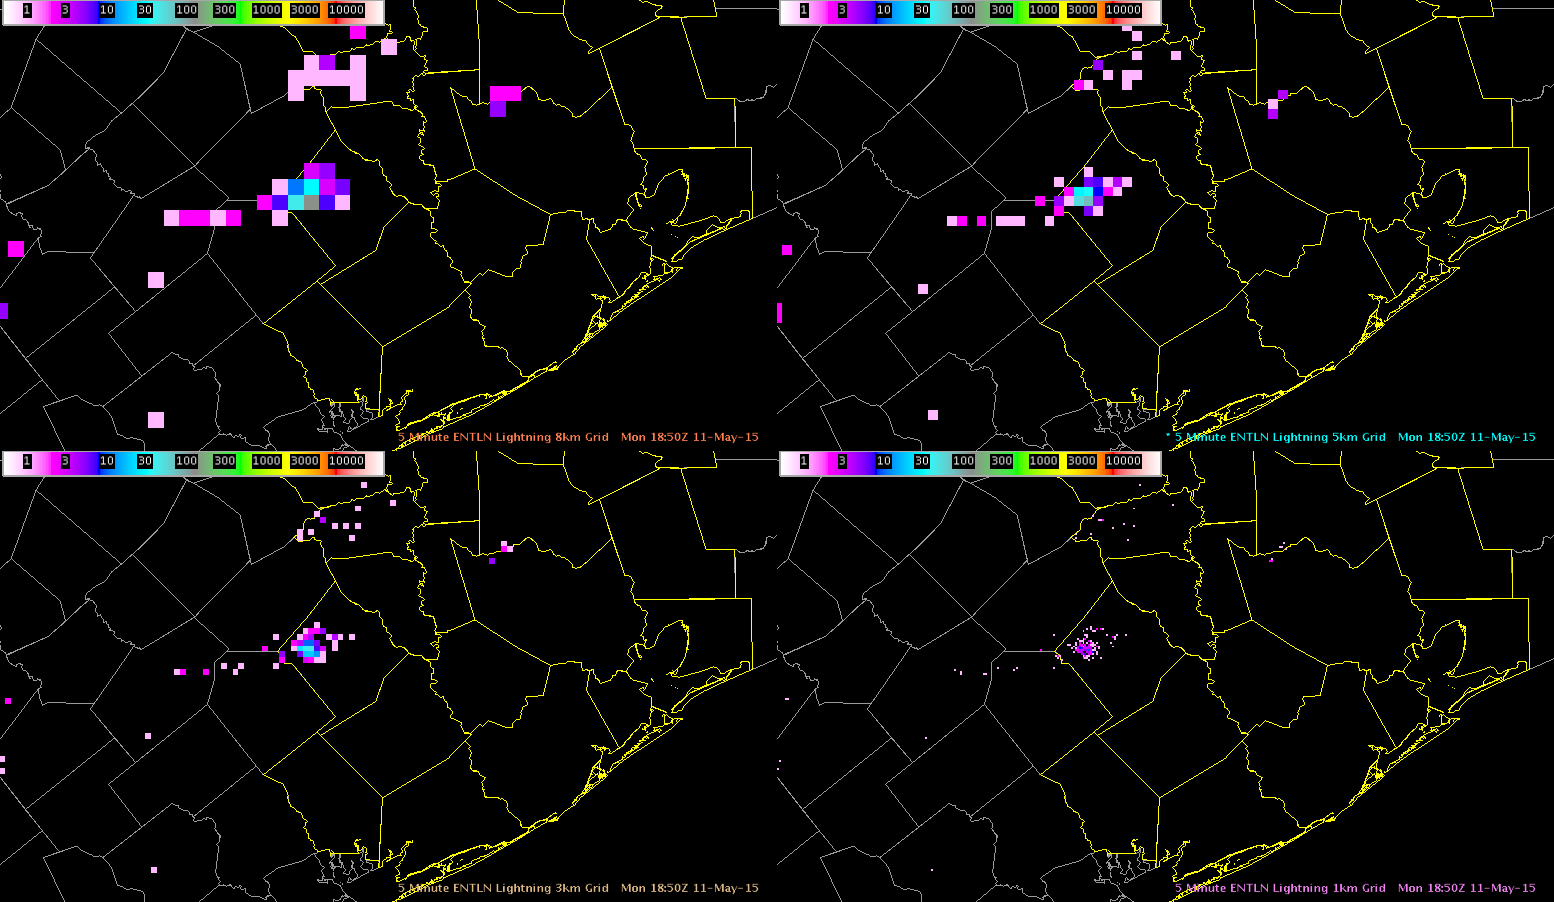
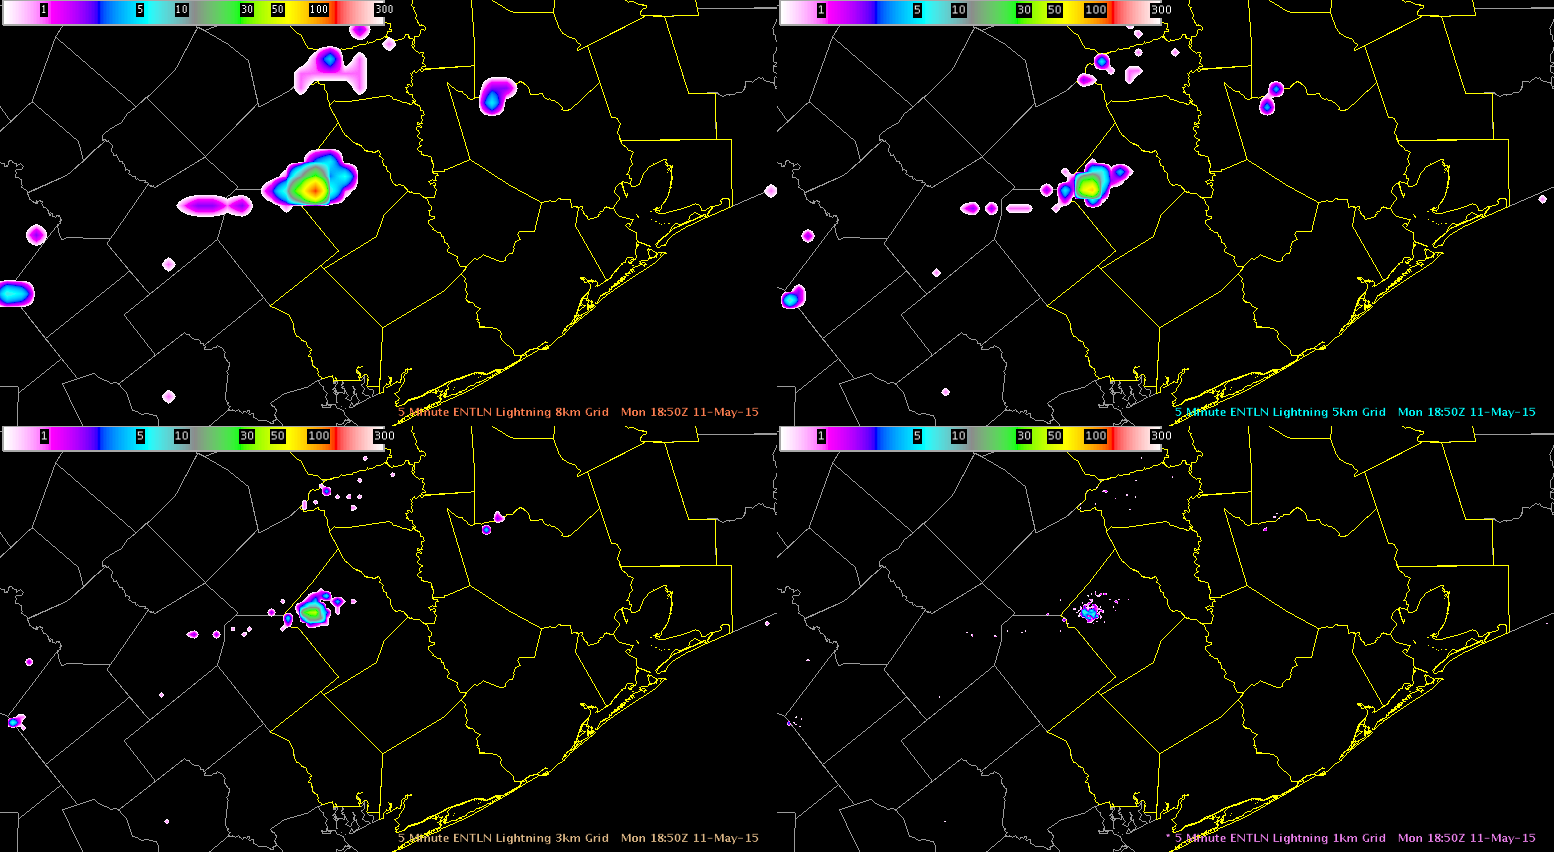
The default color scale for gridded lightning data is not very useful…as it goes all the way to 30,000 flashes. This is pretty unreasonable even for the most electrically active storm. Shown here is the 5 min total lightning data for the ENTLN gridded data at 8 km, 5 km, 3 km, and 1 km using the default color scale (with 30000 as the upper limit) and another image showing a more reasonable color scale (with 300 as the upper limit). Clearly, analysis is far easier using the adjusted color scale as the finer scale details are much easier to see. I also find that interpolating the gridded data makes visualization far easier.

ENI-Gridded-default-colorTable
Default color scale (max at 30000)
ENI-Gridded-adjusted-colorTable
Adjusted Color Scale (max at 300)

Ertel

Tags: None

EWP Week 1 Summary (May 4-7, 2015)

During the first week of the 2015 EWP Spring Experiment, we had forecasters from the Newport, Columbia, Roanoke, Marquette, and San Diego WFO’s, as well as a broadcast meteorologist from KETV Omaha, NE participate in the Spring Warning Project. With most of the active weather confined to the Southern Plains throughout the week, our CWA’s of operations included: Topeka, Omaha, Wichita, Midland, Lubbock, Amarillo, Albuquerque, San Angelo, Norman and Hastings. We had a good mix of marginal and very busy severe weather days, with Wednesday being the most active weather day as severe weather broke out across central Oklahoma.

Participants were able to use all of the demonstration products this week, which included GOES-R and ENI total lightning products. There were many good blog posts written throughout the week highlighting the use of all of these products in various forecast/nowcast/warning situations. Below is some end-of-the-week feedback on each product from this weeks participants:

PGLM

– It was useful yesterday in the Lubbock CWA.
– I have a marine responsibility in my CWA, so the lightning data would be useful for issuing sub-severe forecast products for storms moving towards the coast.
– This lightning information would be useful in my CWA on days when the fire danger is heightened.

Lightning Jump

– I was not so sure if a 1 or 2 sigma jump was significant, or if I should wait for a 5 or 6 jump.
– At one point when things were active, I was ignoring the 1 sigma jumps. The 4 and 5 sigma jumps really drew my attention.
– 3-sigma was when I really started paying attention to the storm.
– 1-sigma is probably not even worth a color, I made it transparent.

ProbSevere

– It did a good job with discrete cells, but when the mode became more linear, it suffered
– It really drew my attentions to the storms that I should interrogate further
– For me, MESH in the readout does not need to read to hundredths of an inch.
– Color/highlight values in the text display as they become more significant. Make the actual probability stand out more too.
– For the color contour, I made it neon on the higher end, and got rid of the lower end. The low end looked almost the same as the higher end.

CI

– Overall it did a pretty good job throughout the week of highlighting where CI would occur
– It really works best in a clear environment (no cirrus contamination)
– When you had a cu field developing, it did a nice job of depicting where stuff would go
– I liked using it when we had a lot of boundaries, it did a good job of depicting where along the boundaries stuff would go. Especially today when there were a lot of different boundaries in play, it gave me confidence where convection would develop and where I should look.
– Having a higher threshold for CI would be more relevant in WFO operations, and less messy
– With the colortable, the lowest probs (deep blues) stood out the most, which is not what you want to see. The higher end colors against the light background were more difficult to see. Reduce the appearance of the lower probs make the higher probs stand out more.
– Perhaps you could start out with white to light gray at the low end, and transition to colors at the higher end.

GOES-R LAP
– I use the GOES PW field the most
– I would like to know what data are from the retrievals and what are from the GFS.
– The pixelation in certain areas was an issue, with sharp, unnatural transitions present between adjacent values.

NUCAPS

– It might be a good idea to merge this product with something like LAPS to improve the lower levels.
– I want to set this up as soon as I return to my office.
– I can see myself using this a lot in the winter.
– I esepcially like the observation-based nature of it
– I would like to look at this over Lake Superiror
– Anything that gives us a temperature profile will be helpful, especially in the winter.
– In San Diego, it will benefit us during the summer monsoon. Also, the San Diego RAOB is not representative of the mountains in our CWA
– QC flags would give me more confidence in the soundings, as it is difficult to judge with just the cloud data.
– The RAOBS in my area are not representative of most of my counties, so I often use forecast soundings.

– Bill Line, Week 1 EWP Coordinator and SPC/HWT Satellite Liaison


Tags: None