

Storms are approaching the HGX CWA. GOES-16 imagery shows amply cumulus development across much of the CWA. With temps in the upper 70s and dew points in the upper 60, I expect there to be ample instability in this environment. All Sky LAPS retrievals indicate ML CAPE just shy of 1000 J/kg, but with this environment, I would expect instability to be higher.
 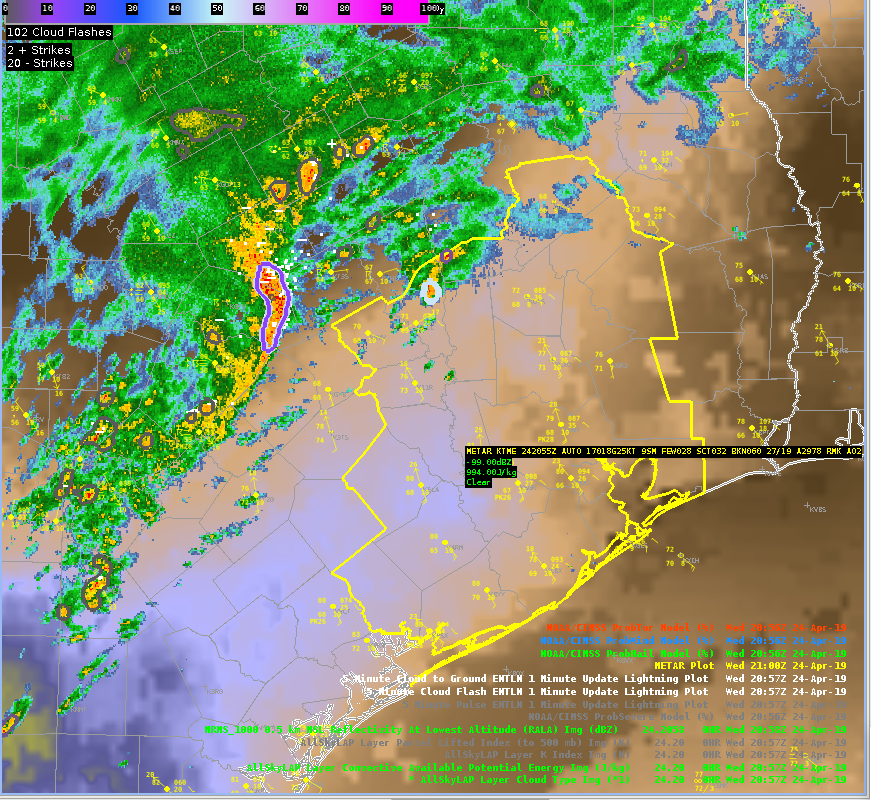 The modified NUCAPS shows a profile more in line with what I would expect to see. In this profile, the surface dew points were close to what surface obs show, but the surface temp did need to be adjusted up a bit. This sounding, coupled with analyzed deep layer shear, leads me to think severe weather is a possibility in this area.
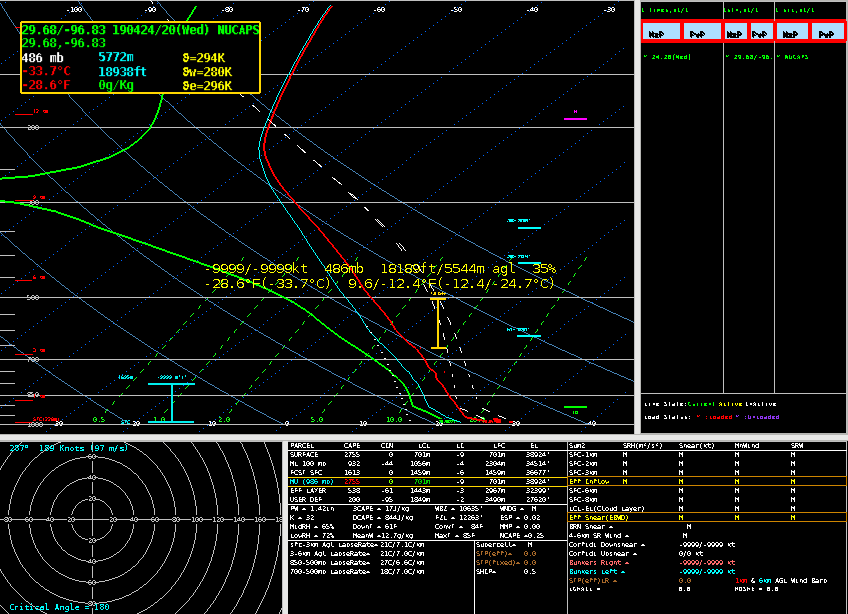 Sandor Clegane
GLM Assist In DSS
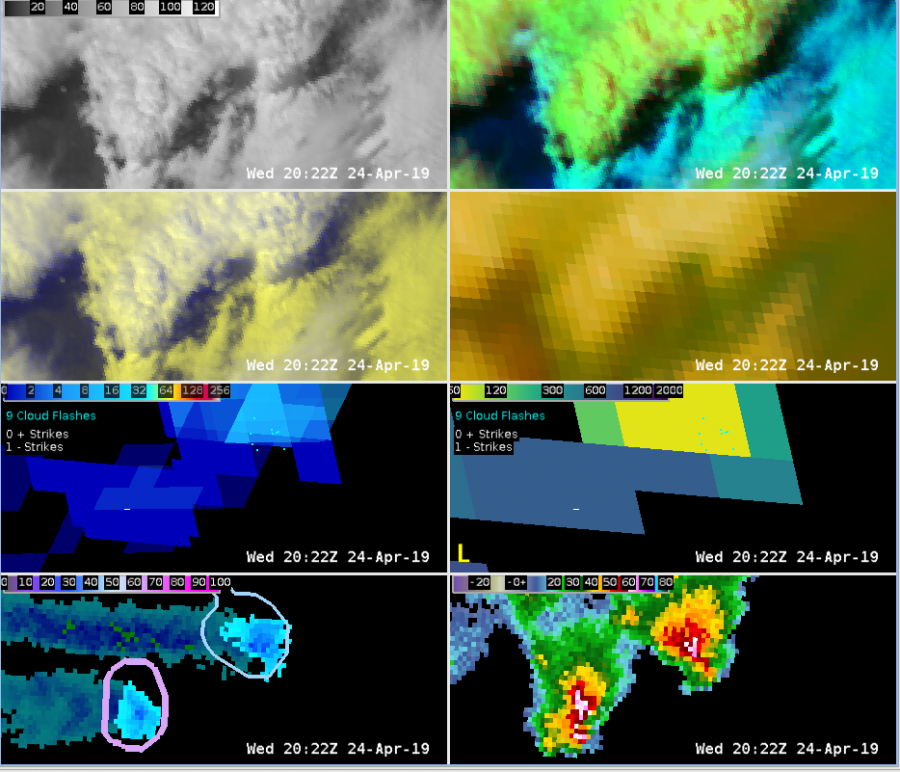
The below image shows GOES-16 day cloud convection (DCC) beneath GLM Minimum Flash Area (MFA). Point F is a DSS event. DCC shows clouds glaciating a county upstream of our DSS event, with the storm becoming electrified shortly after glaciation per MFA. This prompted a call to the emergency manager providing support for the DSS event letting them know that lightning was imminent.
ENI total lightning also shows lightning (white points), but the point data fails to show the extent of the lightning, which may lead decision makers to think that they have more time to react to the approaching lightning than they actually do. Sandor Clegane
GLM MFA for Storm re-generation
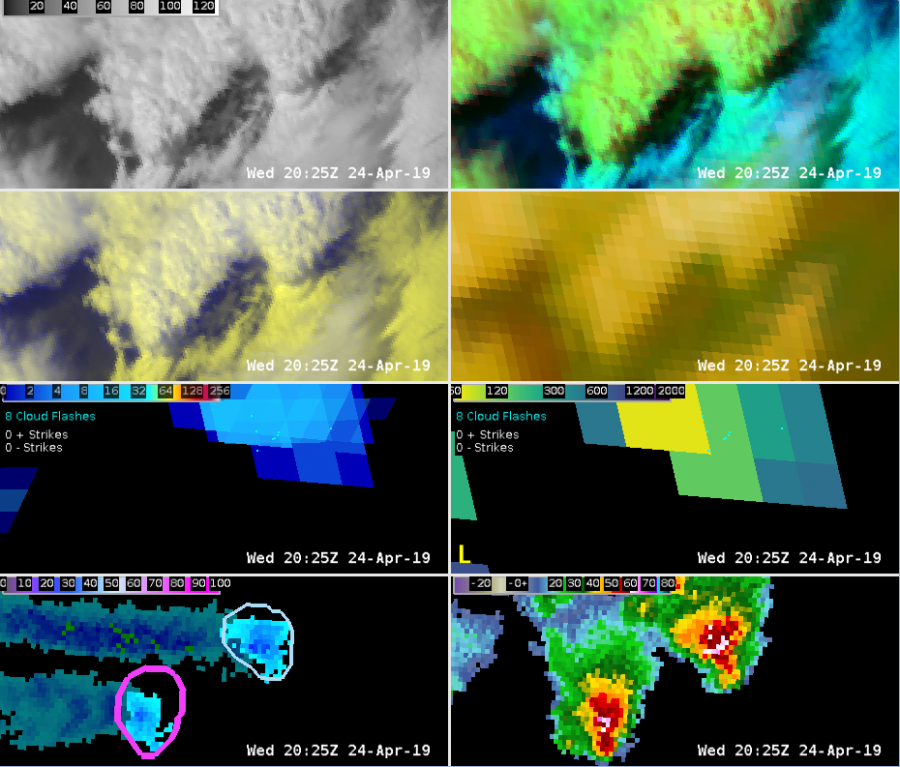
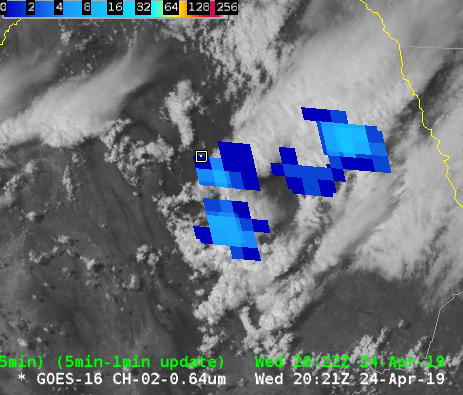
GLM Minimum Flash Area showed some utility in boosting lead time for storm re-generation. The storm in the center of the first image had started to weaken a bit after moving off of the outflow boundary that initiated it.
The storm continues to show no new updraft development in the sat imagery as well as MFA product.
At 20:29 GLM MFA begins to indicate that there may be a new updraft forming as it interacts with a differential heating boundary/outflow from the leading storm.
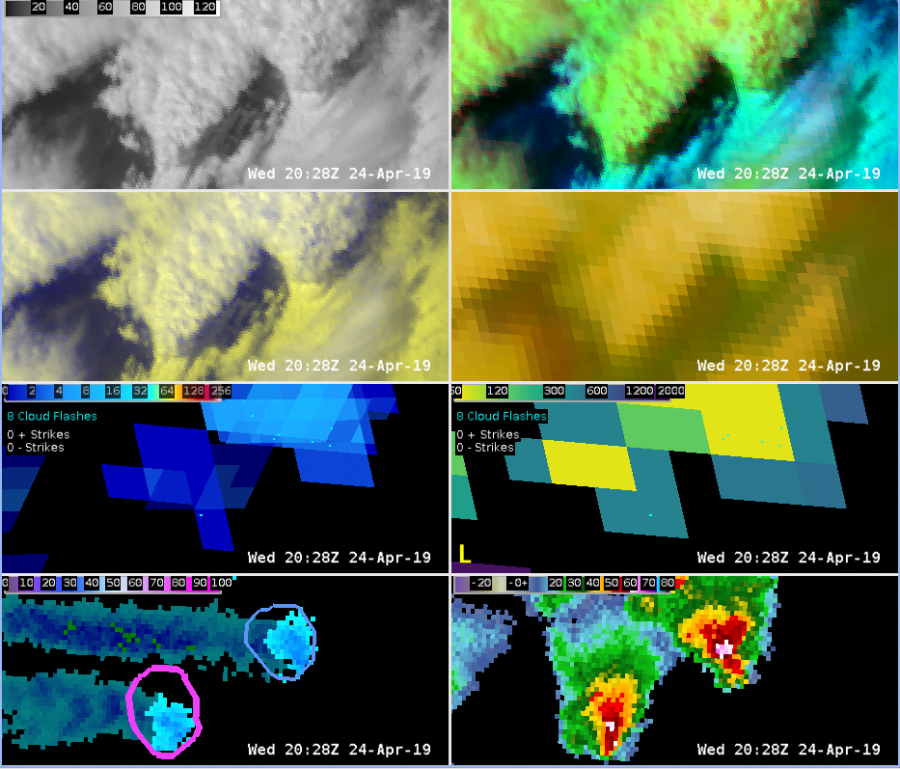
Over the next 20 minutes the updraft continues to strengthen as the storm becomes more robust. The MFA led the visible satellite depiction of the new updraft by 2-4 min. This could be useful when trying to decide whether to continue warnings or not.

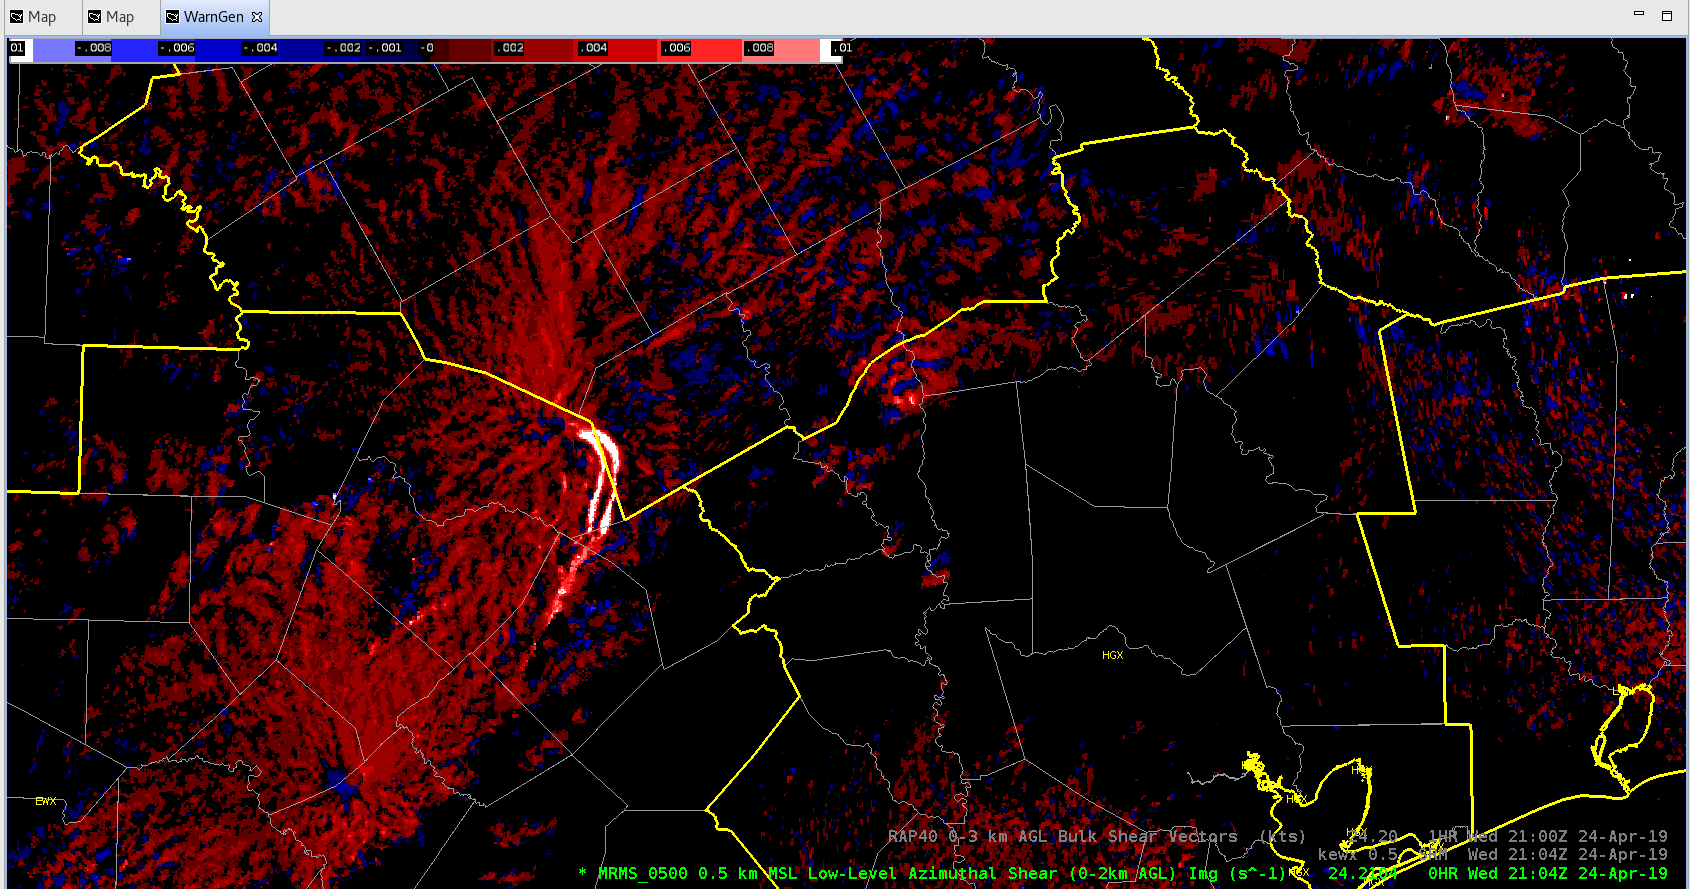
Spike in Merged AzShear Product – Wed Apr 24
Noted a big jump in the merged 0-2km AZshear product – see below. This caused a corresponding jump in ProbTor. Also note the “double peak” likely caused by SAILS scans. This is an a favorable location with > 30kts of 0-3km shear – so mesovortex formation is possible. Will be interesting to see if anything develops….
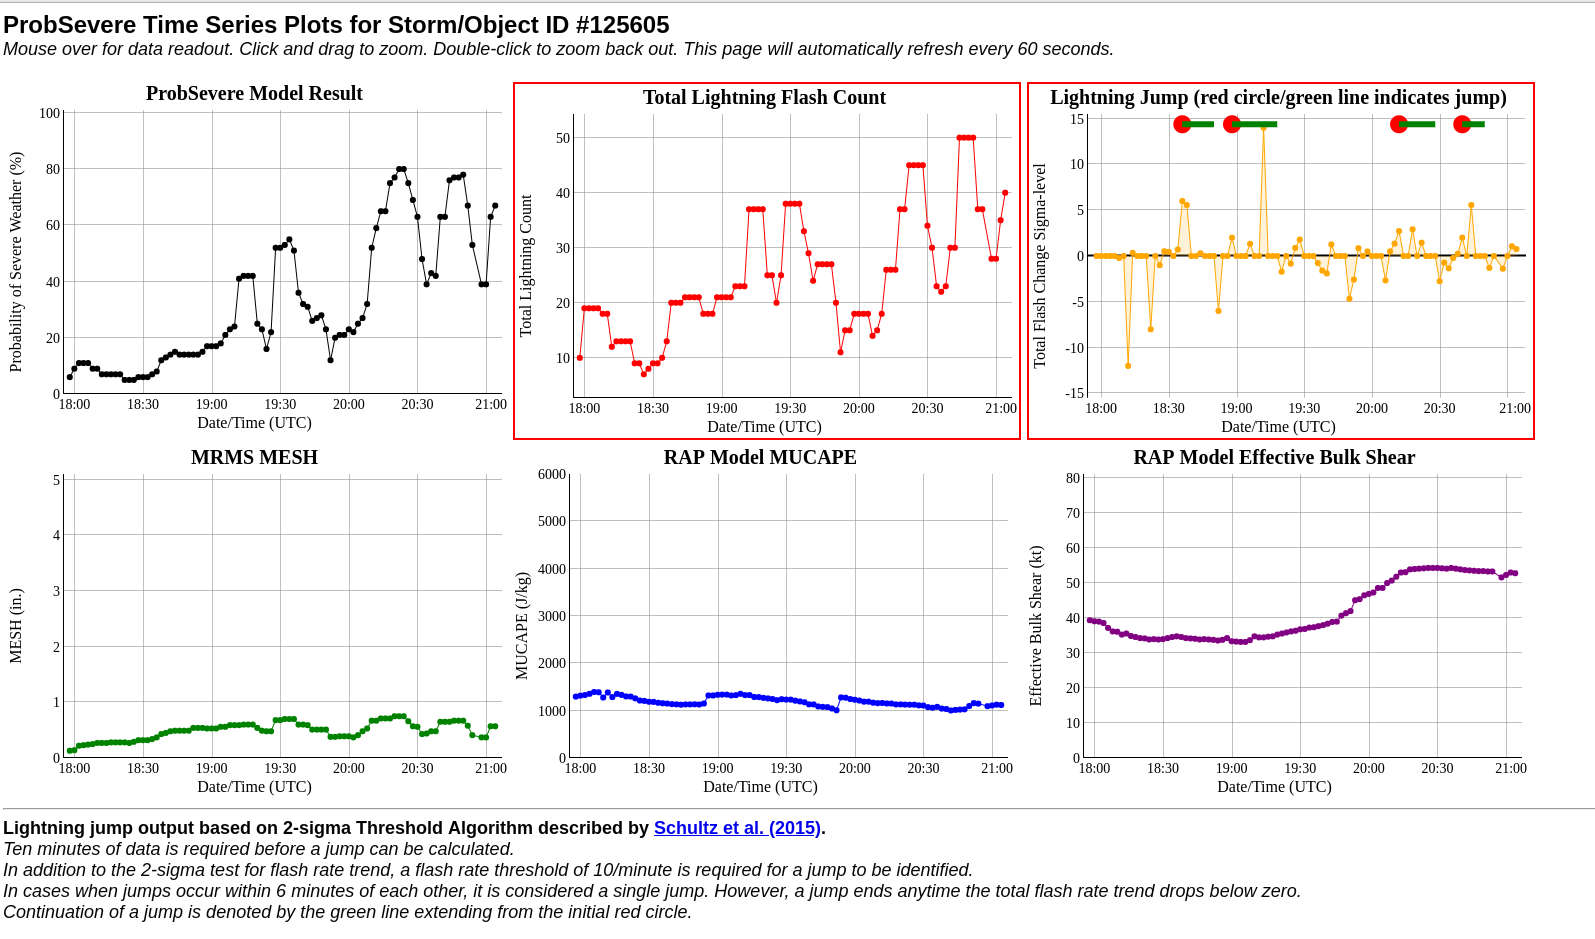
ProbSevere Trend Tracker
ProbSevere has been very useful over the years. One desirable feature would be to have a “trend tracker” see the example from WFO MPX. It sounds like work is being done on this endeavor?
Waiting on convection – diagnosis and investigation of products
Corpus Christi —
In investigating the environment we’ve deemed the convection to be more or less dependent on synoptic forcing via the cold front dropping southeast.
A
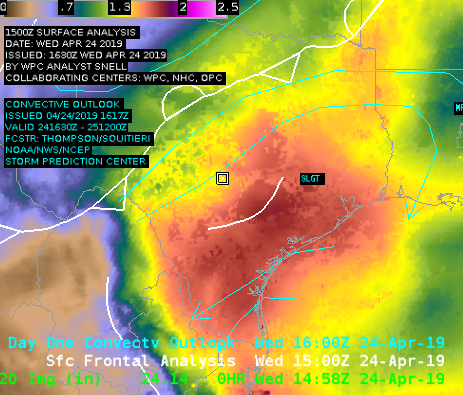
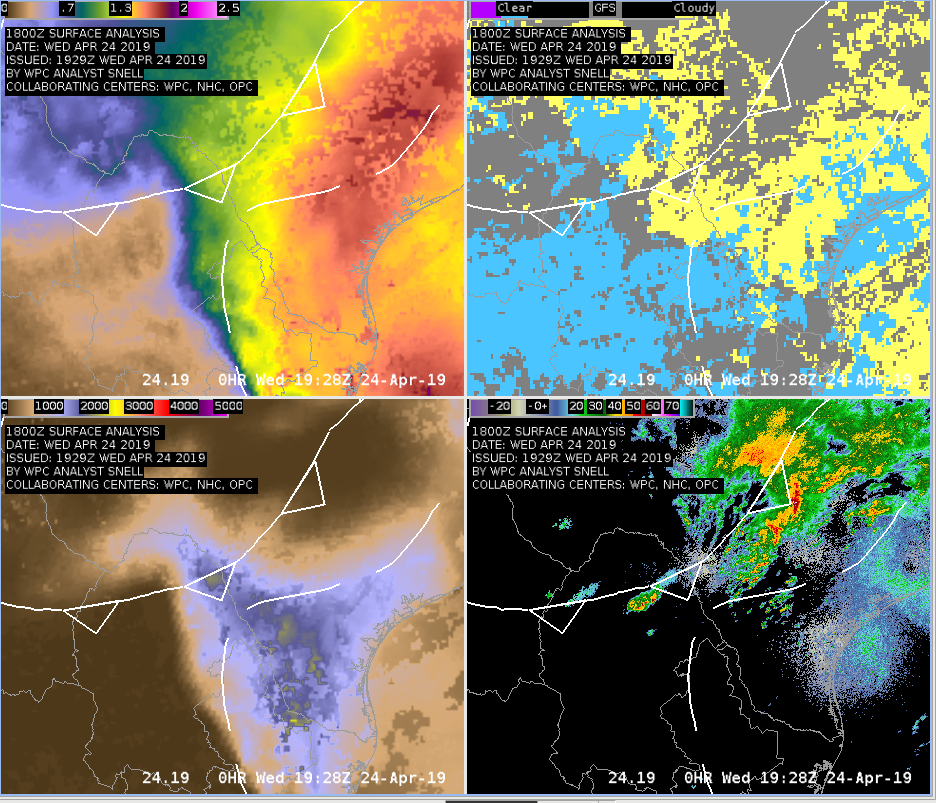
In A, plotted is Total Precipitable Water along with SPC Convective Outlook and analyzed fronts. A couple of things can be noted: TPW is very high under the Slight Risk, and it is displayed very nicely with good resolution contained within the gradient. This is a good example without going into too much detail about how our environment is primed for severe weather. However, NUCAPS Gridded Data has not come into our area as of 20z. This makes it hard to test the product and how it captures the boundary layer.
Now, we wait.
B
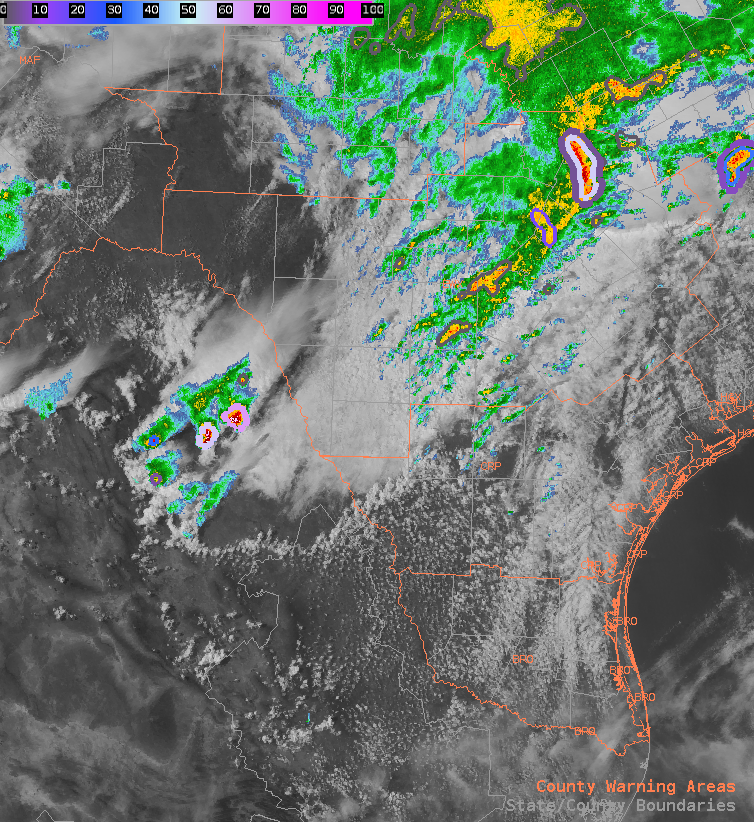
As we wait for the cold front to drop SE, our attention is focused on convection happening in NE Mexico (pictured in B). These cells popped up right along the CAPE boundary between values of 300 j/kg to 1500 j/kg.
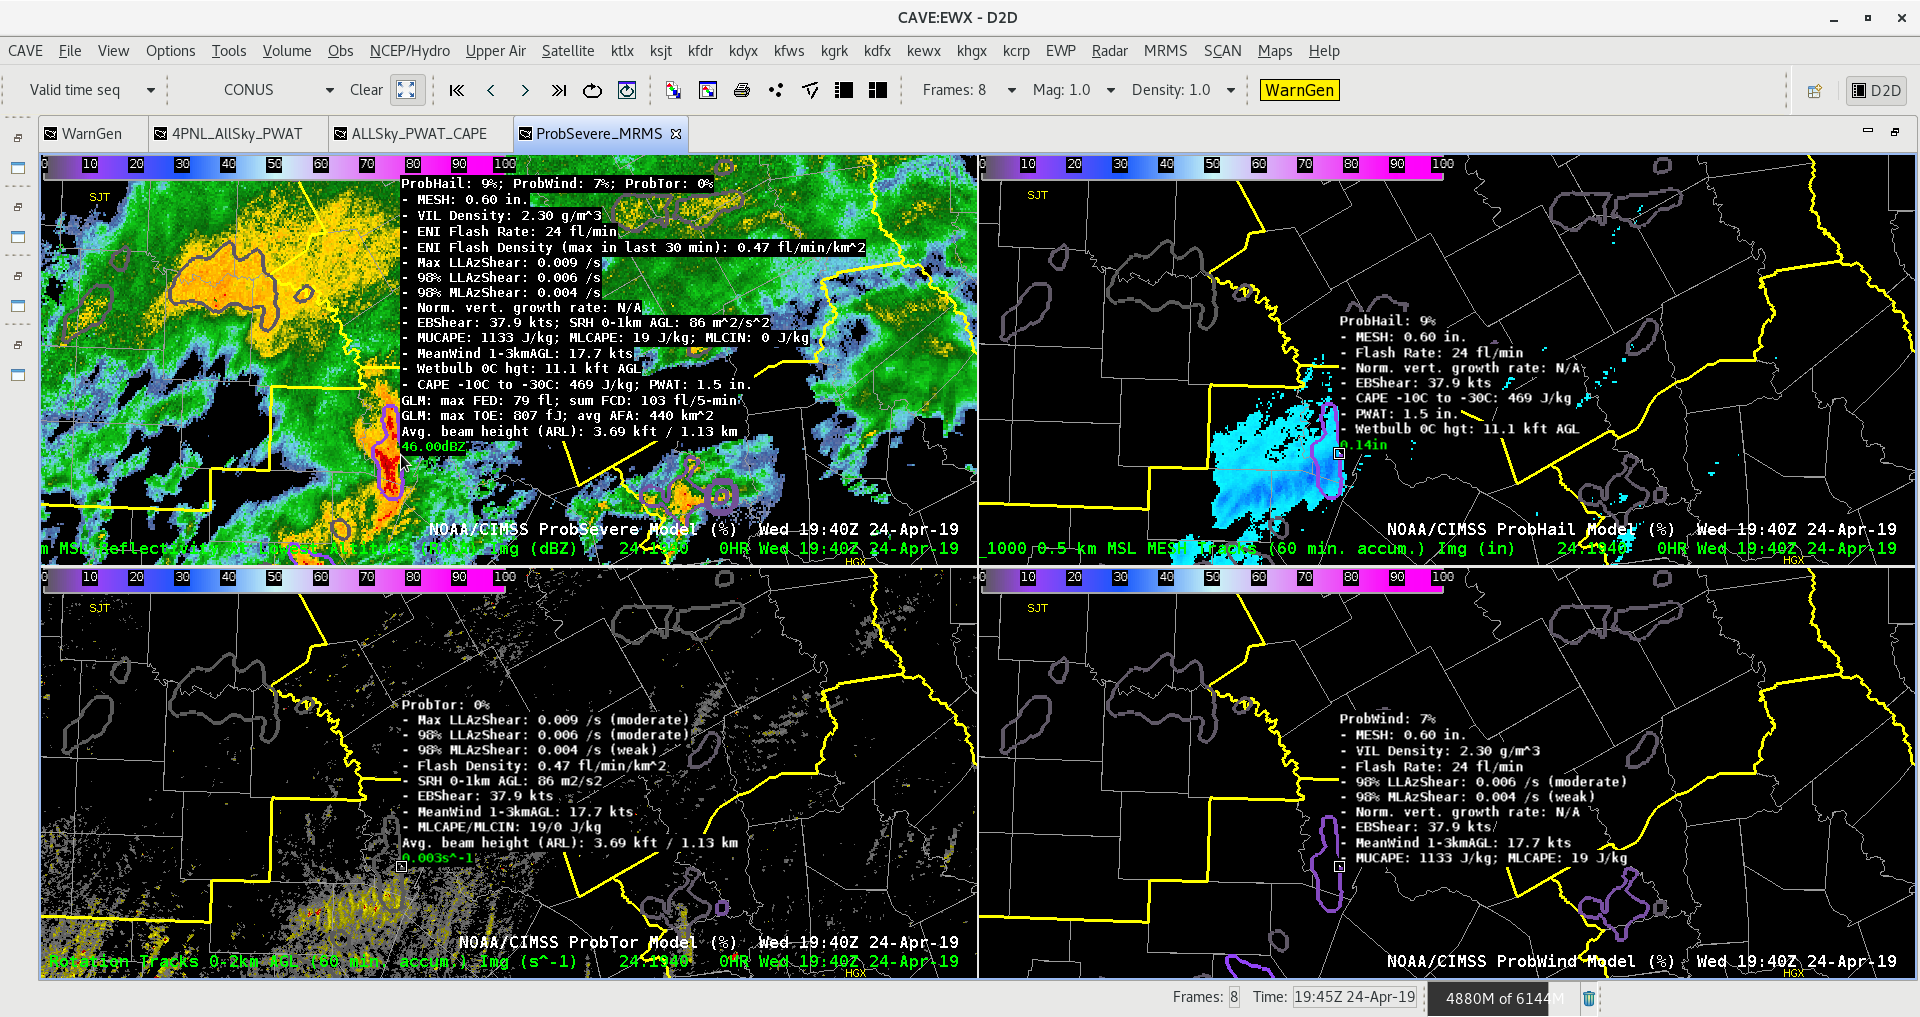
C
As can be seen in C, the GLM has indicated these storms contain lightning, thus they are intensifying in nature. We will now be monitoring the hail threat.
-lakeeffect
All-Sky Gradients & New Storm Development
Today was a great example for how the improved resolution from All-Sky LAP allowed us to hone in on exactly where new storm development will occur. Convection across Mexico developed where the front sagged south along the moisture/CAPE gradient. While in this case the CIRA Merged TPW showed the same gradient, the resolution was still better with All-Sky. Baseline blended TPW as well as satellite derived TPW/CAPE were useless due to either being overly smoothed, or not displaying in cloudy areas. Great diagnostic tool.
— FLGatorDon
Picking out the Little Circulations within the Bigger Lines
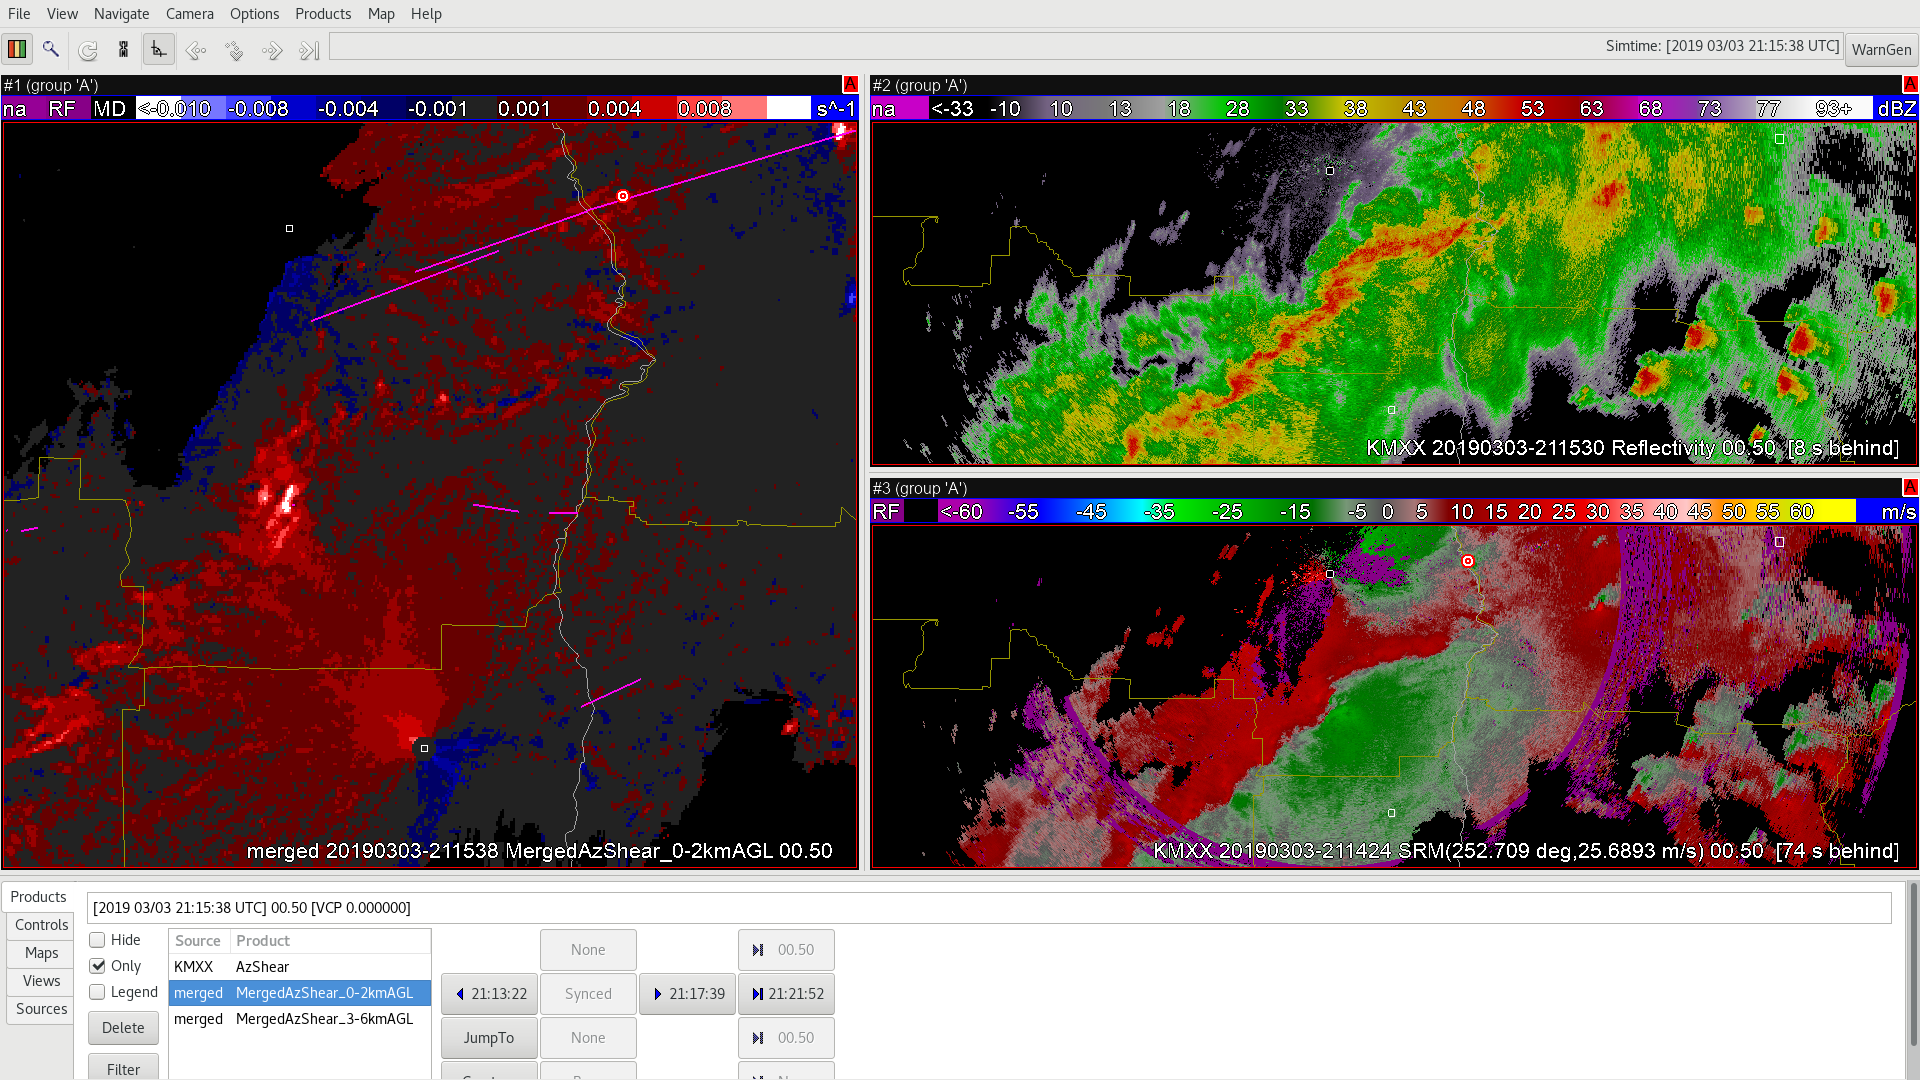
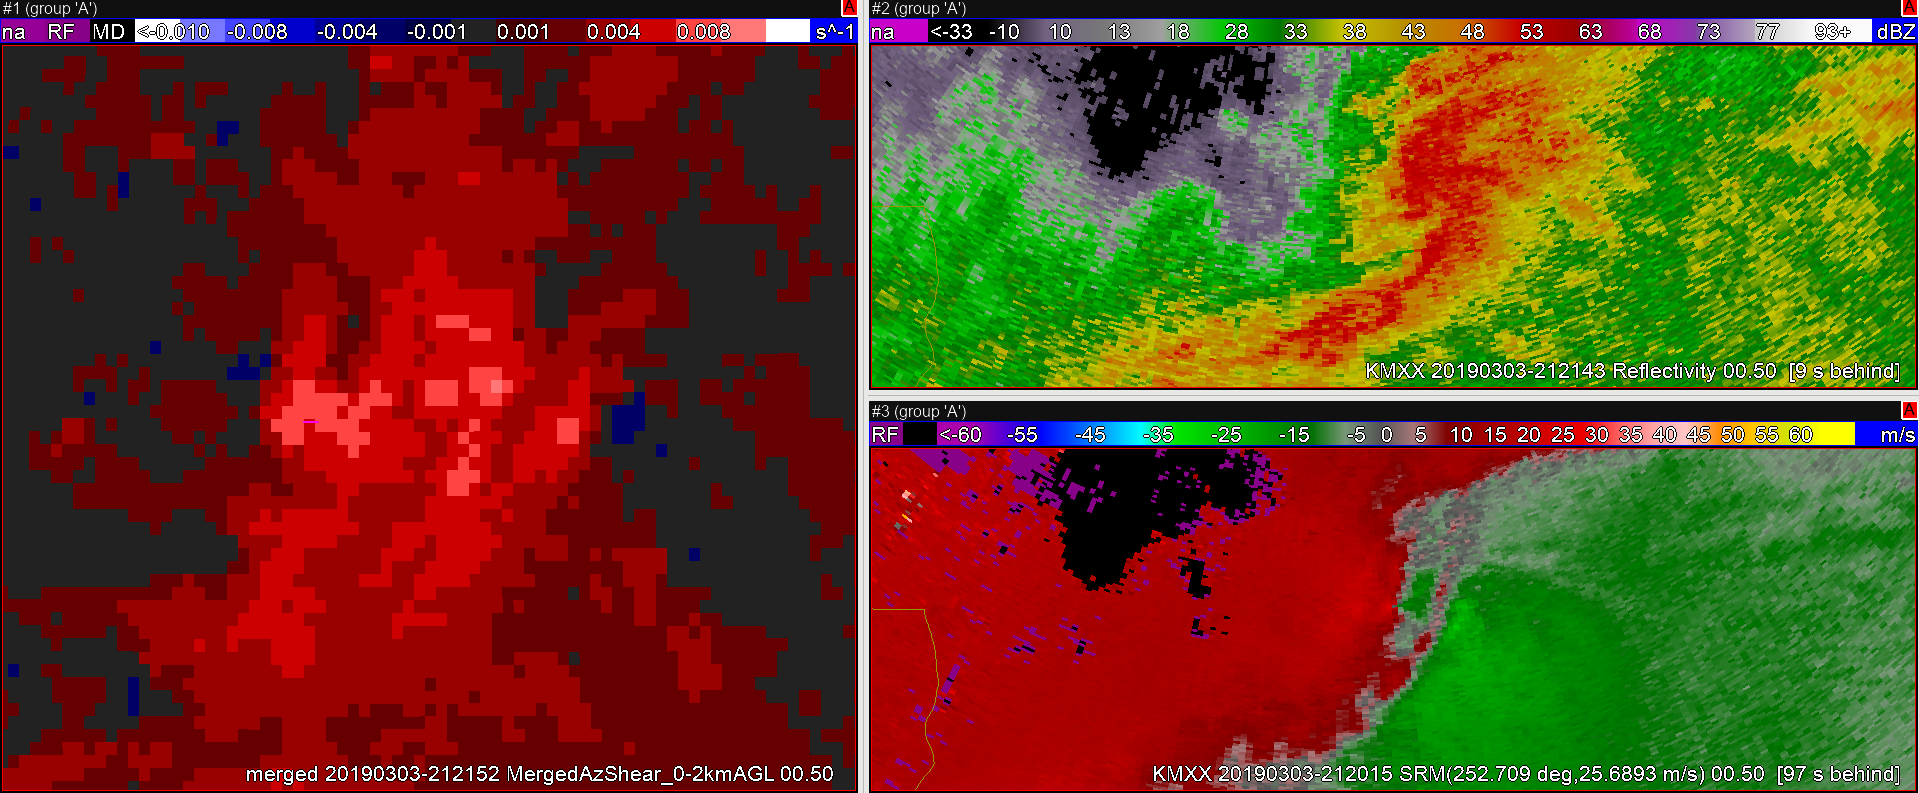
Zoomed out from the single radar (KMXX) in this case there is a lot of convergence going on along the line of thunderstorms but in this view you might not notice that a small circulation has formed in the velocity data. There is no obvious reflectivity signature but there is a local max in the AzShear Data – in this cased the Merged AzShear 0-2km AGL data. Lets investigate that further. 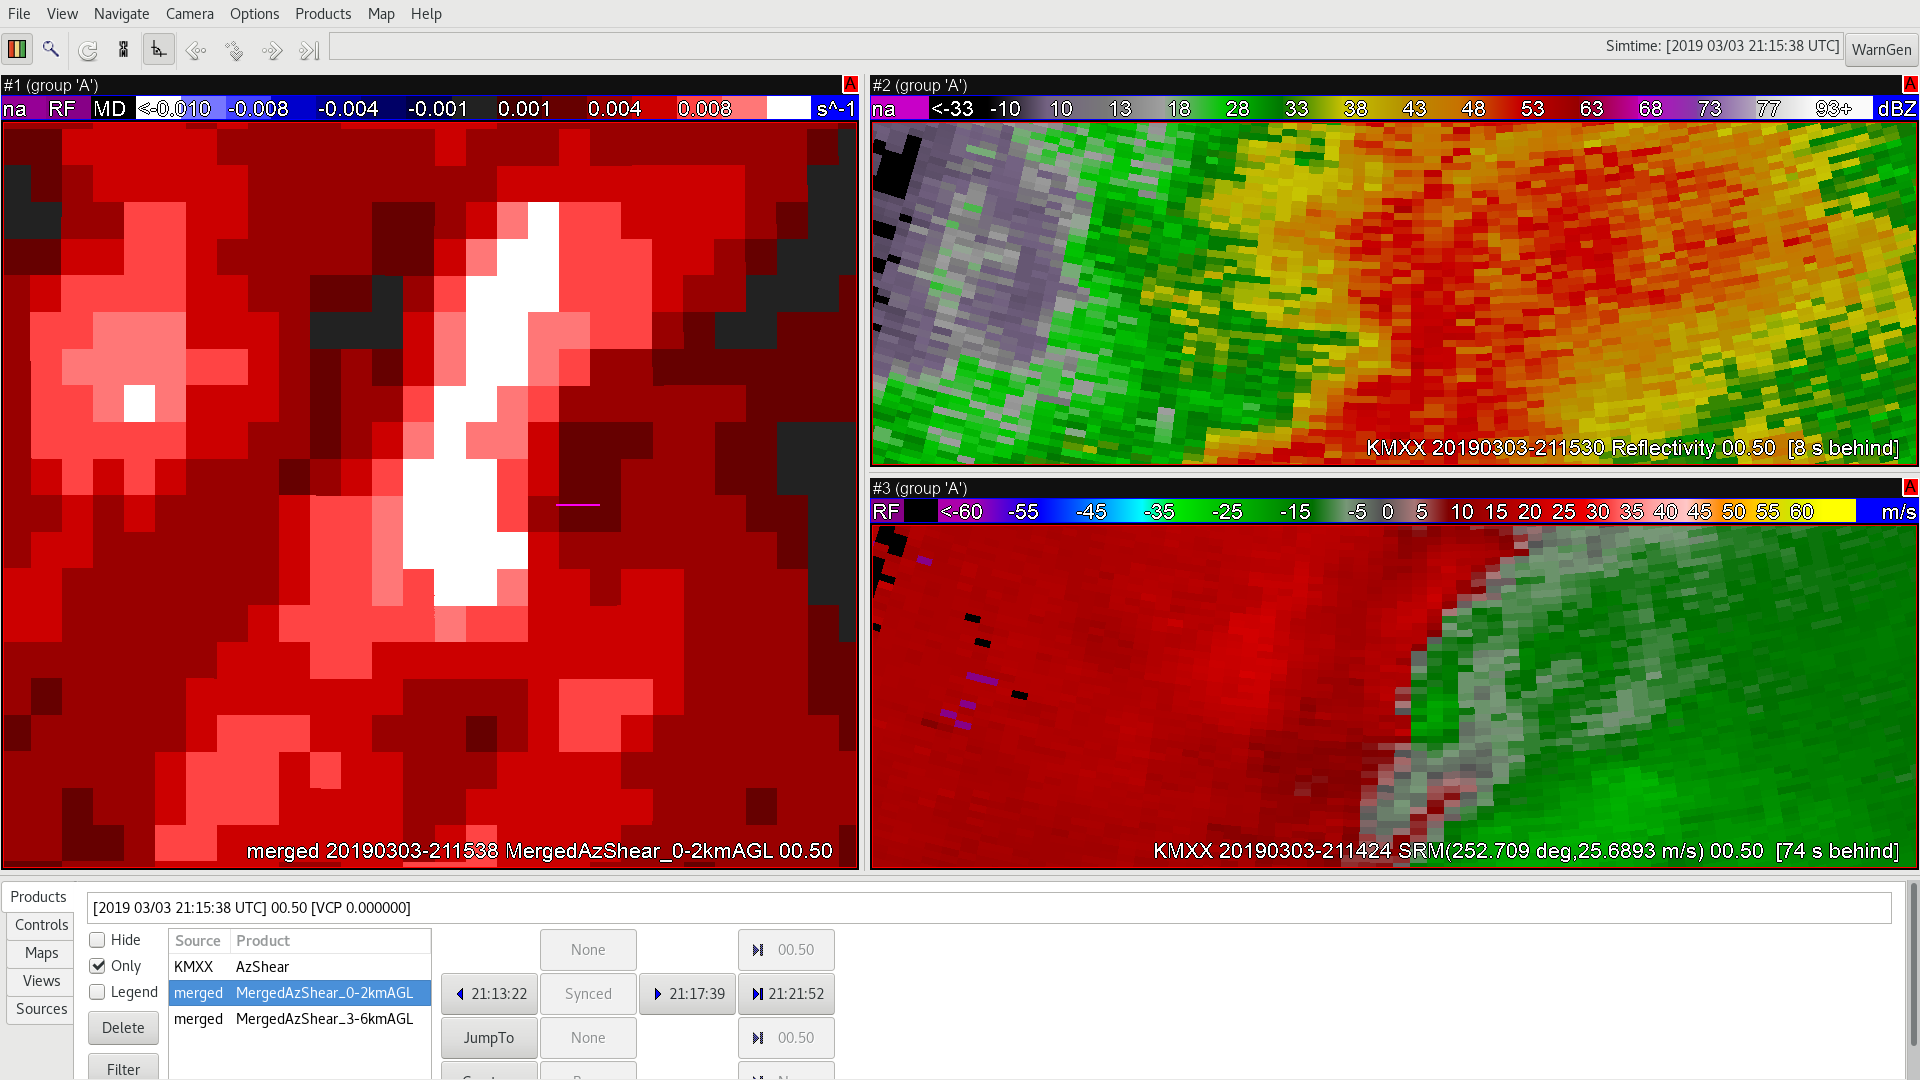
Zooming into the Merged Maxima you can now see a clear couplet in the SRM velocity data. And the pink tornado track line does confirm a tornado formed at this point. This is an example where on a broad scale the Merged Product (and the single radar as well) provided some Situational Awareness to a tornado that was not visible on the single KMXX velocity very readily.
Based on a rough guestimate a warning off of the Merged AzShear data would have given an additional 2-4 minute lead time to when the tornado formed in this case. An added bonus is that the Merged AzShear product decreased in intensity as the tornado dissipated just a few minutes later (see below). Going later in time the Merged AzShear does increase again, but the KMXX velocity couple remains rather diffuse and broad. The circulation does go onto later produce a tornado so the Merged AzShear product is at least indicating this is an area to keep monitoring. It is possible other local radars like KEOX, just to the south of this storm would have a better view of the couplet/storm.
-Alexander T.
AzShear Highlights Portions Of QLCS That Require Additional Attention
A wider scale view of this QLCS reveals a messy picture with several kinks and curves in Z and V. AzShear helps me narrow my focus on the portions of the line that I anticipate to be ripe for mesovortex genesis. Sandor Clegane
AzShear False Alarm
In this example, AzShear has highlighted a supercell that fails to produce a tornado. I suspect the cell merging from the south had a lot to do with the failed tornadogenesis, but this signal on other storms for this case was indicative of a tornado. Sandor Clegane