Long Flash via GLM in the Anvil / Stratiform Region

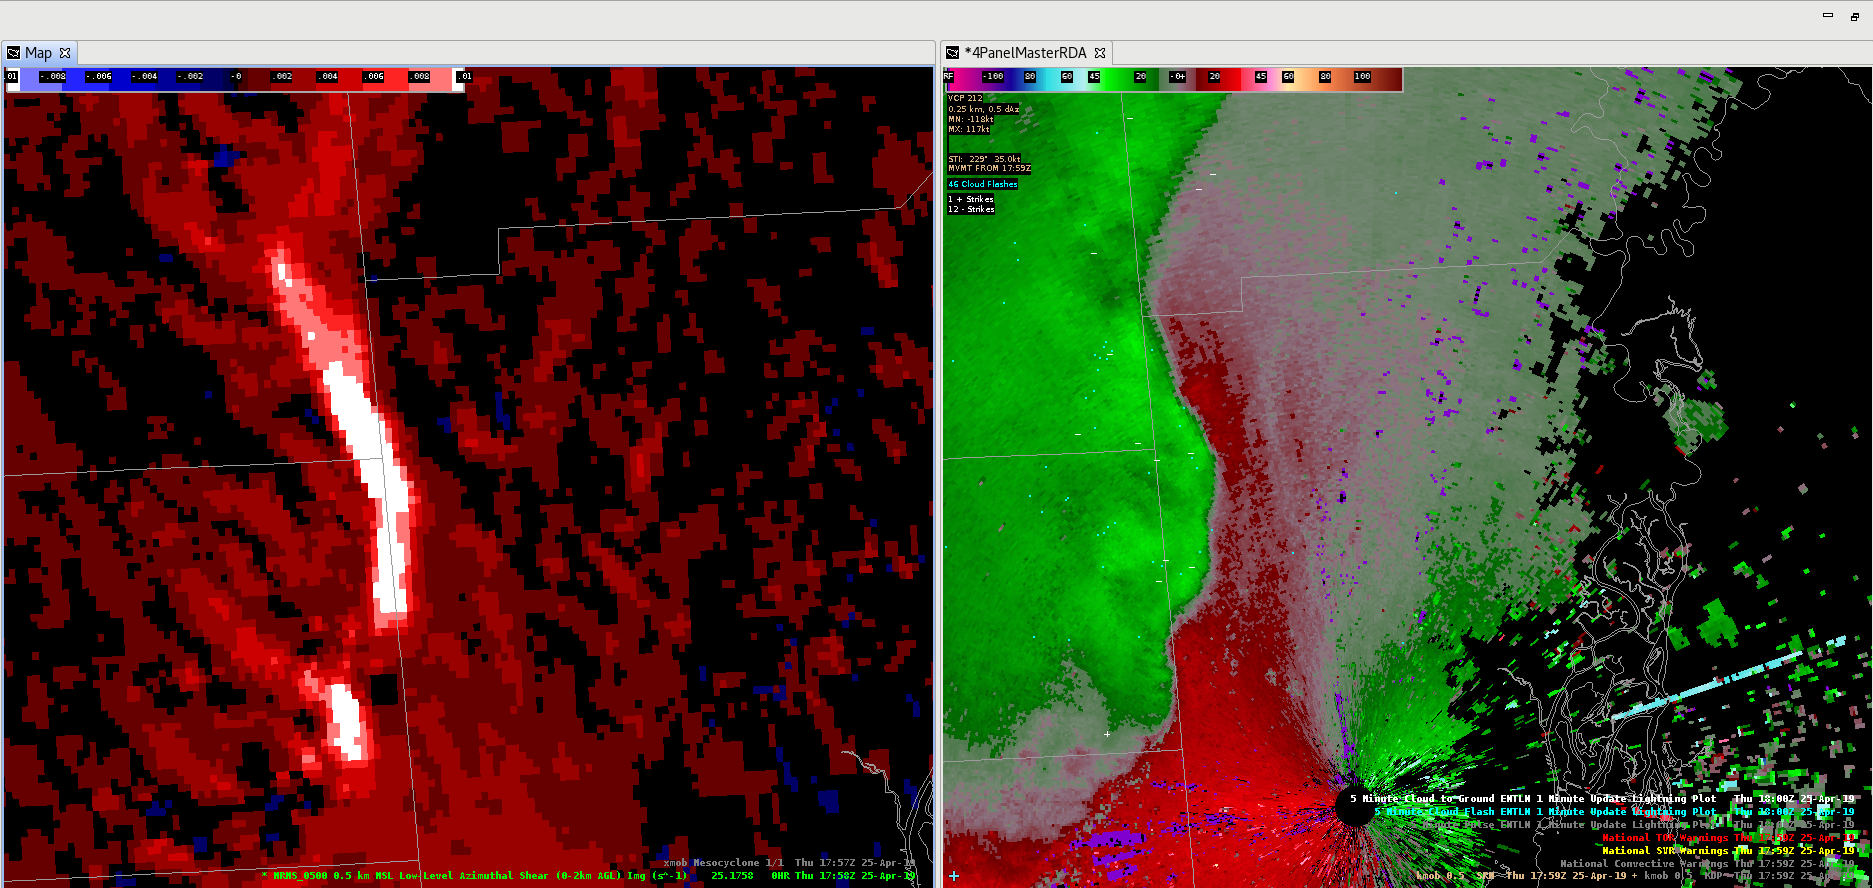
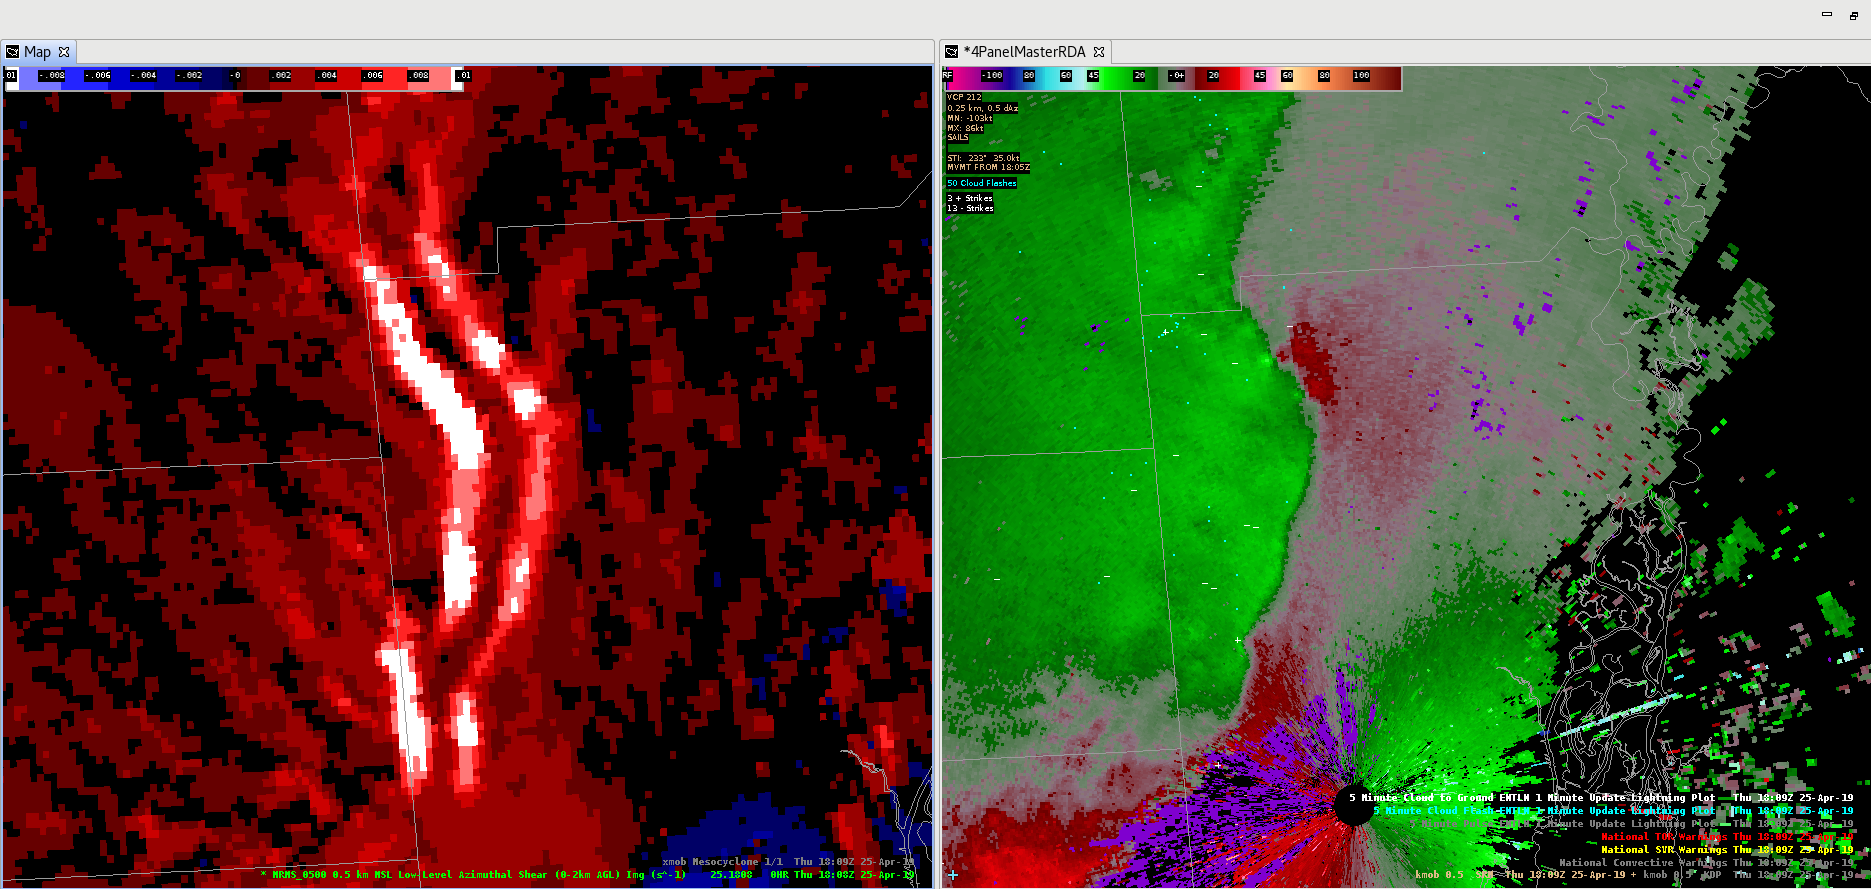
GLM does a good job at capturing large flashes that appear in the stratiform region behind lines of storms. In this case looking at the Total Optical Energy for 5 minutes with 1 minute updates you can see the large flash show up (the yellows and the whites). Reflectivity from KMOB and Visible satellite are layers under the TOE data.

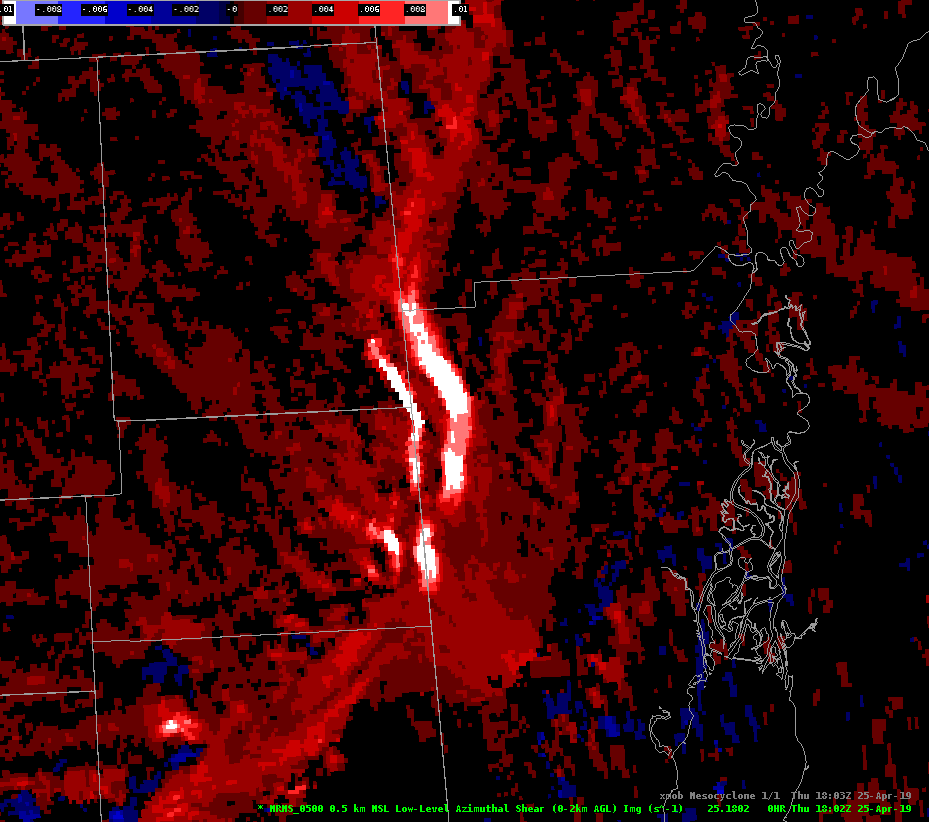
This large flash has Minimum Flash Area values between 1100-1700 km^2 with the Average Flash Area anywhere between 2700-3600 km^2. This is a large flash that extends back into the stratiform region (the Anvil) of the cumulonimbus clouds. You can see the lighter precipitation on the RALA (Reflectivity at Lowest Altitude) product below. The darker blocky outlined area is the Average Flash Size with other variables in the 4 panel.

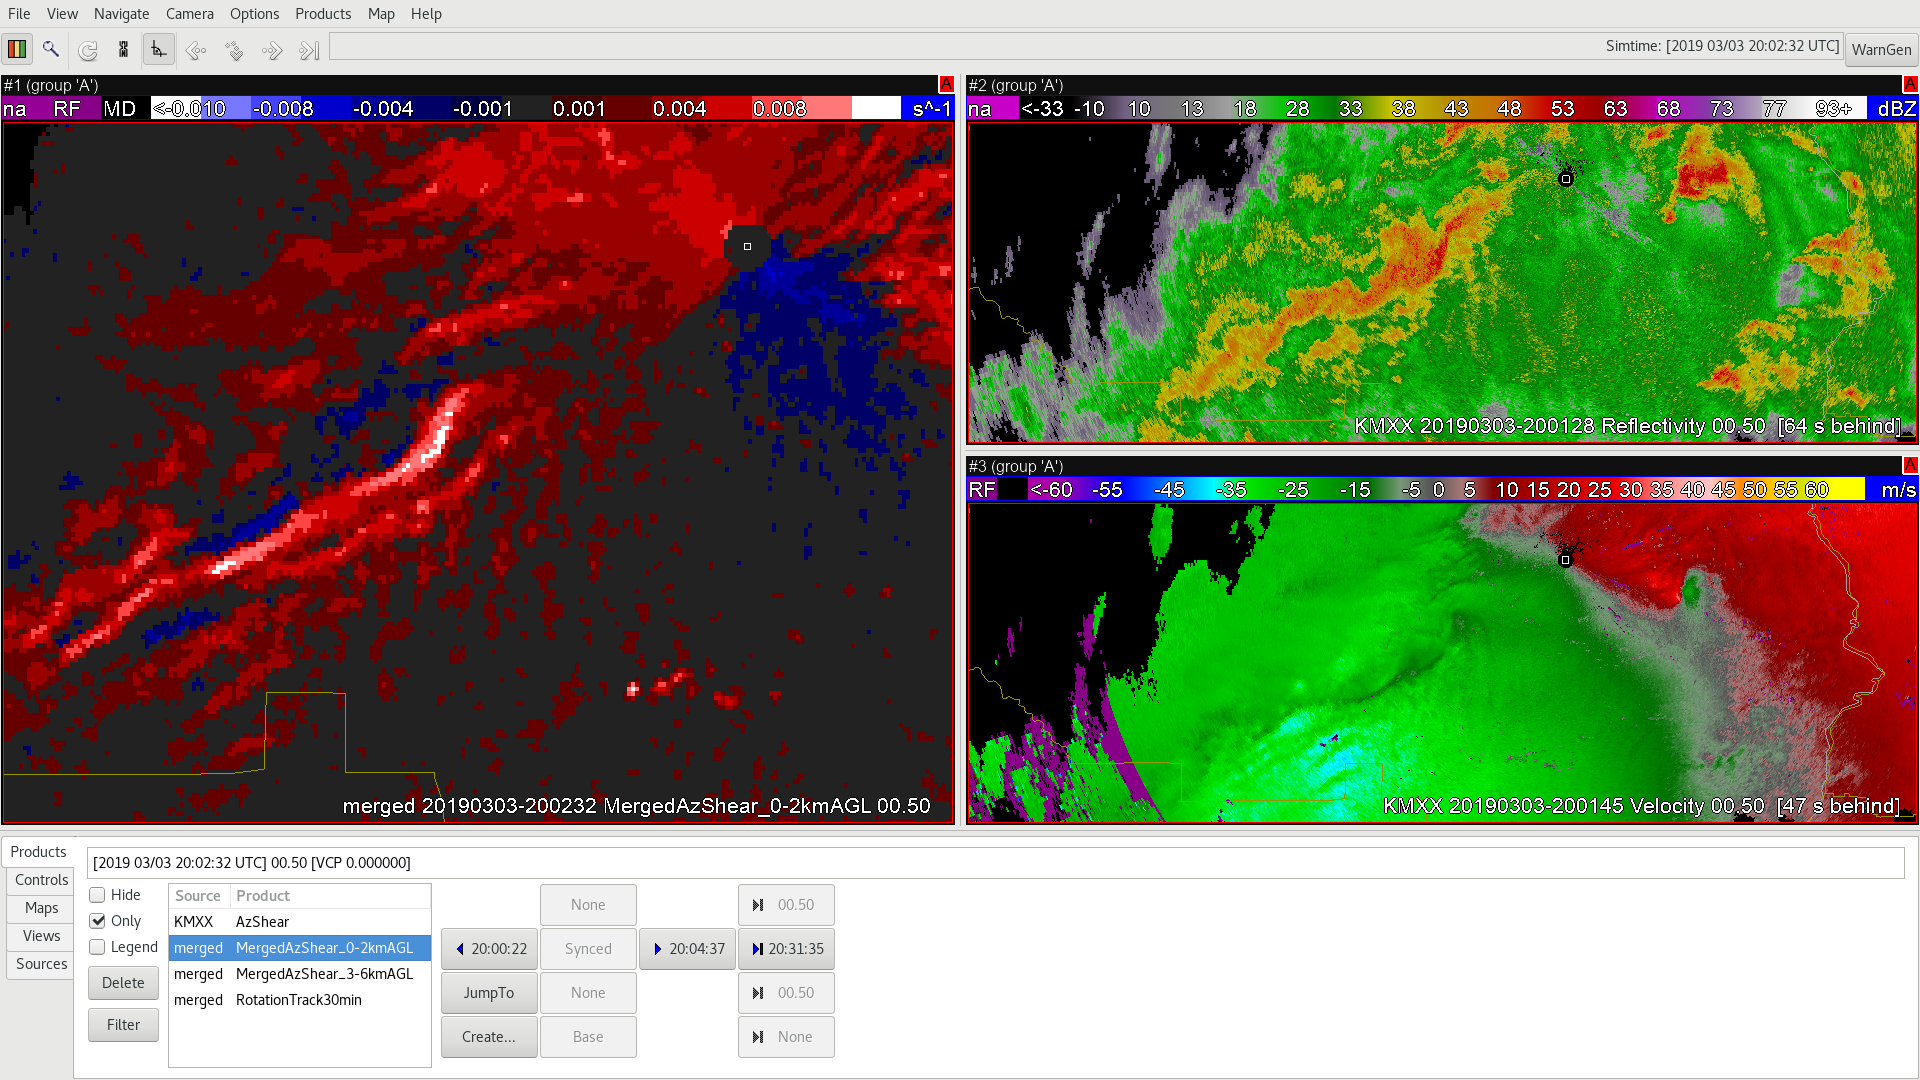
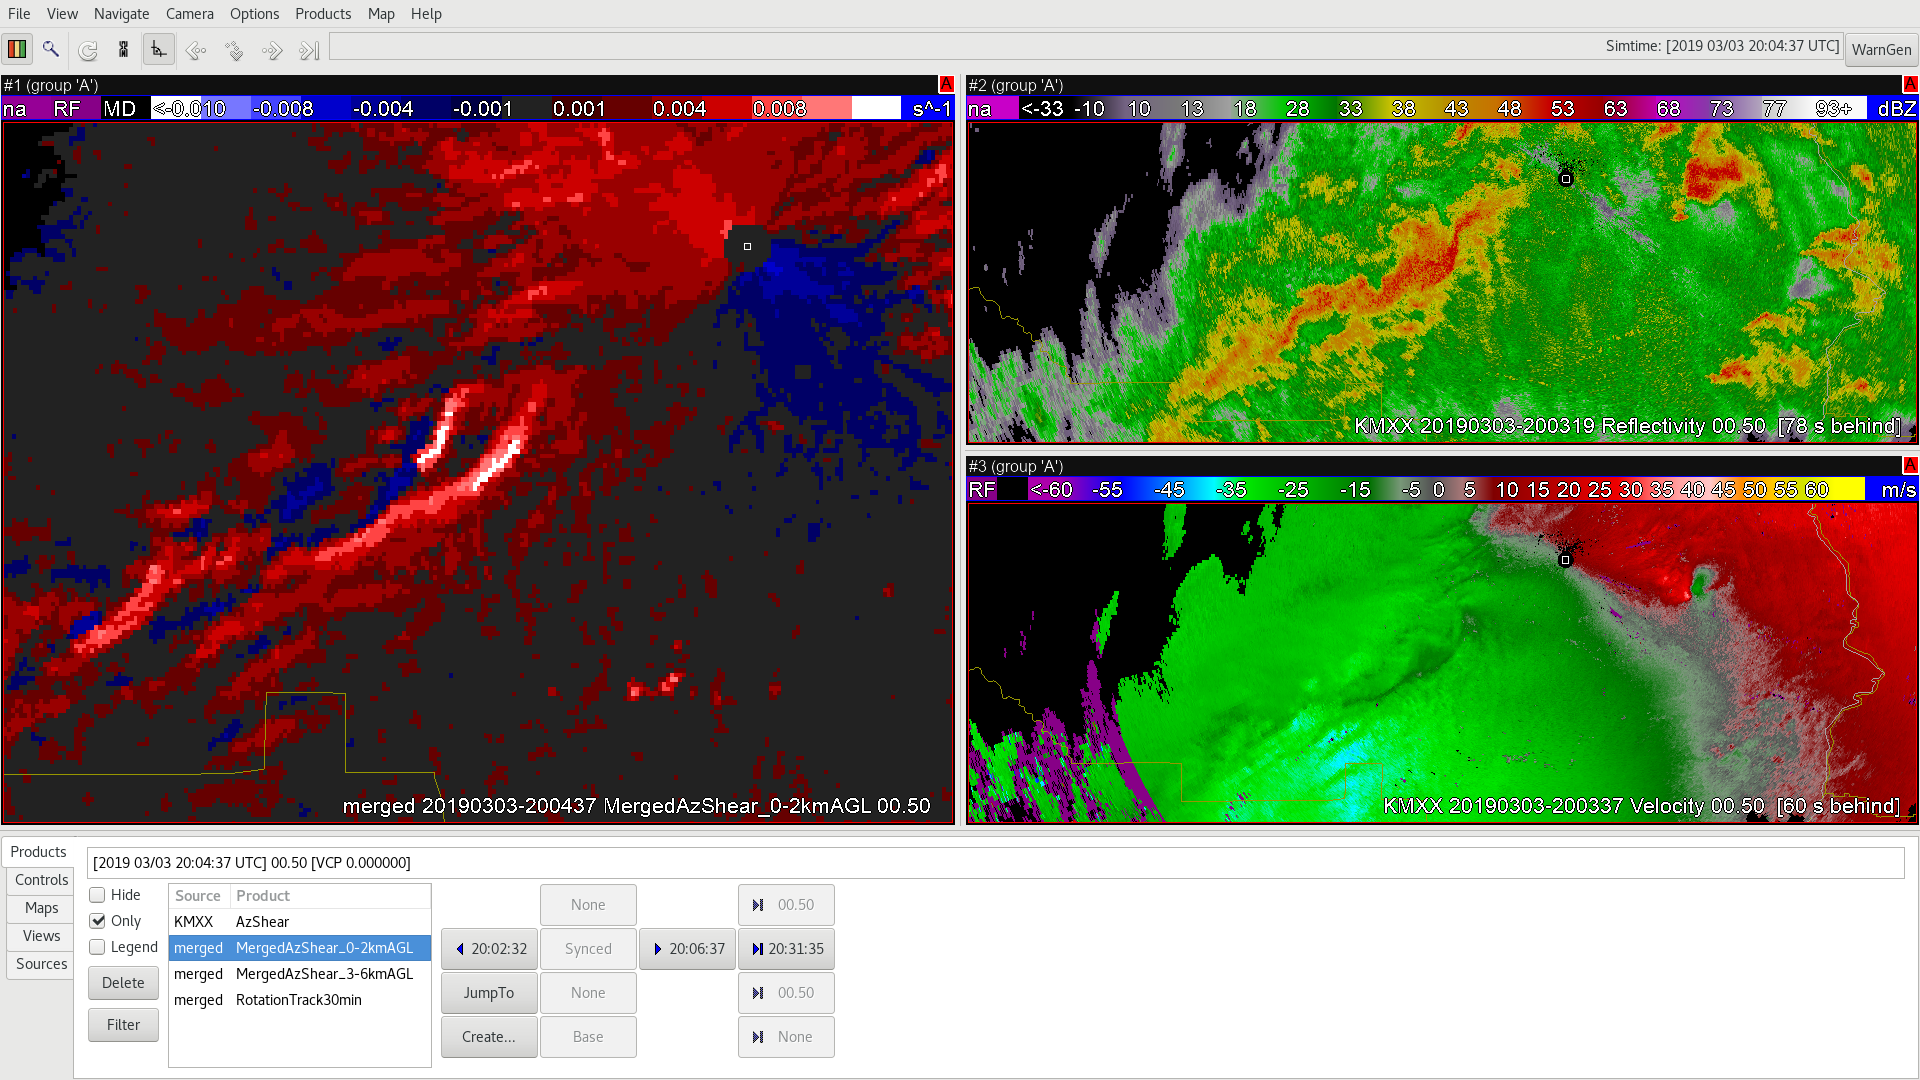
One important operator note is to be careful what you time match with the GLM lightning data. In this case another forecaster had time matched with the 1 minute meso-sector of satellite and because of errors in that data the large anvil flash was skipped in the one minute GLM data. If the GLM data is the focus of your analysis always remember to time match with it and then use other data (like satellite or radar) on those time scales.

-Alexander T.

AzShear and storm mode

An example where mode can be inferred using AzShear products. In the first image, we’re dealing with a nice linear segment without any ‘concerning’ rotational features.

Shortly after, the AzShear product clearly highlights threat areas for QLCS tornadic development in at least two distinct locations.

Having this product up in an SA perspective, you’d be able to quickly tell when you need to start being concerned with a structure change in the line.

Merged AzShear for Strength Trends

An example where AzShear data can show storm trends in one image without looping. As SAILS cuts come in you’re able to view rotational strength trends before the entire image is replaced by the next volume scan. Although this image is looping you can see the times when sails cuts would be overlain on one image.

THE 3 MARCH 2019 CASE FOR AZSHEAR – #3

For this embedded tornado, it wasn’t as obvious the circulation that was developing as compared to the supercell from the previous post. It starts out as a kink in the line, which definitely was something that grabbed my attention nonetheless. From there, you can clearly see the evolution of the circulation as it tightens. Would it provide me with additional lead time in a warning? It’s possible by maybe a scan or two, but would like to see more cases using this product first before making that determination.

~Gritty

Merged 3-6 AzShear picking up on mesocyclones early

A

In watching for convection knowing that later in the simulation there will be tornadoes produced in the FL Panhandle, I took a peak at each product prior to convection. Single radar AzShear is a little far away and doesn’t pick up on it but the merged products give an early indication that a supercell is developing and beginning to rotate. Knowing this storm will produce a tornado this is very helpful as a heads up.


— lakeeffect

THE 3 MARCH 2019 CASE FOR AZSHEAR – #2

Looking at the 0-2km merged AzShear product, my attention was drawn to the line stretching to the SW of the KMXX radar. While I see utility in using this product more for SA, the SAILS artifact of not having the images lined up properly could lead to false interrogations of what’s actually occurring. In this first image (below), the wind field is apparent. In the second image, it looks like the wind field has separated. In the last image, it’s very clear that a slice being merged into the product shows the wind field significantly separated.

~Gritty

The 3 March 2019 Case for AzShear

The single radar AzShear product made a rapidly developing tornado very apparent, forcing my attention to be pulled to it (first image, below). Additionally, it was very interesting to see the RFD so clearly (second image, below). However, as noted previously, I do have some reservations about the number of false alarms that it may be picking up, as seen in the last image (below). But, there is a lot of promise for this product to serve as an enhanced SA tool and/or increase confidence in the warning decision-making process.

~Gritty

Single Radar AzShear 3/03 Case

A

Seconds into this simulation it’s apparent that an embedded supercell is about to wreak havoc. It’s incredible how well you can examine the anatomy of the thunderstorm using the Single Radar AzShear product. It’s still apparent in the merged products that there’s an area of concern, but you can’t quiet examine the anatomy of the thunderstorm like you can in single radar.

B

In B, the merged 0-2km  it’s clear where we should be paying attention, but trying to diagnose the structure of or the maturity of the thunderstorm is much more difficult.


-lakeeffect