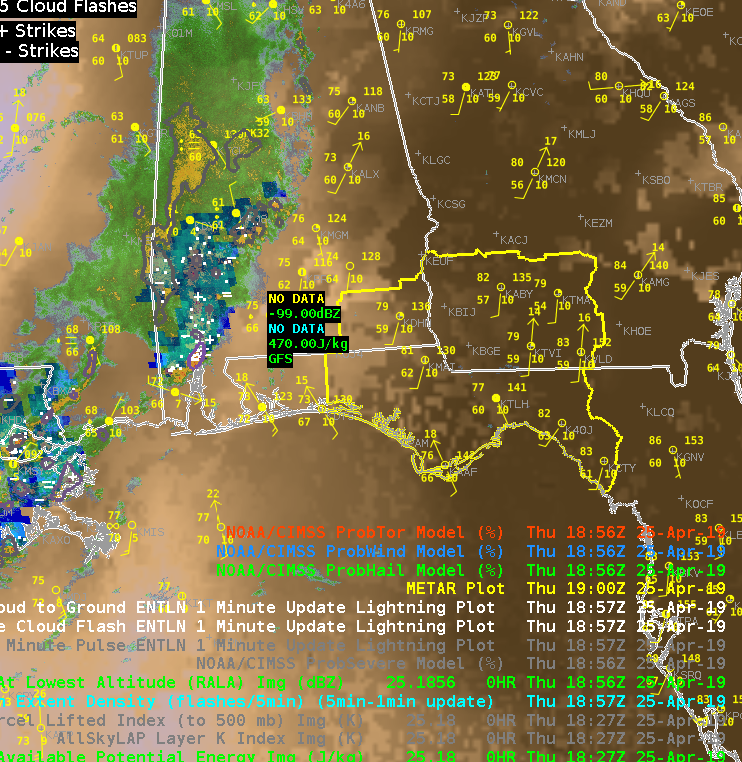
Did a quick check of the merged TPW and AllSky products and as previously advertised/anticipated, the convection has been riding right along the gradient of the higher instability, but there is some discrepancy as to whether it’s right in the heart of the higher PWATs or along the leading edge, depending on if you’re looking at the AllSky or TPW, respectively. Noticed quite a bit of a latency in the availability of these products (up to an hour), which wouldn’t be good in an operational setting. Compared the values of the TPW and AllSky PWAT with the RAP, and the AllSky matched up much closer to the RAP. However, with the amount of cloud cover in the region (for obvious reasons), the GFS is the predominant data type (basically a model-to-model comparison). Either way, the general idea/trend is helpful if serving as a mesoanalyst in an operational environment.
~Gritty
(CAPE)
(AllSky PWATs)
(Merged TPW)
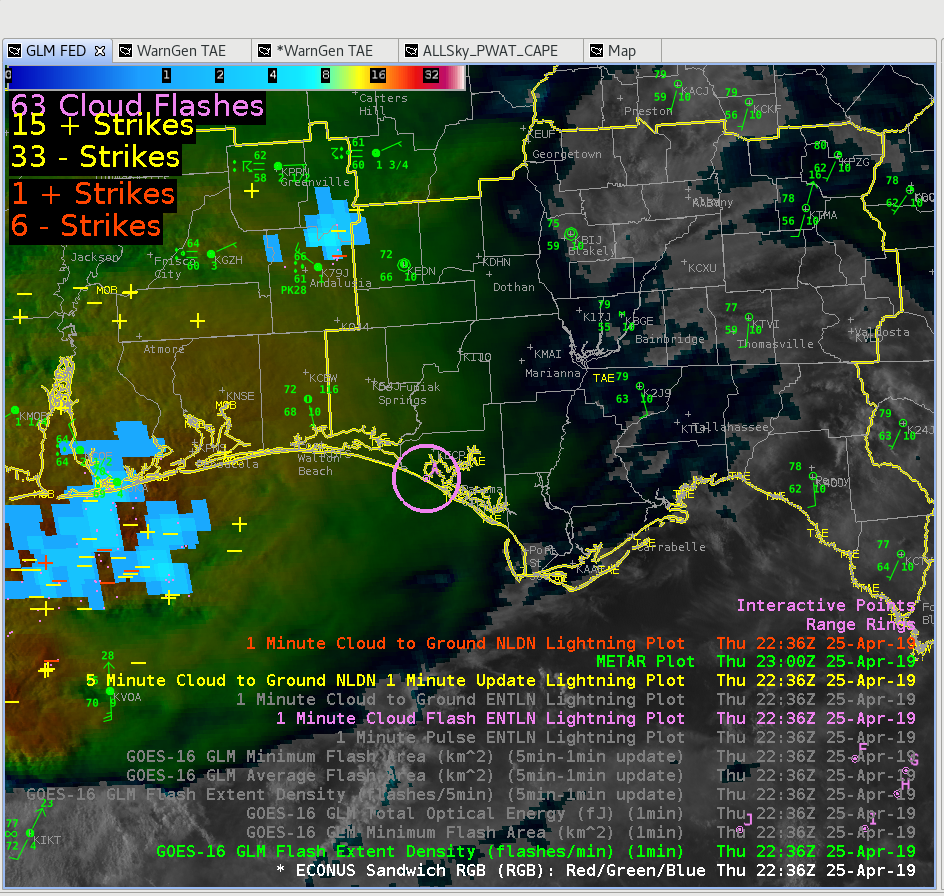
 The layered TPW product shows a tongue of moisture approaching the region. It looks like a line of towering cumulus developed over the Gulf of Mexico as this moisture interacted with the convergence line.
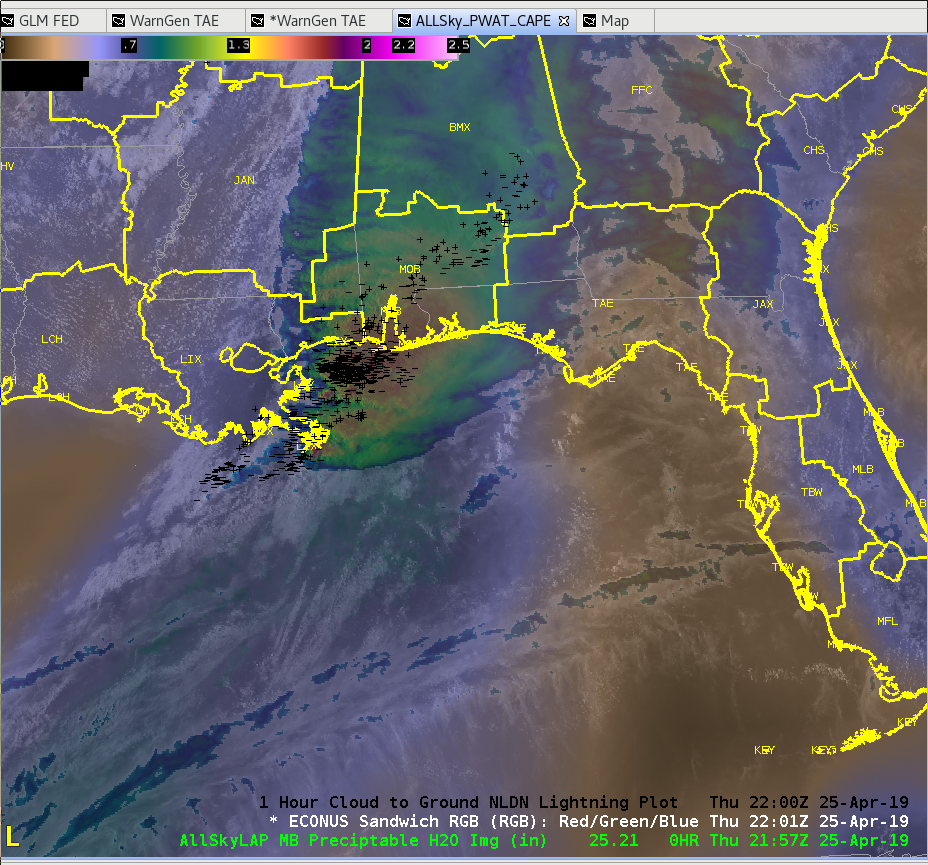 Sandor Clegane
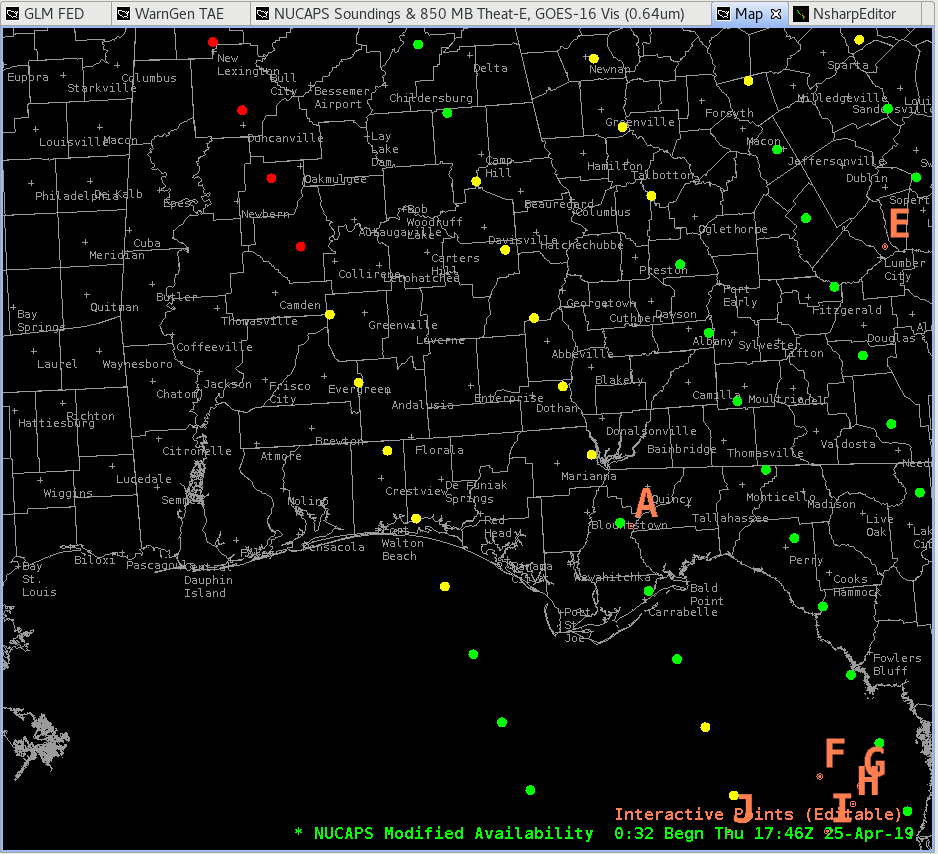
 An 8 hour loop shows how the instability has built and gives more confidence that instability will continue to build ahead of the storms to our west.
  We did feel that LAPS CAPE seemed a bit underdone given the intensity of the downstream of the convection, so we took a look at the latest NUCAPS retrievals. We examined the point in the extreme SE of our CWA.
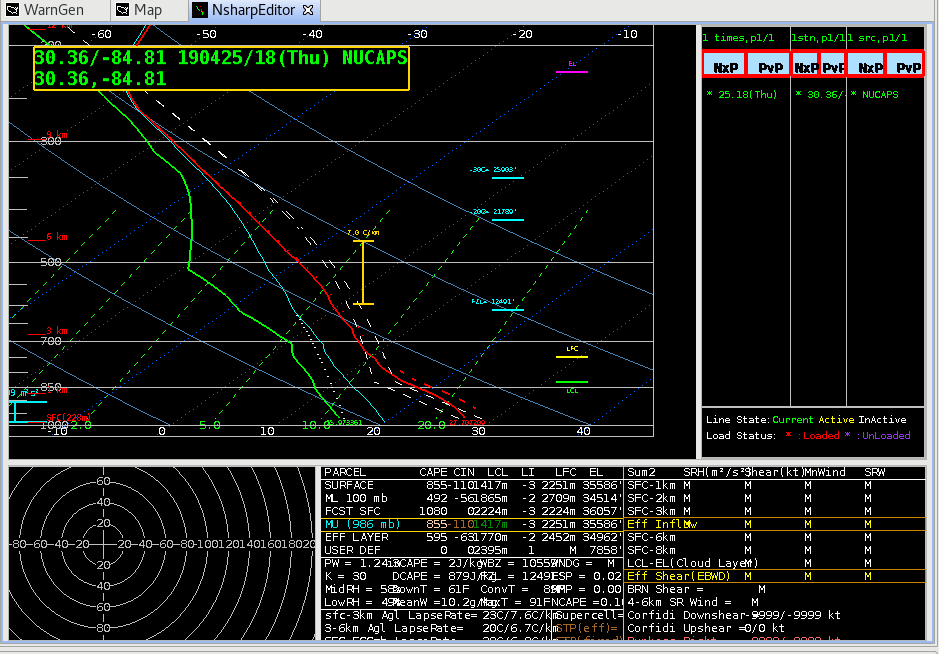
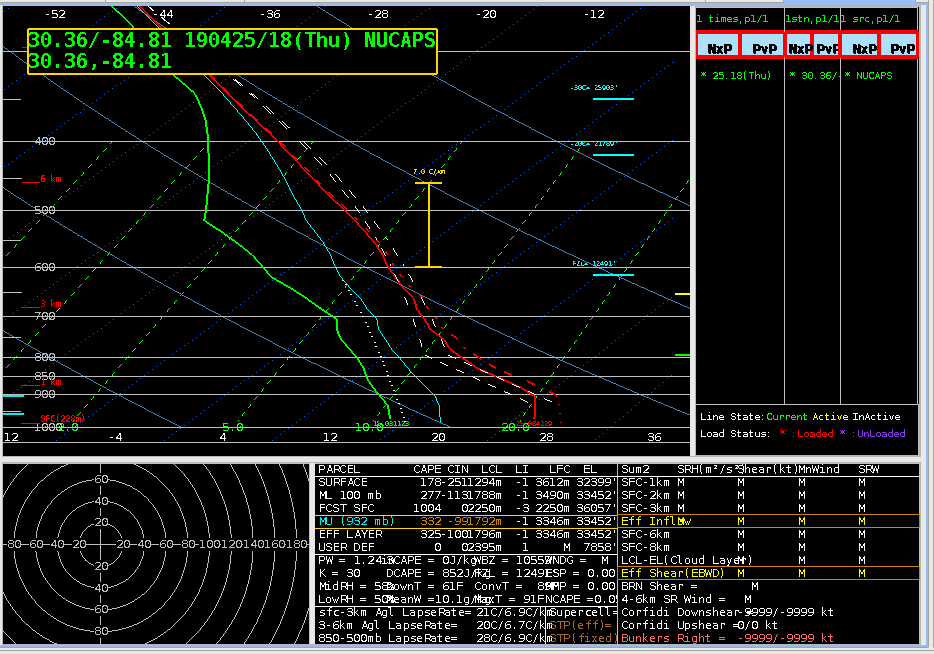
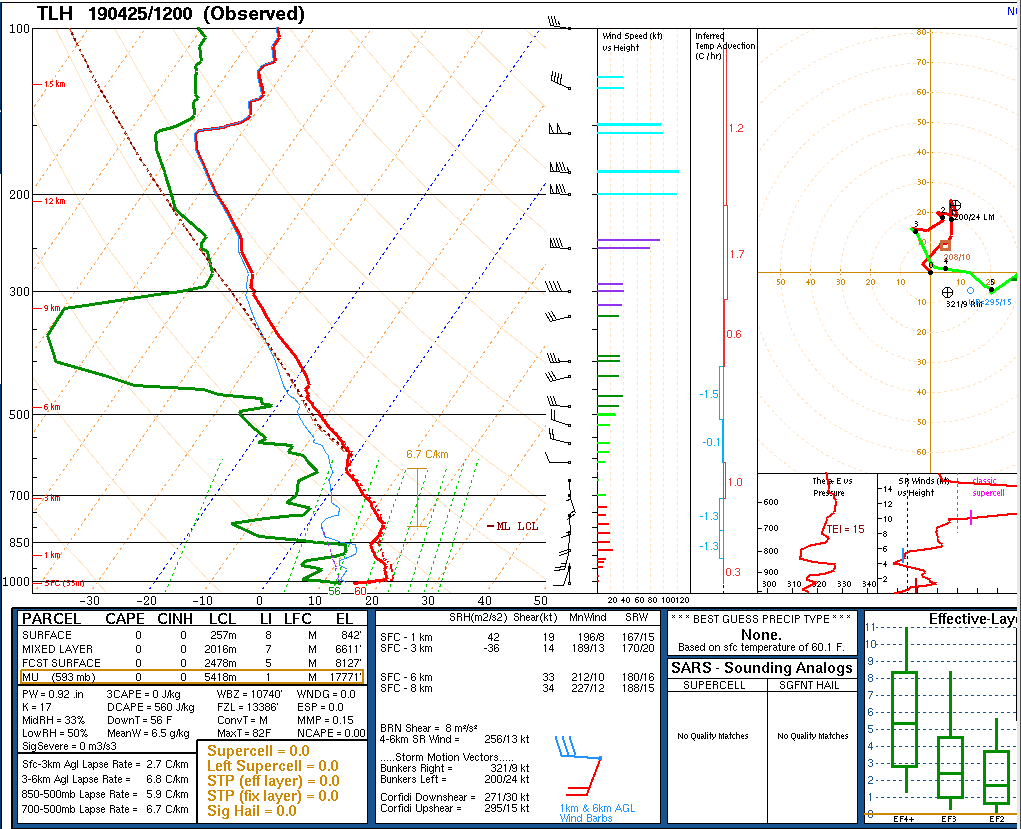
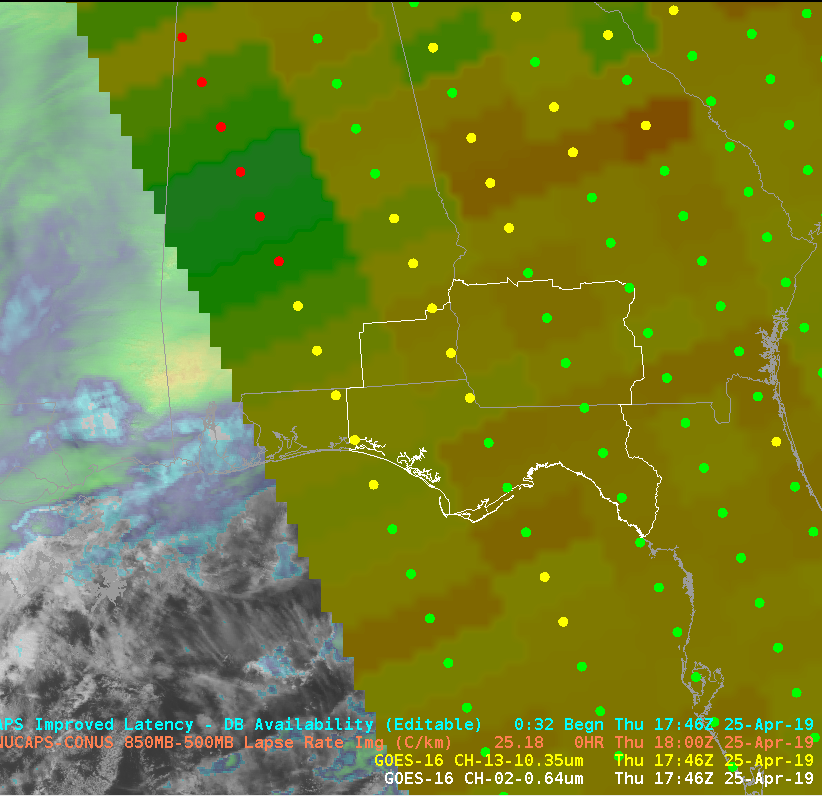 The boundary layer on the unadjusted sounding required some adjustment to match the nearest obs, but overall, seemed to capture the general profile well. I was initially skeptical about the warm nose just above 700mb, but a similar feature was evident on the 12z sounding from TAE. This feature may have an impact on storm intensity and potential hazards, and it would be particularly helpful to see how this feature changes over time.
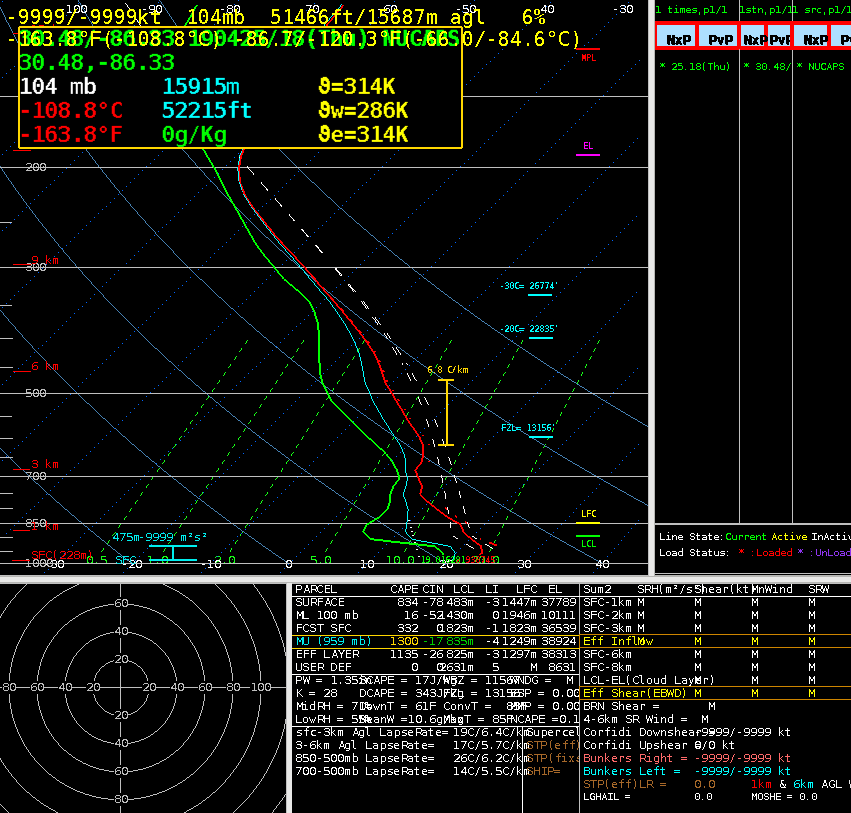
 Sandor Clegane