
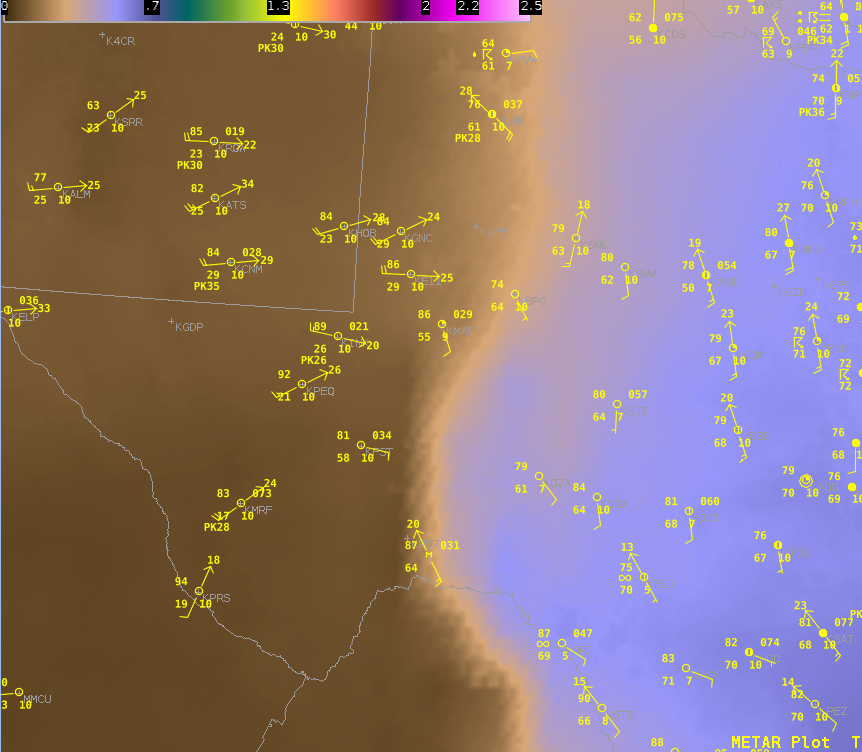
AllskyLaps900mb layer PW product does an excellent job in tracking evolution of dry line over west texas on 4/30/19 -Quik Twip
Official websites use .gov
A
.gov website belongs to an official government
organization in the United States.
Secure .gov websites use HTTPS
A
lock (
) or https:// means you’ve safely connected to
the .gov website. Share sensitive information only on official,
secure websites.

AllskyLaps900mb layer PW product does an excellent job in tracking evolution of dry line over west texas on 4/30/19 -Quik Twip
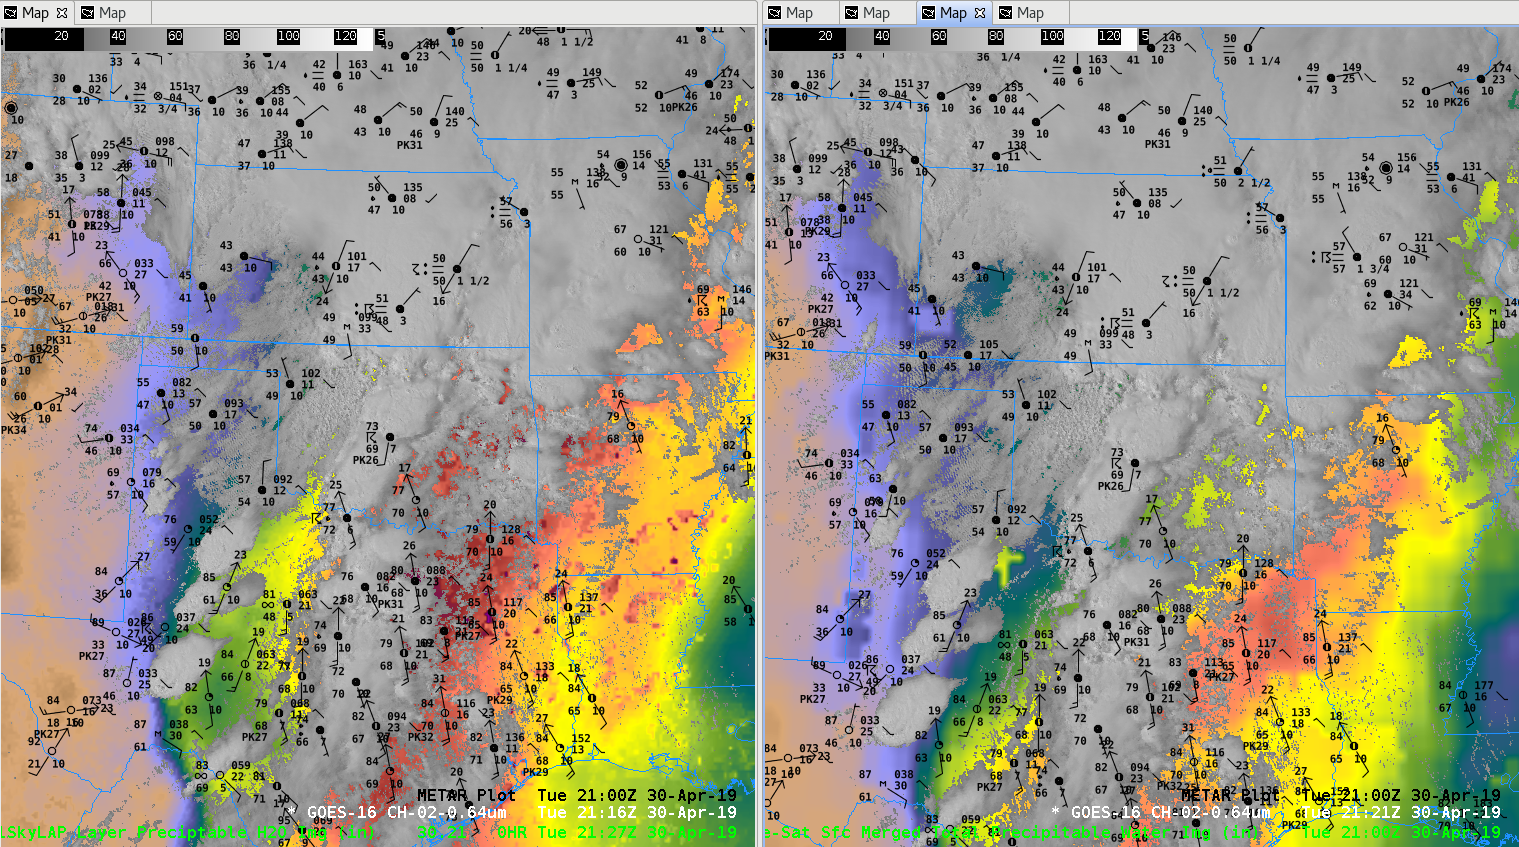
Figure A
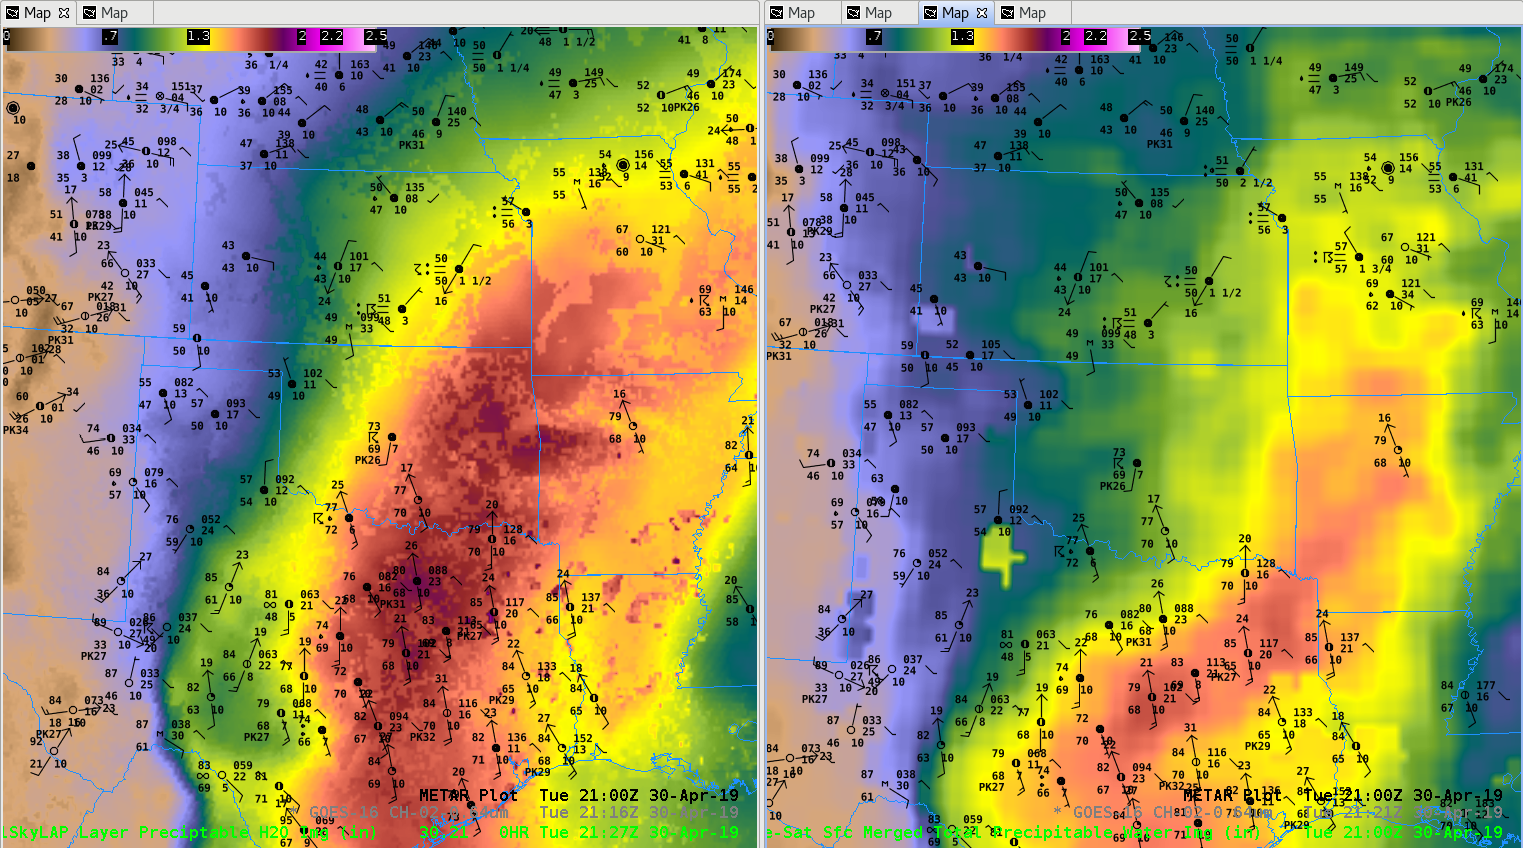
Figure B
All Sky Total Layer PW did a better job in Figure A with western gradient of moisture where convection developed along dry-line compared CIRA Merged Total PW. All Sky also seemed to better capture the moisture plume through central Oklahoma into southeast Kansas.
-Jake Johnson
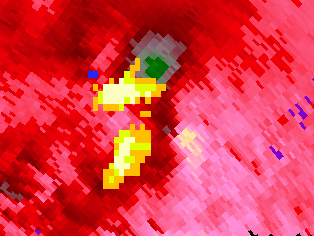
I’ve seen some great promise from the low level az shear this week so far. One thing that I do not like about the default product is that it has a lot of noise/extra info in it that tends to clutter up your screen. An idea that I had was to filter more of the noise by making a large portion of the scale transparent. Take a glance at the velocity field and see how it matches up with the AZ shear extremes.

Another advantage I could see with only displaying the “extremes” would be the ability to include velocity data underneath the image. This can be especially useful since the MRMS data is feeding the AZ Shear. Why? Well the velocity couplet you are examining is likely to progress a bit “faster” using the baseline radar data rather than MRMS, so they likely will be right next to each other.
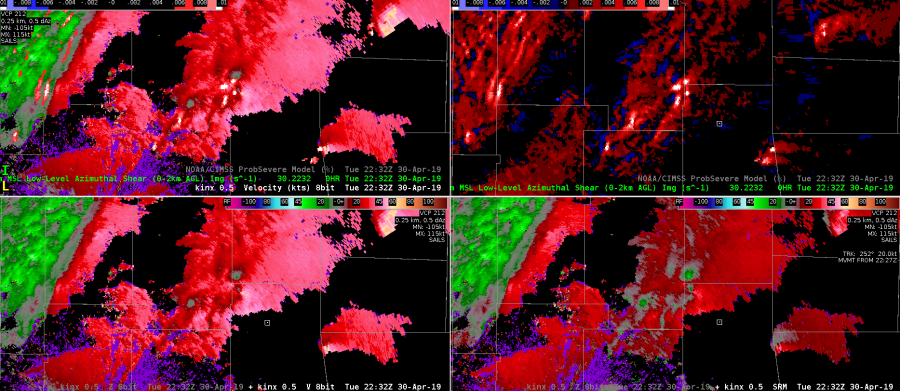
Other thoughts I have had going this route is possibly changing the “red” side of the color scale to something other than red so that it doesn’t match the color scale used by velocity data on radar. I did like a “yellow” scale as it did not largely conflict with the color scales expressed by the velocity data.
As a whole I think this product has some great potential at drawing your attention to portions of the storm very quickly.
South Beach
Az shear shows a double scan signature on the top left here. This seems like it would result from SGF scanning the shear at one time and Tulsa hitting it at another. Clearly there are not two lines of shear here per radar single scans.
 Another example of a double AzShear signal. Likely coming from radar timestamp matching issues.
Feature following zoom showing the GLM pulsing phenomena associated with intensification/weakening of a supercell in OK/MO. During the third pulse, a TOR warning was issued.
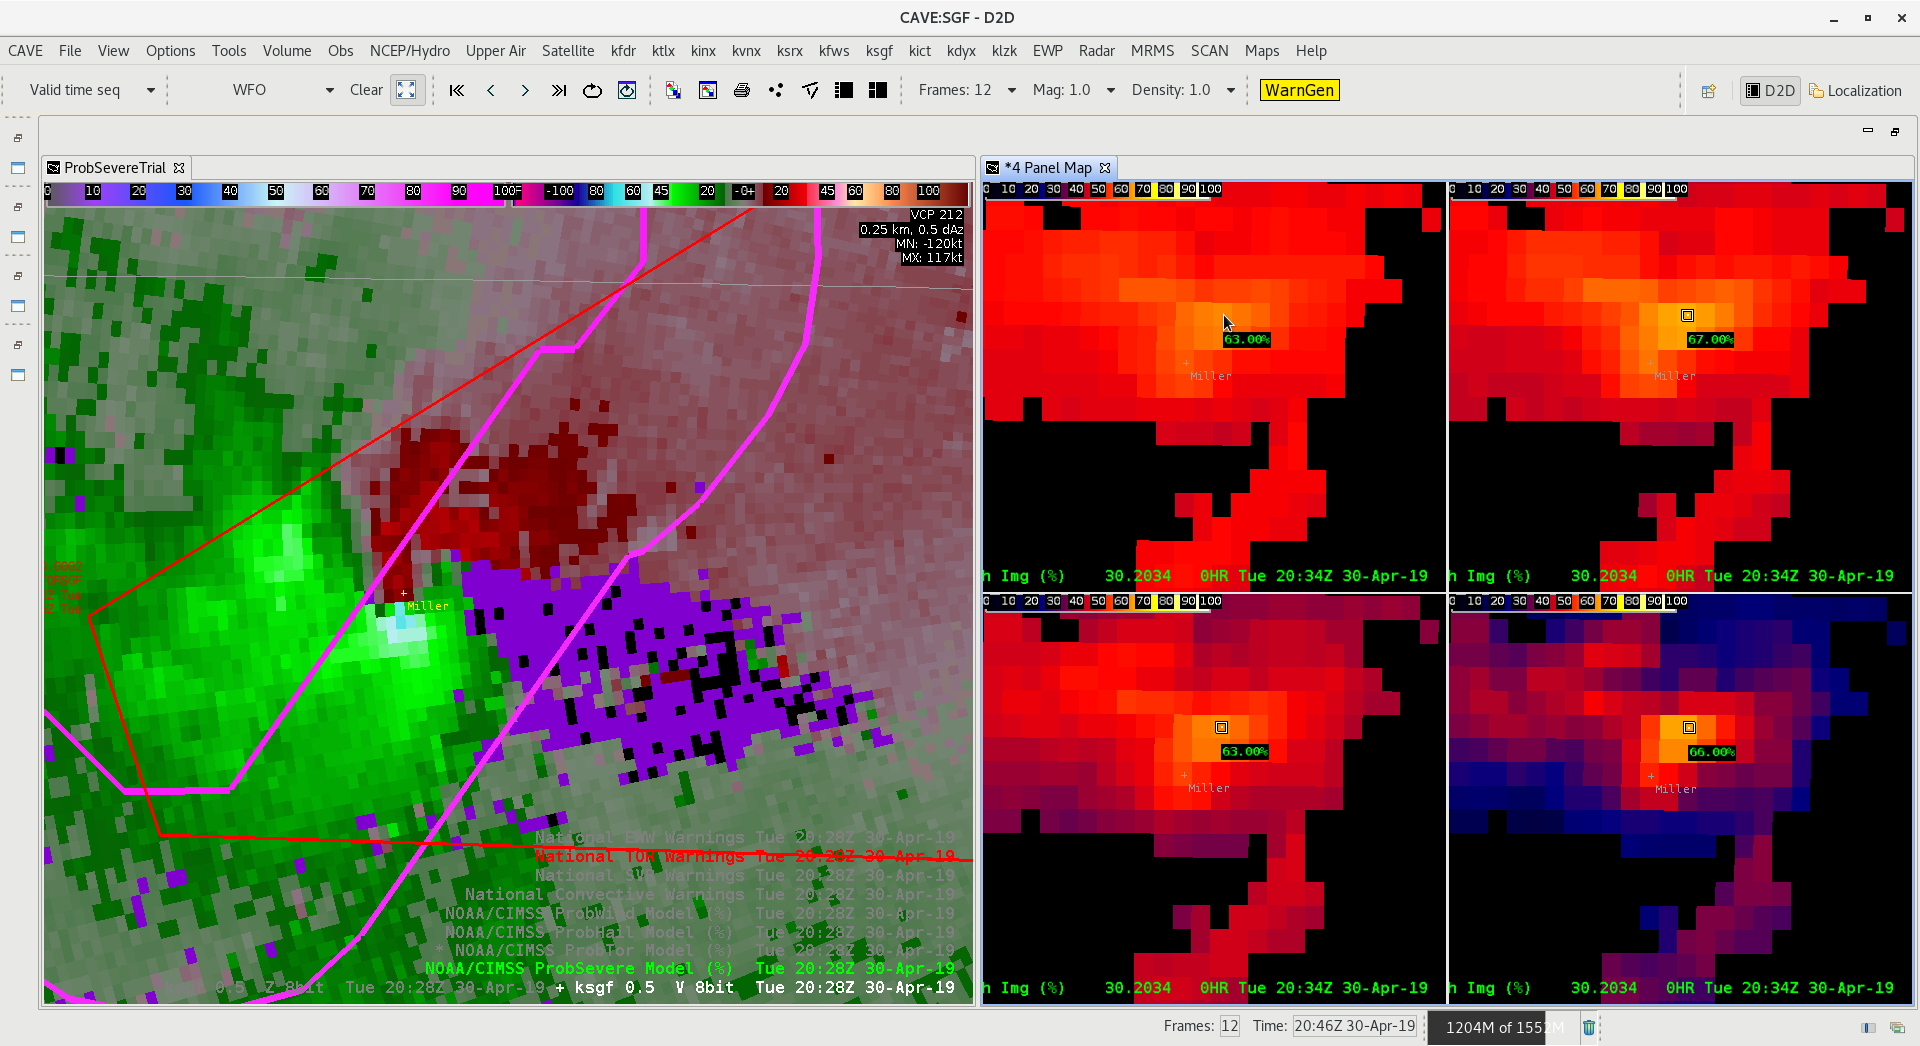
Case of CPTI values on a confirmed tornado near Miller, MO. No confirmed damage estimates yet, but TOR was confirmed at this time visually and with a TDS
Lightning jump preceding a tornado and then confirmed touchdown in MO Event Density over the same cell
 Minimum Flash area showing updraft core
Average Flash Area
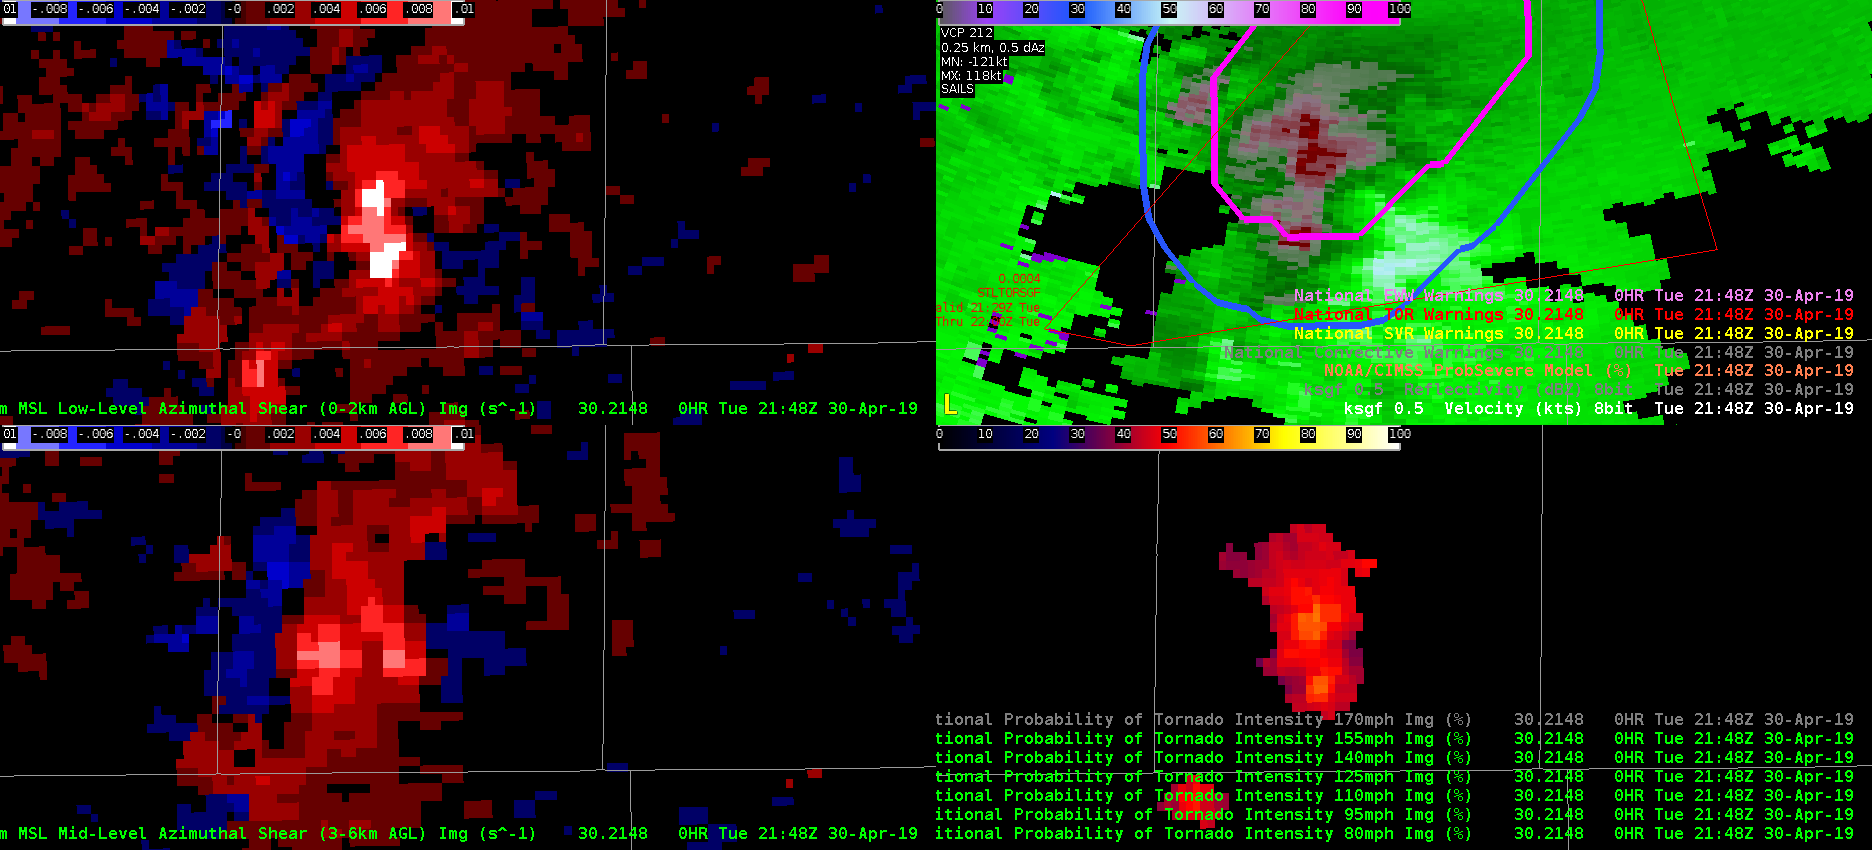 This is a case where AzShear overdid the tornadic threat This supercell had a circulation that never really tightened up. ProbSevere also vastly overestimated the tornado threat, likely due to nearby storm interactions and mergers. When convection gets messy, can we rely on these products as much?
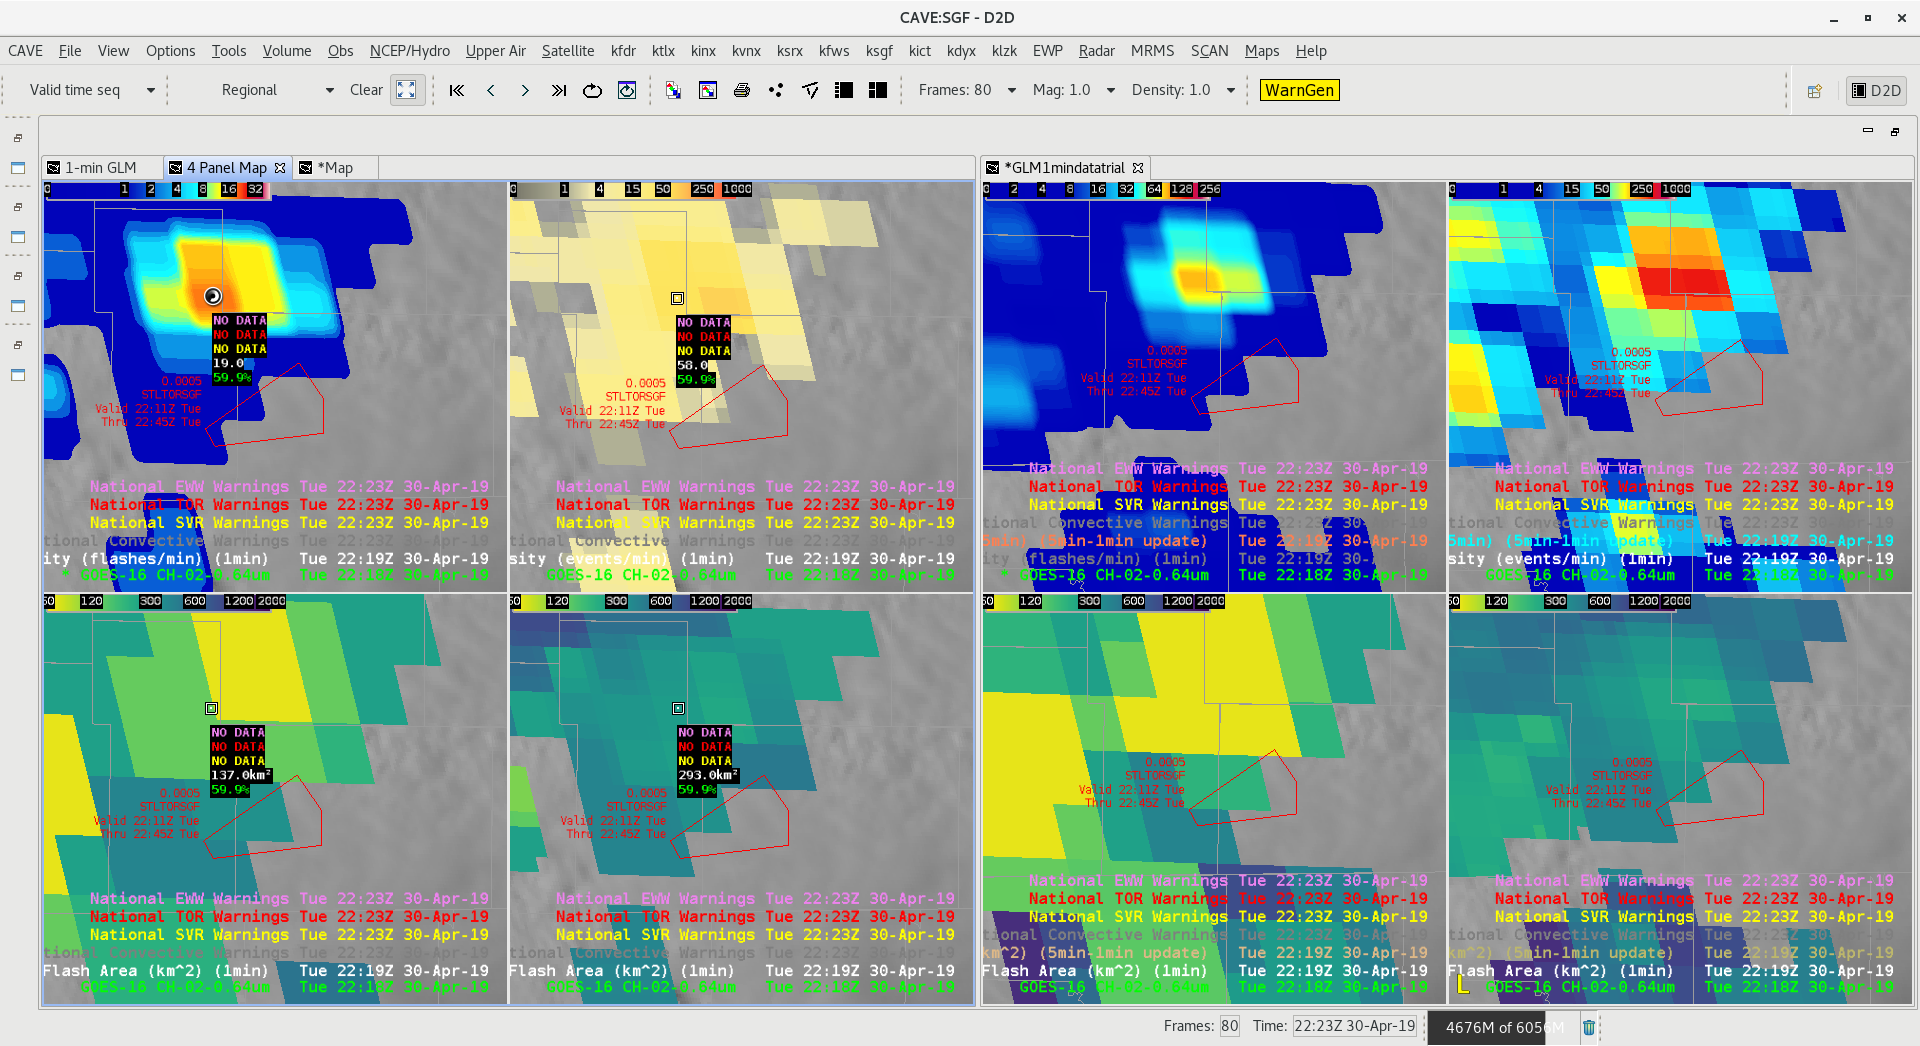
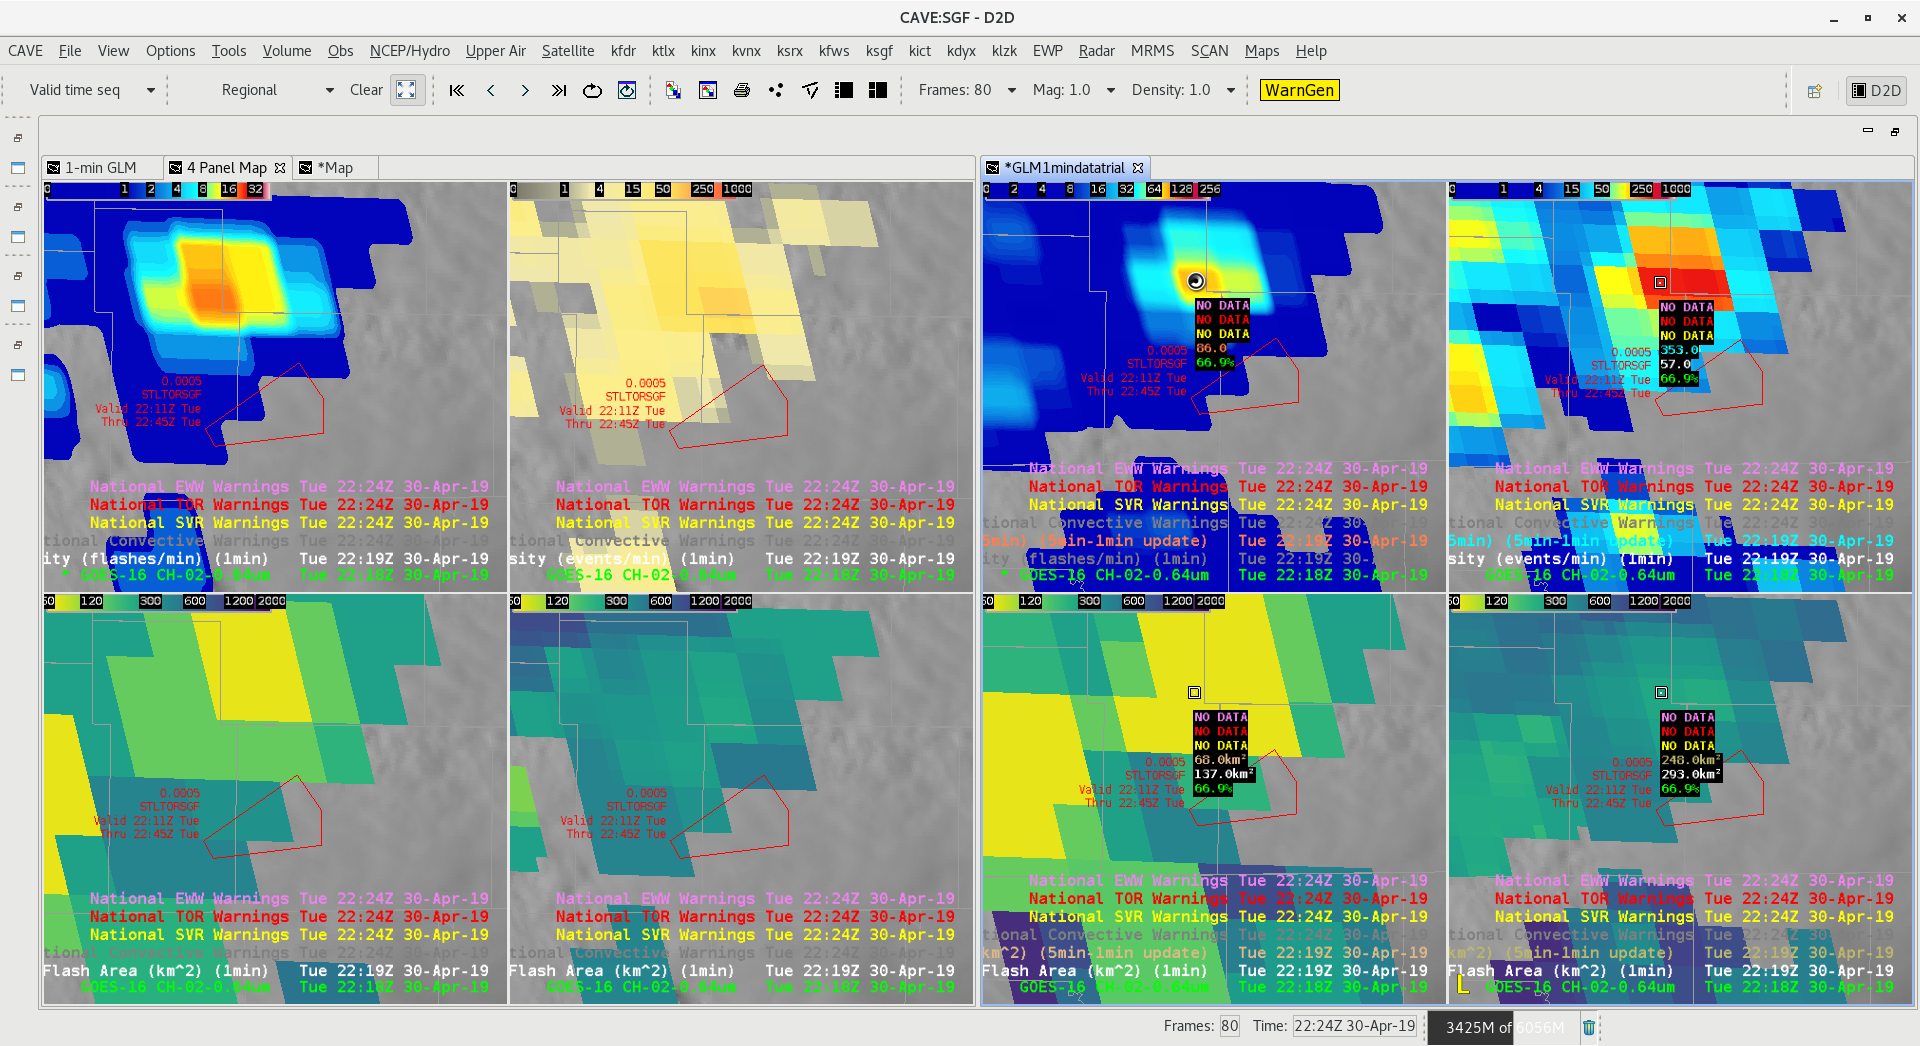
The two images above compare a 4 panel of 1 min GLM data (left four panels) versus 5 min data (right four panels). While the 5 min data was much smoother to view from an animation and trend sense, the 1 min data did provide some fine temporal resolution help during periods of rapid storm intensification preceding this tornado warning.
The above two loops compare 1 min looping (top 4 panel) versus 5 min looping (bottom 4 panels). In a loop the ‘flashy’ nature of 1 min data makes it less desirable in operations, however manual toggling and advancing still make this data useful.
GLM FED maxed out at 160 fl/5-min and TOE at 580 fJ on this cell in southern MO. It would be nice to have the maximum value, at least for the FED and TOE products in the upper left corner like the ground-based networks have. This would also help with quantifying things such as lightning jumps or quickly comparing two cells.
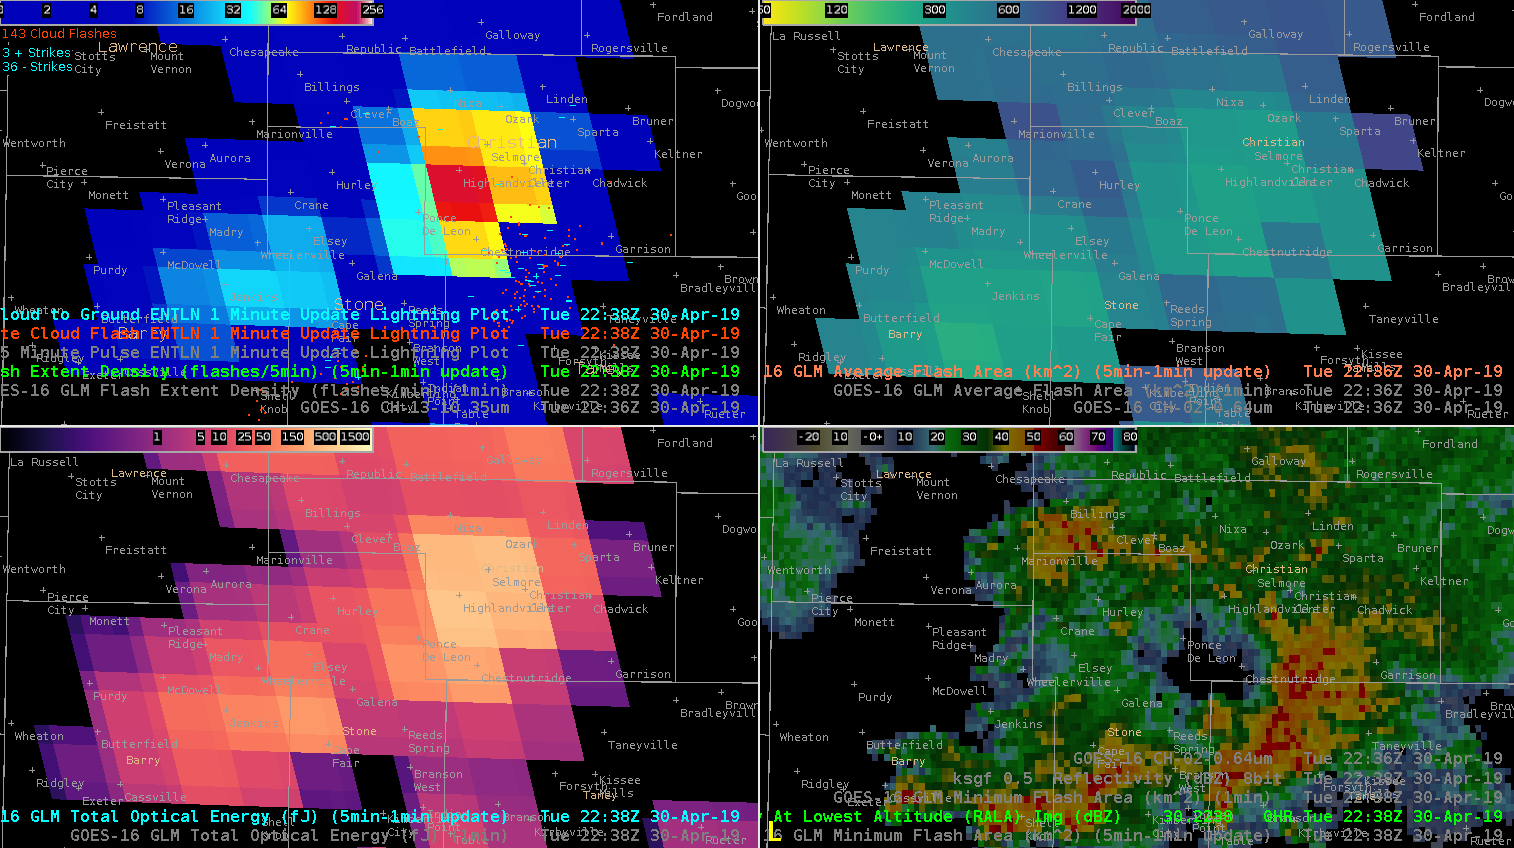
GLM FED (UL), AFA (UR), TOE (LL), RLA (LR)
— SCoulomb
This rapidly developing supercell displayed a GLM lightning decrease as it intensified. This was a good example of optical attenuation due to an updraft core. ENTLN network is displayed, showing that there was a tremendous of CG and IC flashes despite low GLM values. Shown is the TOE product.
The same storm and lightning minimum shown in Event Density.
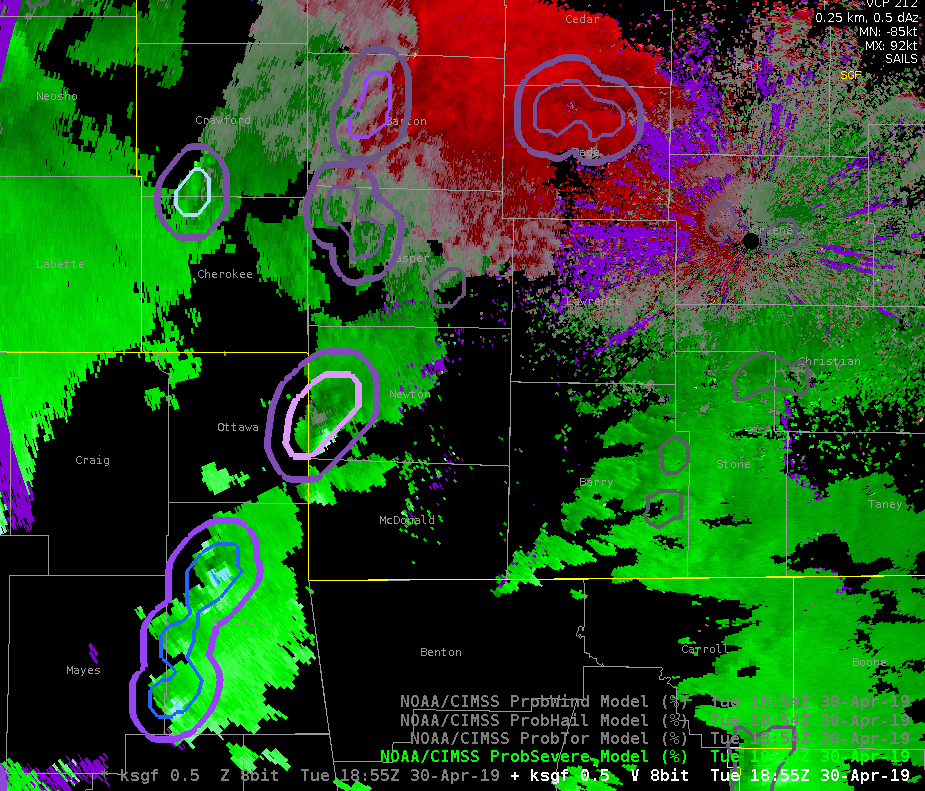
ProbTor was occasionally too aggressive. Only one of these storms was really concerning at this time given the environment and radar tilts further up in the volume. On a day like this, it would likely be prudent to increase the probtor threshold above 3%
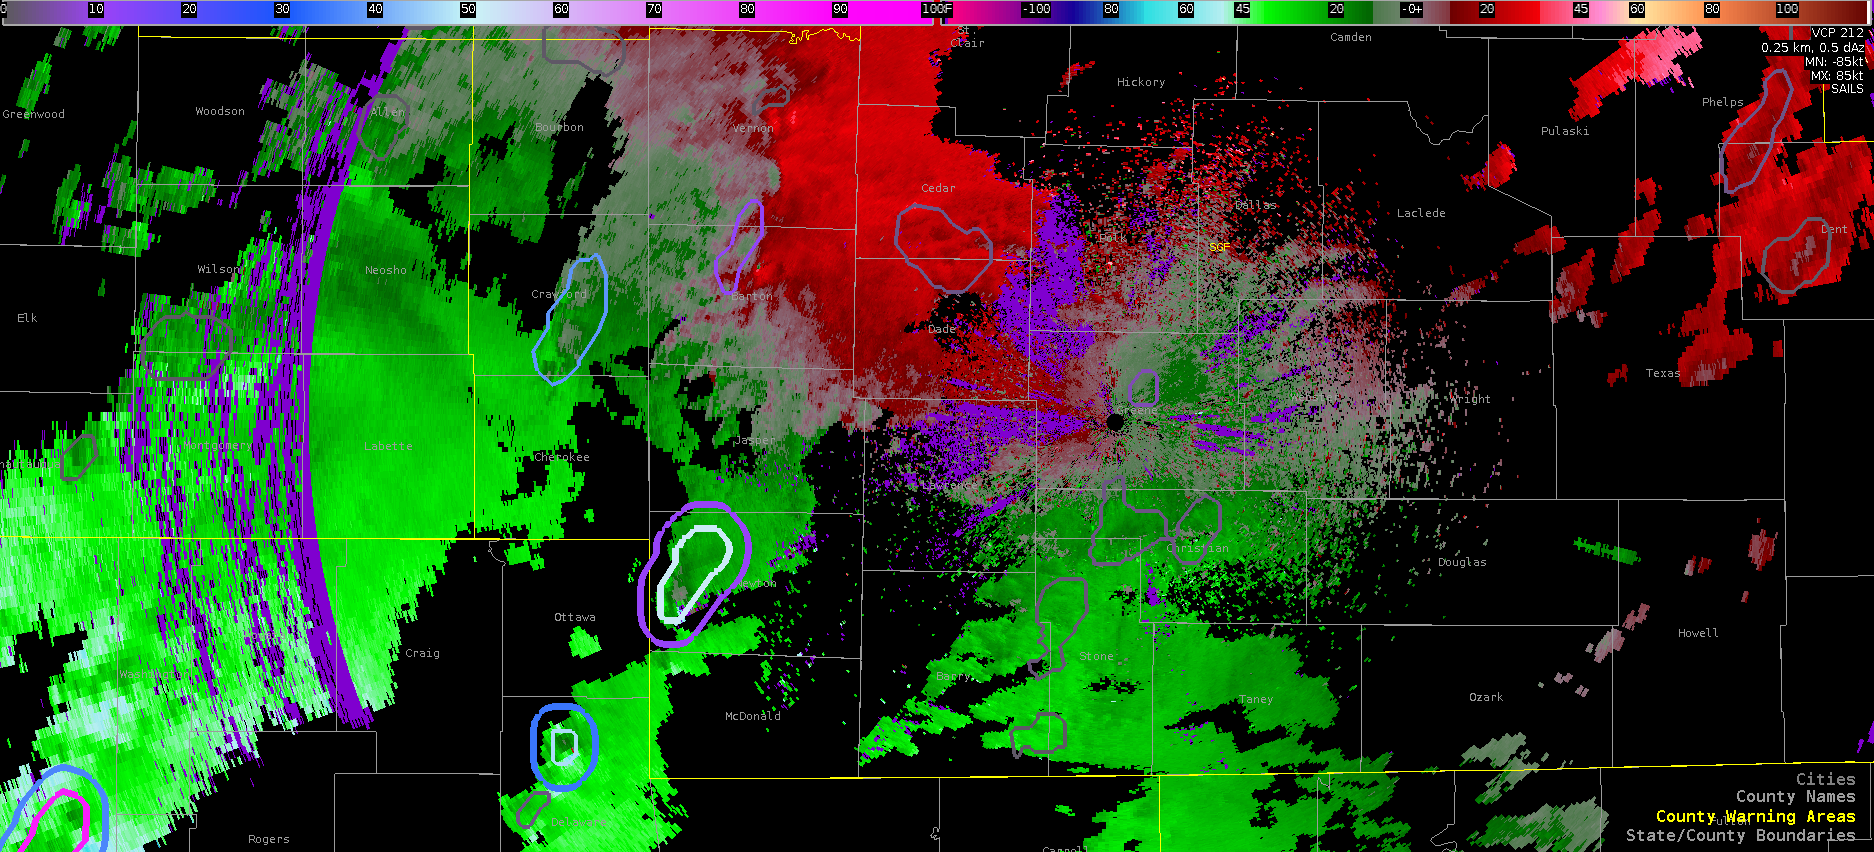
Prob Tor contours showing a new probtor threshold of 10% instead of 3%. This was edited on the fly in the localization file of the procedure itself. This view shows a less cluttered display given the amount of rotating storms this day.
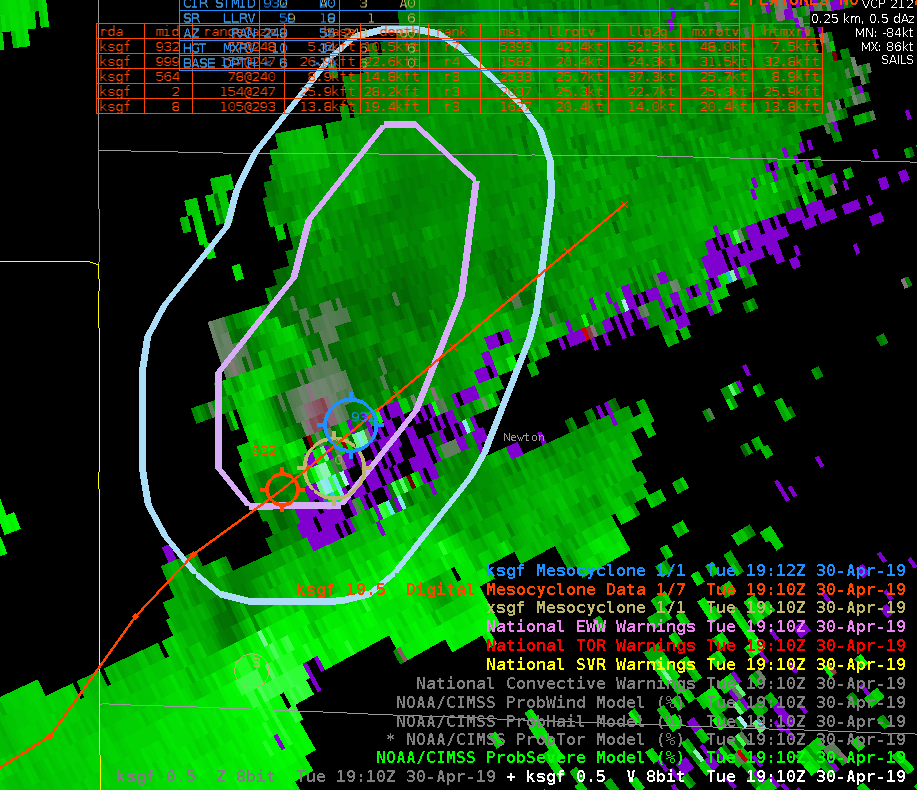
Comparison of MDA products over a weak low topped supercell, as well as showing the probsevere contours. ProbTor was at 47% at the time, prompting the issuance of a Tor Warning.
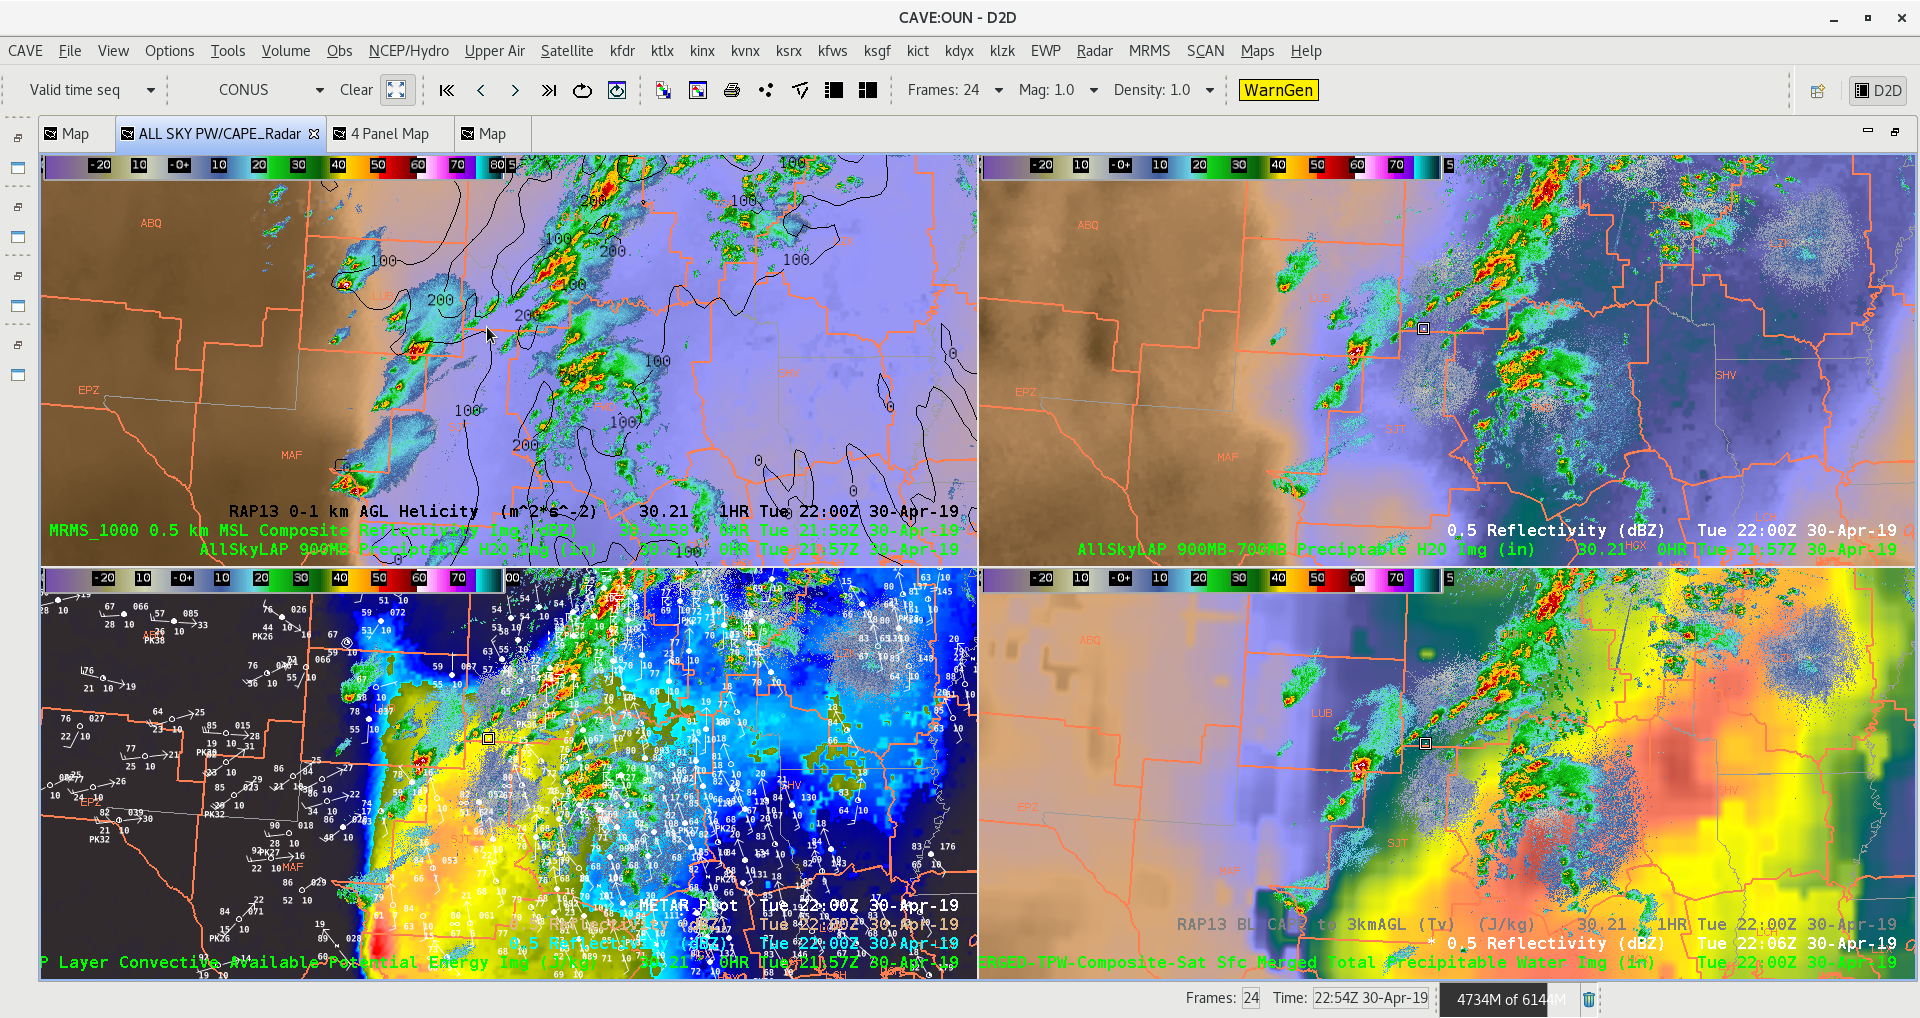
Mesoscale analysis is MUCH improved with ALL SKY products. It gives the forecaster a great visual of where moisture advection is occurring in the layered products. In addition, CAPE and Total PW highlight the more unstable regions with intensifying storms from overlaid region radar data. -Jake Johnson
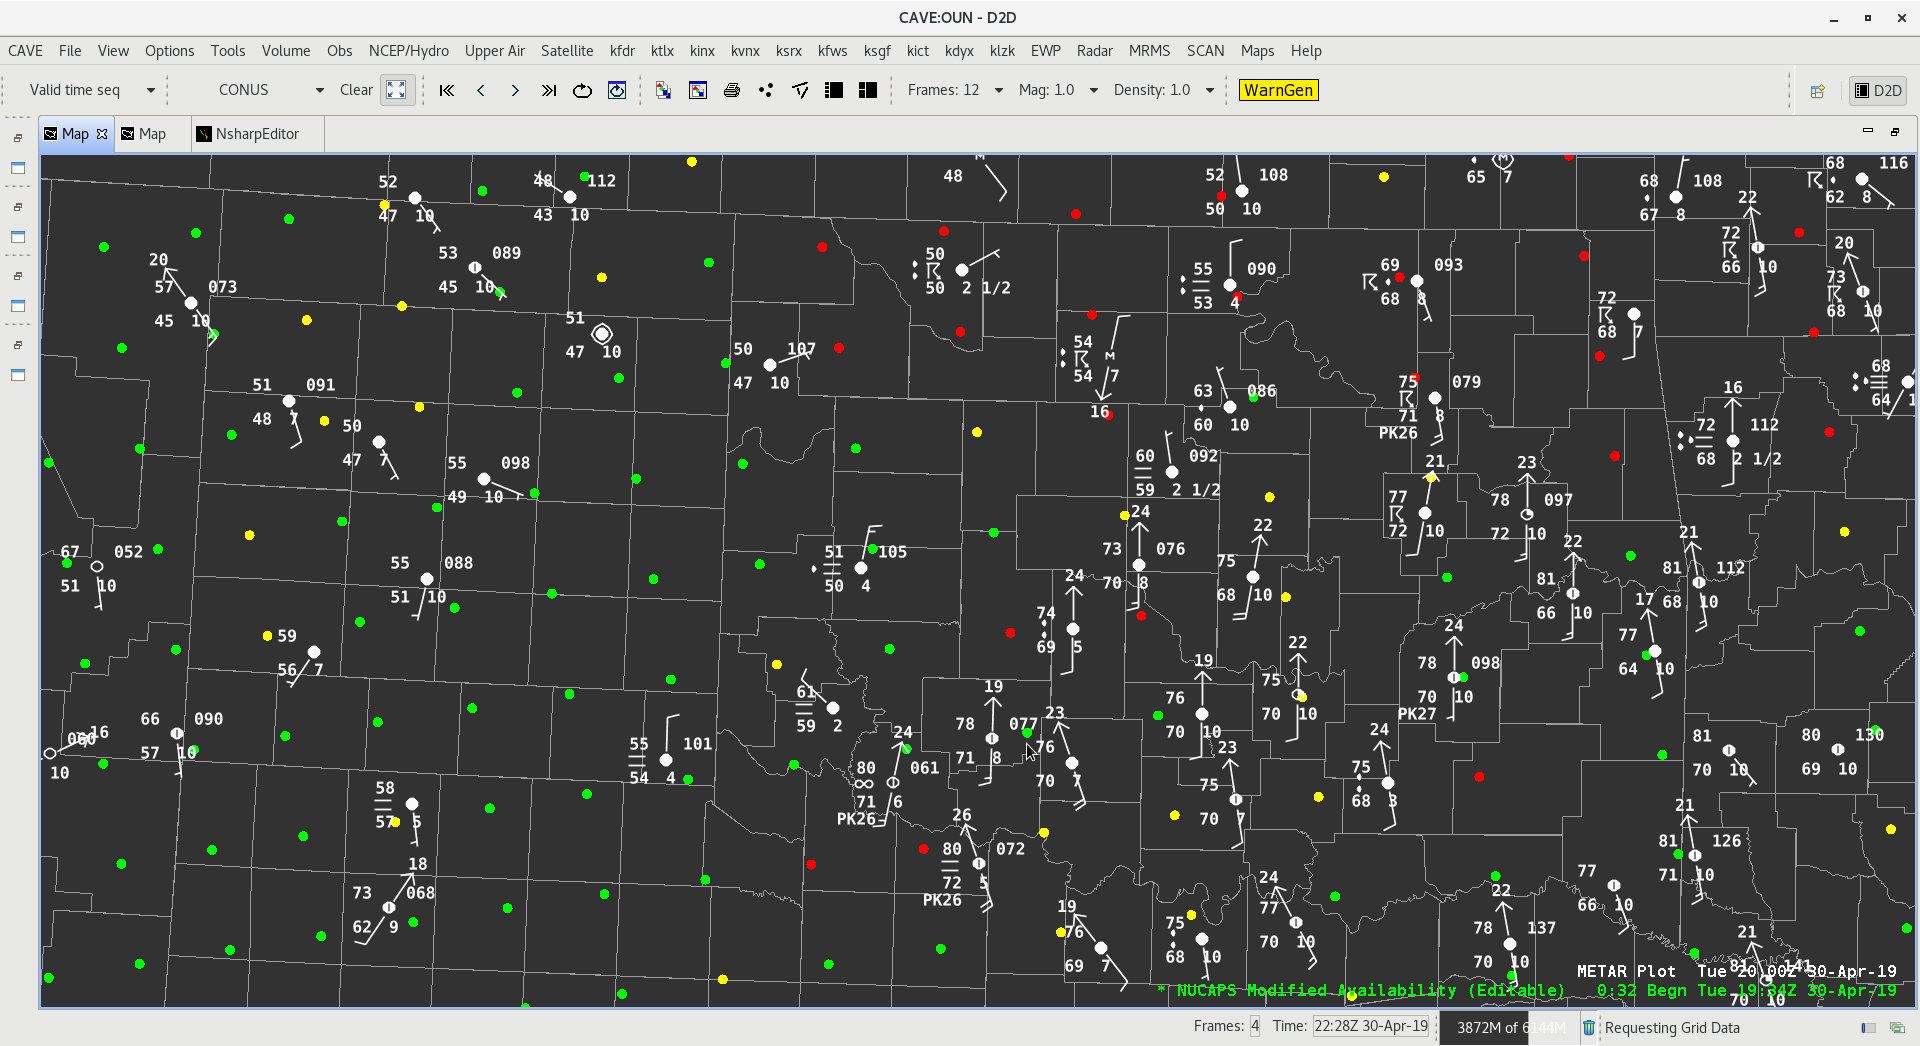
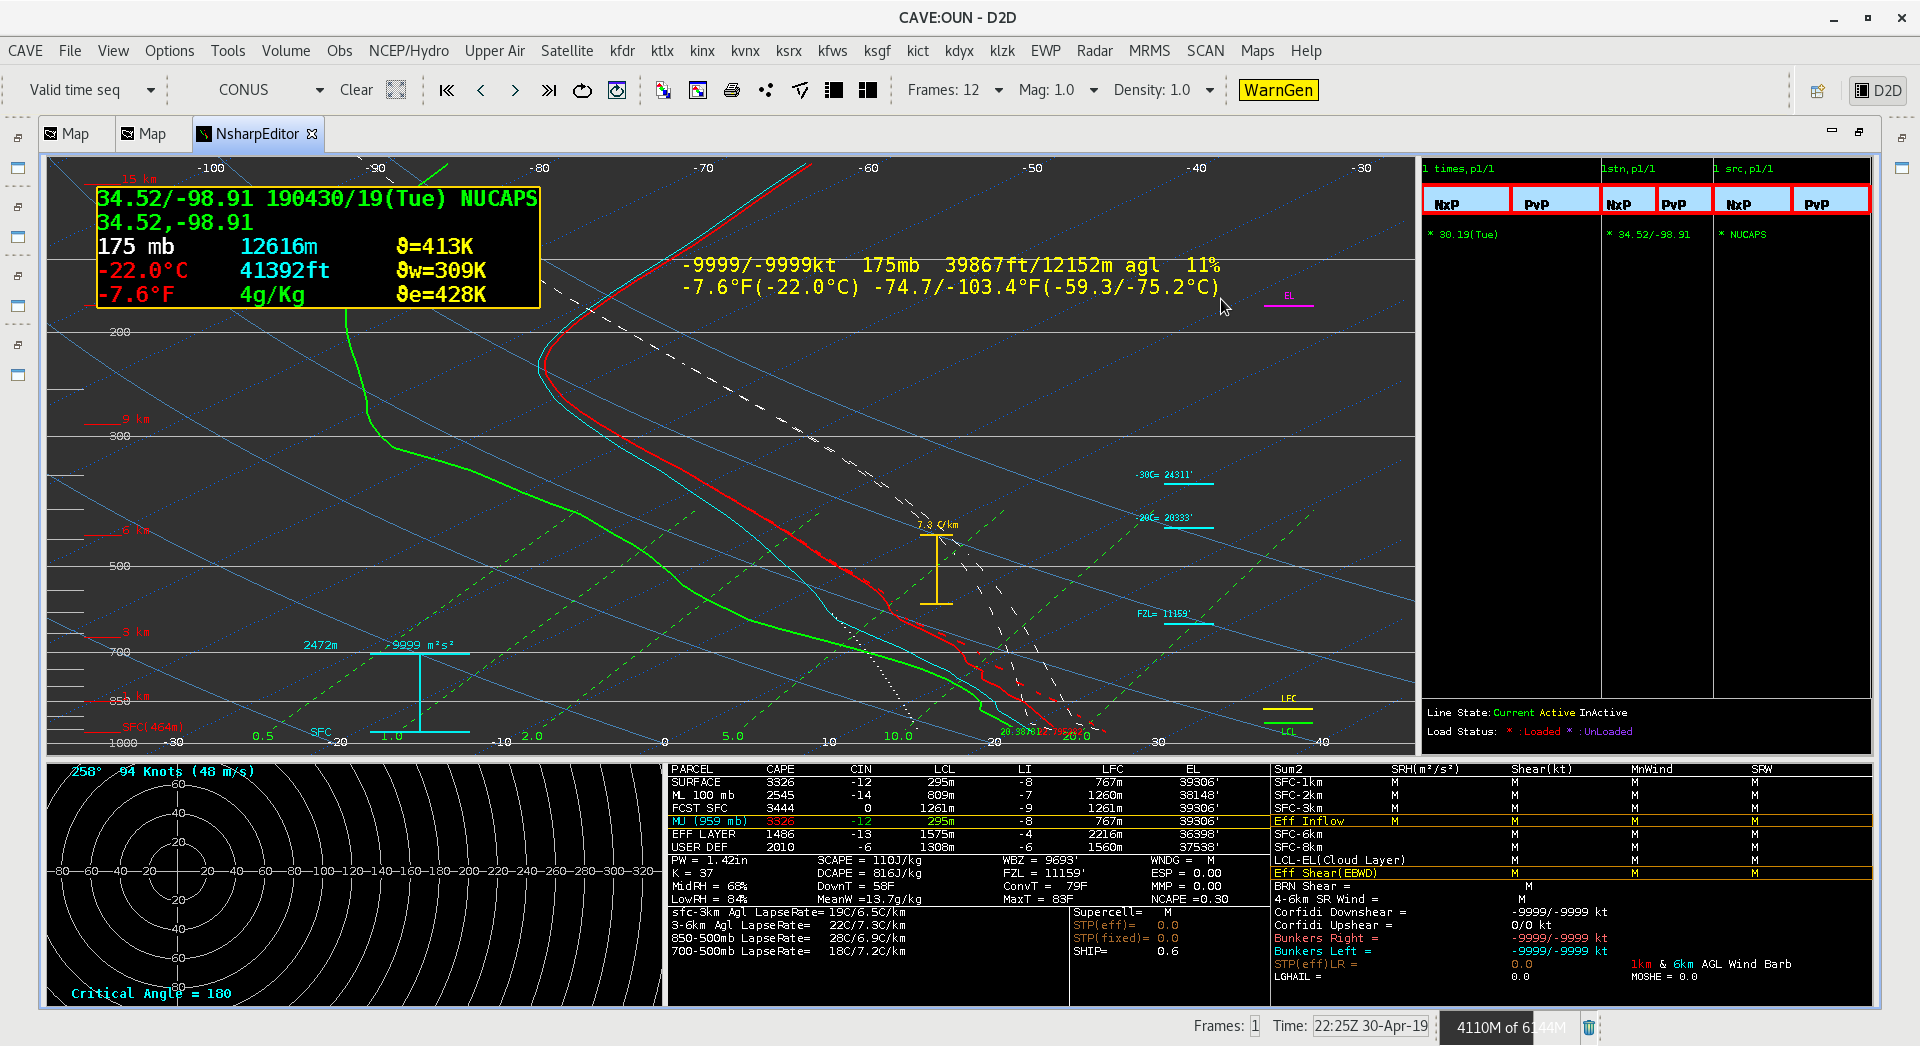
Wichita Falls tornadic environmental data using NUCAPS Modified Sounding. NUCAPS sounding surface data had temp/dewpoint of 73/68, looking at surface obs temp/dewpoint range near the NUCAPS point sounding was 74-76/69-70. Therefore modified numbers were in the ball park.
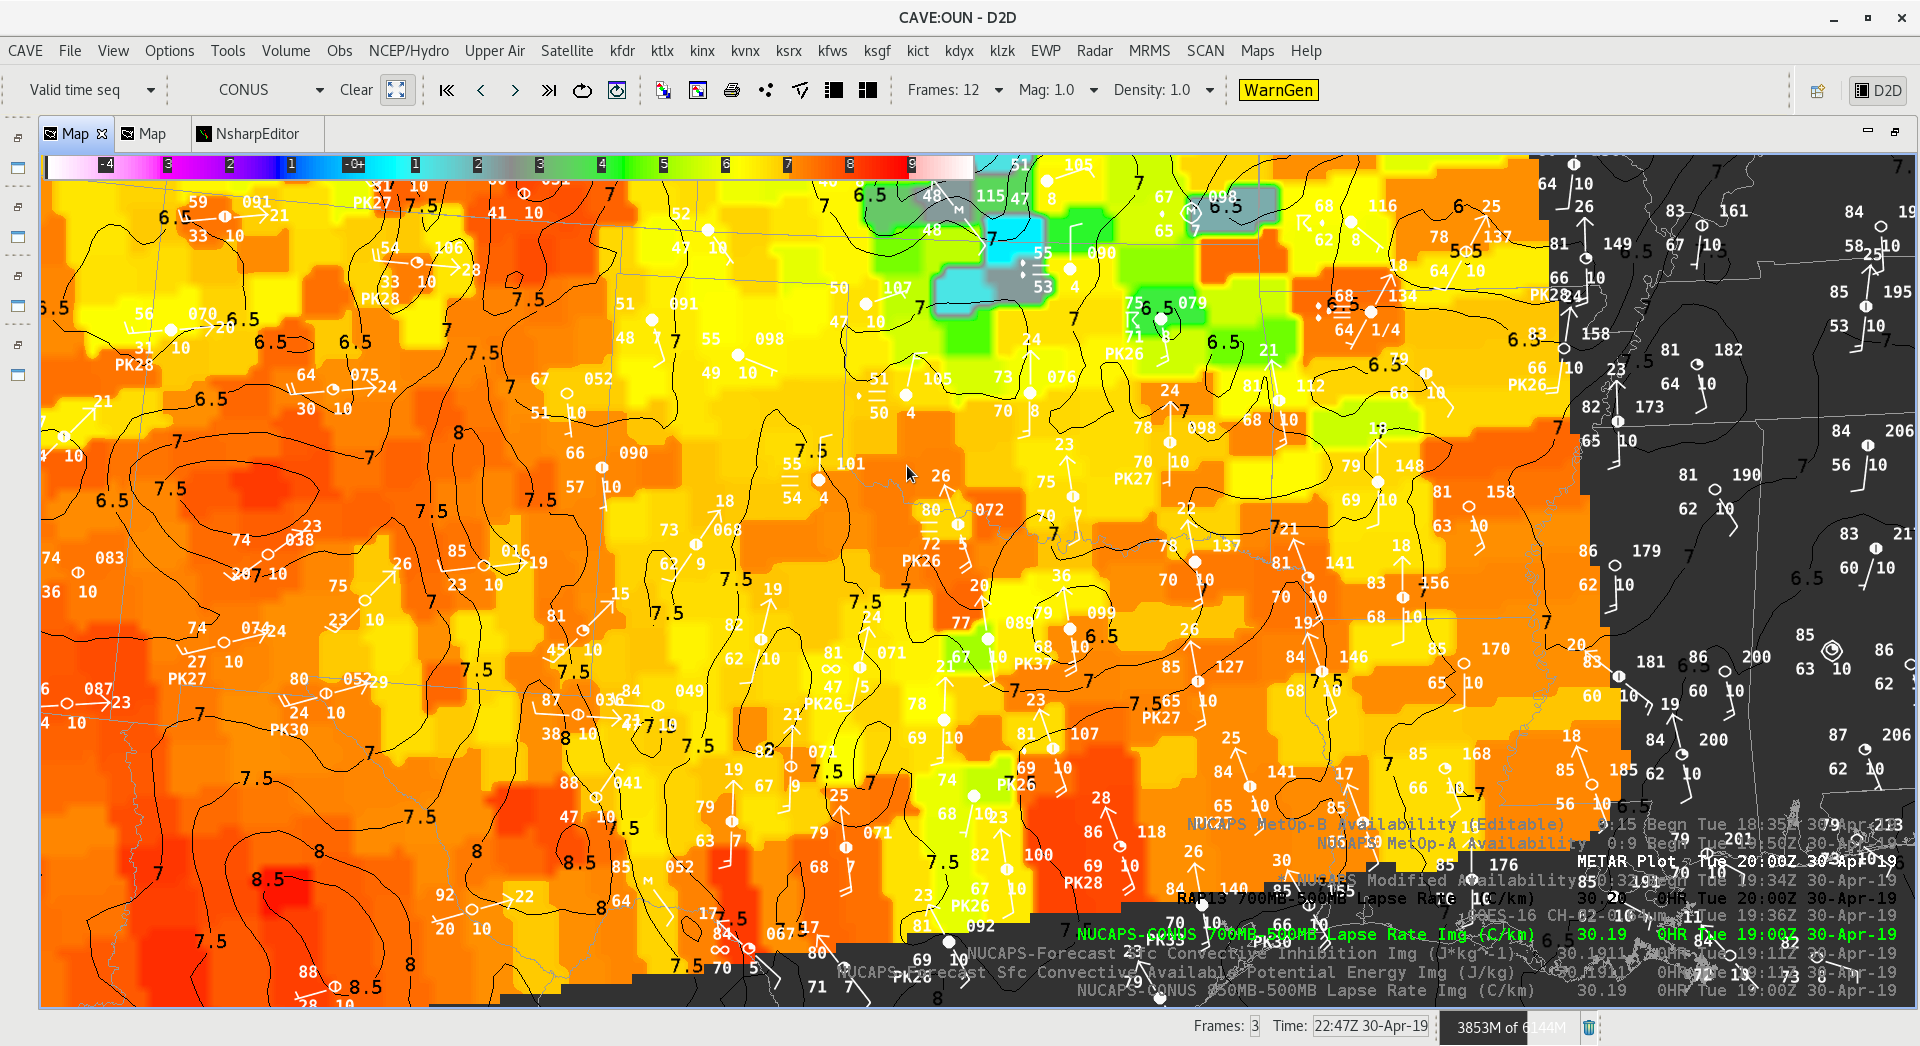
NUCAPS 700-500mb Lapse Rate Gridded Product did a decent job with mid lapse rates across southwest Oklahoma showing a favorable environment for severe thunderstorms.
This wide view of GLM shows the typical small number of very large flashes in the trailing stratiform region across KS and MO. Smaller more numerous flashes, also brighter in TOE exist along the front across central OK into northwest TX. The more discrete cells along the stationary front in southern MO are also evident with the greater flash rates, smaller flashes and brighter appearance in TOE.
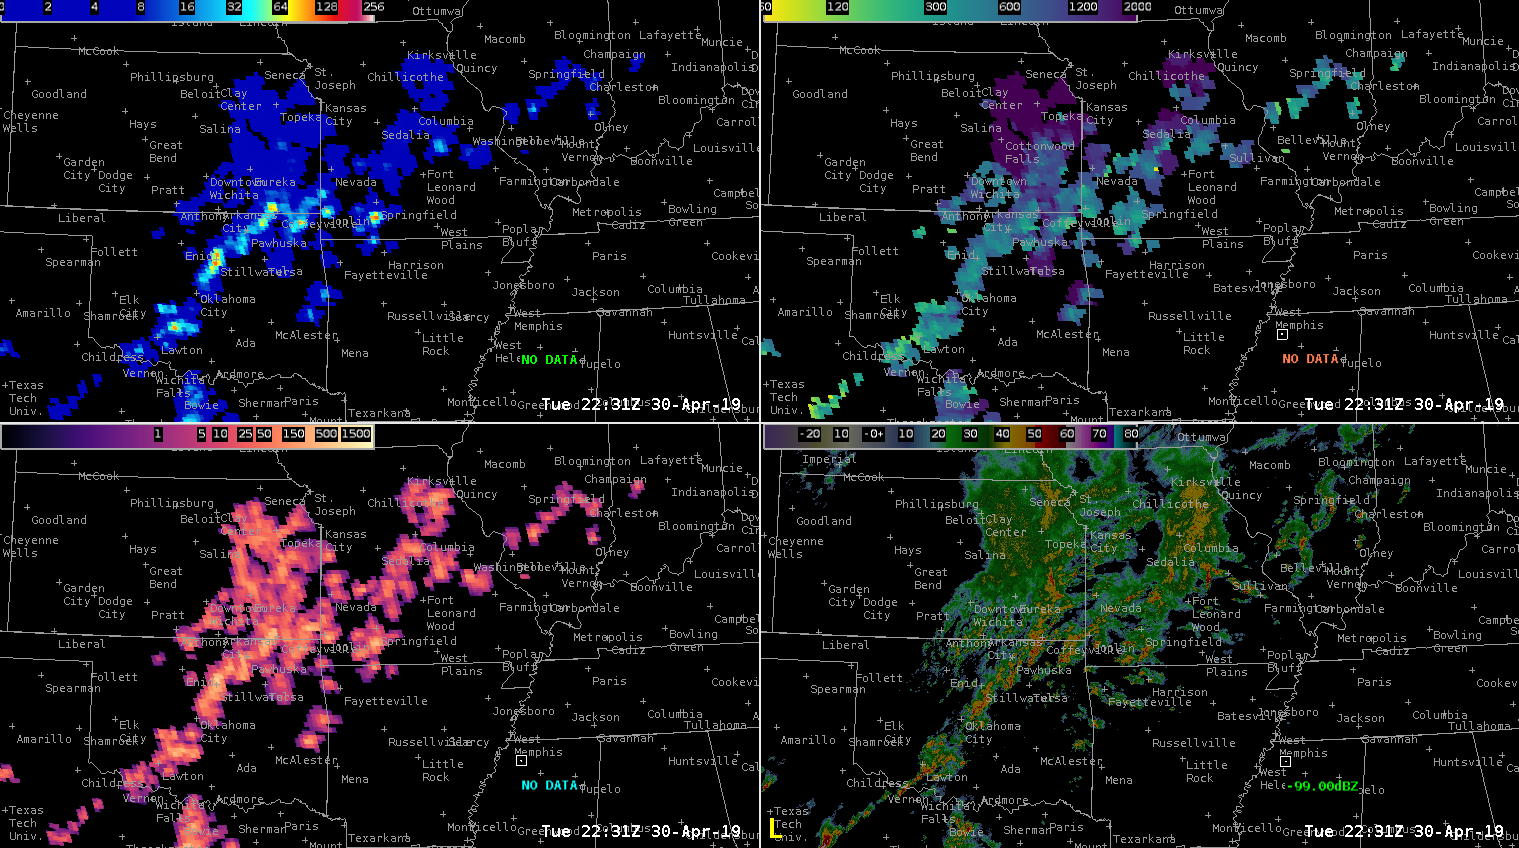
GLM FED (UL), AFA (UR), TOE (LL), RALA (LR)
— S COULOMB