Tornado Development in N LUB CWA – ProbSVR & NMDA Performance

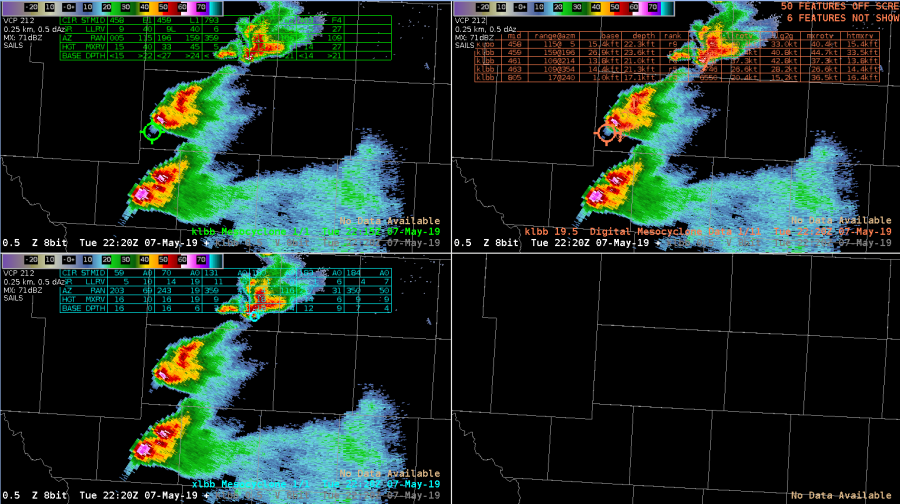
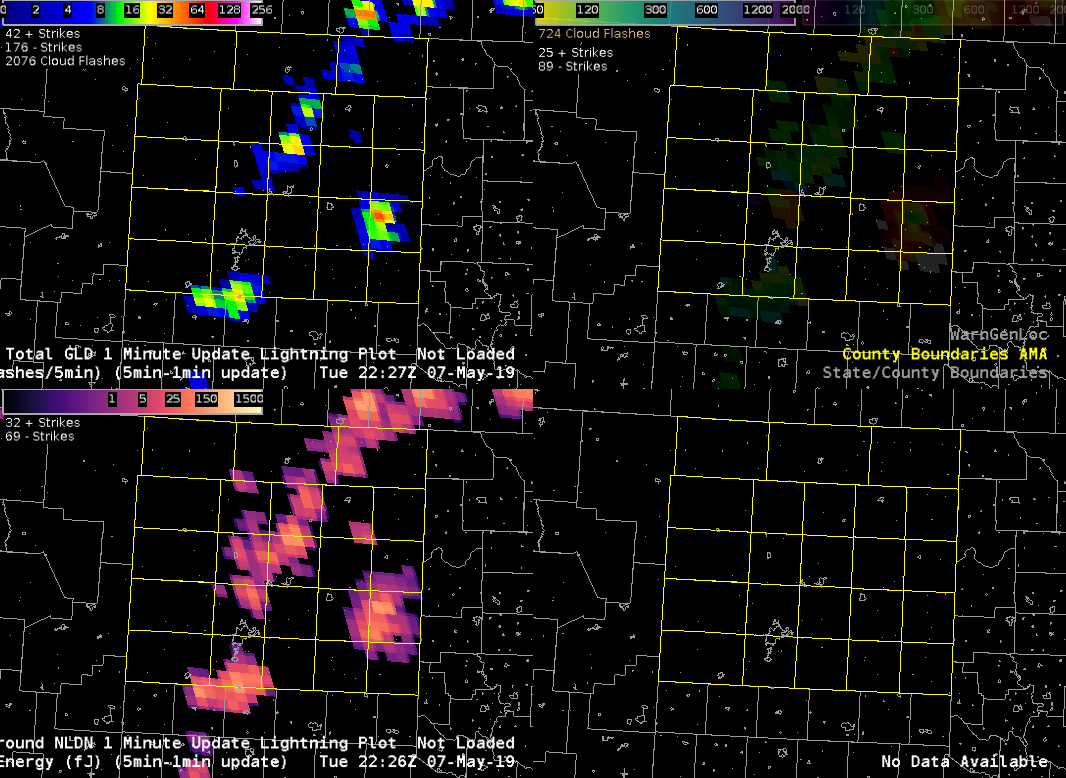
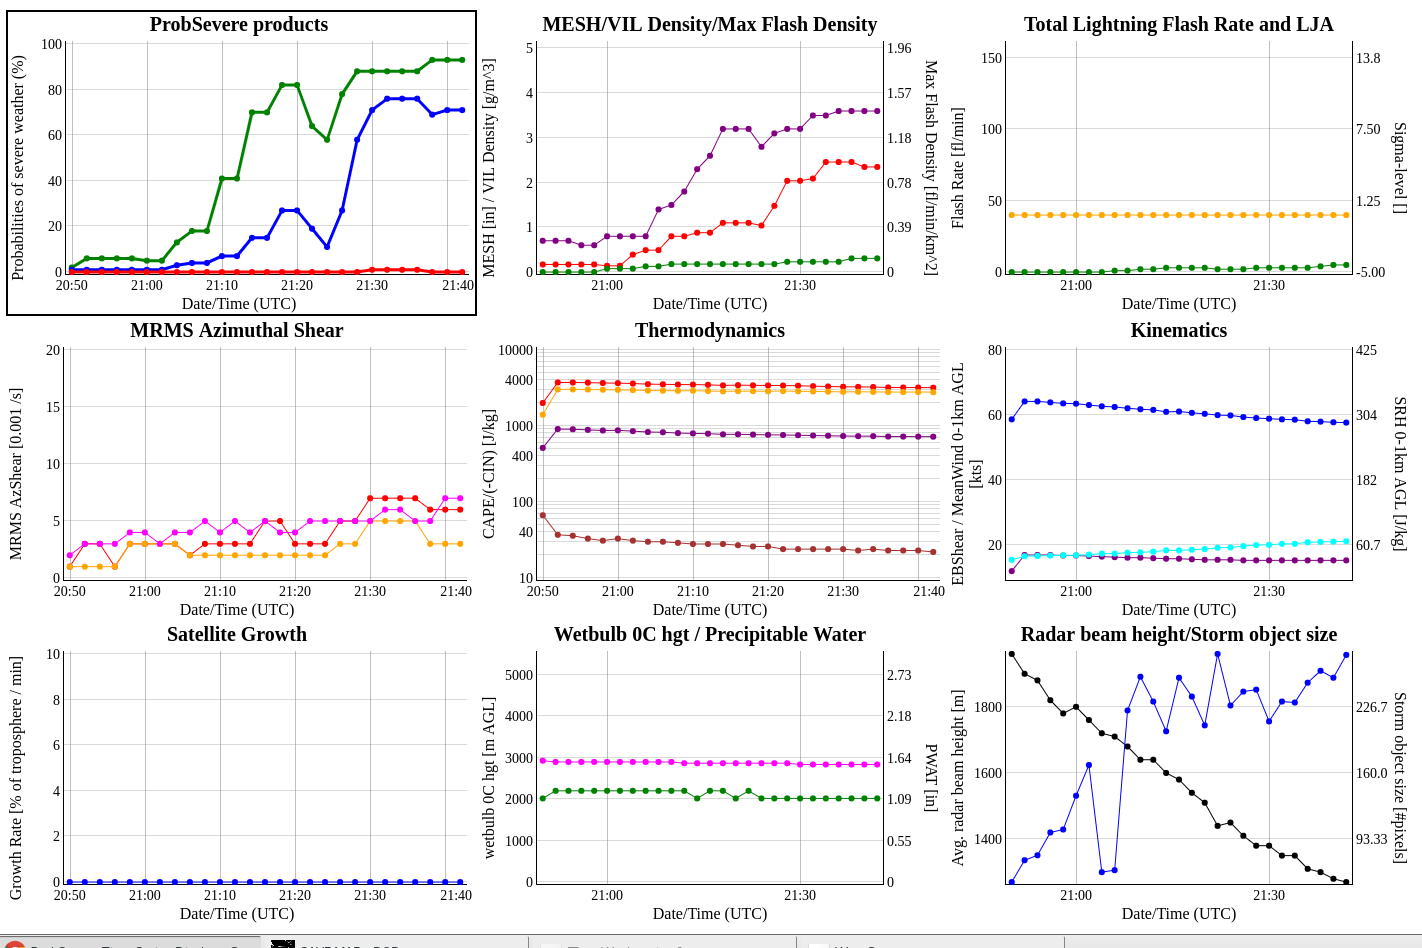
When the reported tornado developed in Swisher County in the northern portion of the LUB CWA at 5:12 PM, it was preceded by increases to the ProbTor and AZShear products by several minutes. Initially, I believed these algorithms to be picking up on sidelobes in the lowest levels of the radar scans, as noisy velocity data was being recorded in areas where reflectivity values were small. You can see these artifacts in and around areas of purple haze in the animation below. However, these products verified their jumps with a brief tornado touching down. It was reported to look relatively strong while on the ground with multiple vorticies visible at the time. It was short-lived, however, seeming to dissipate relatively quickly after touchdown.

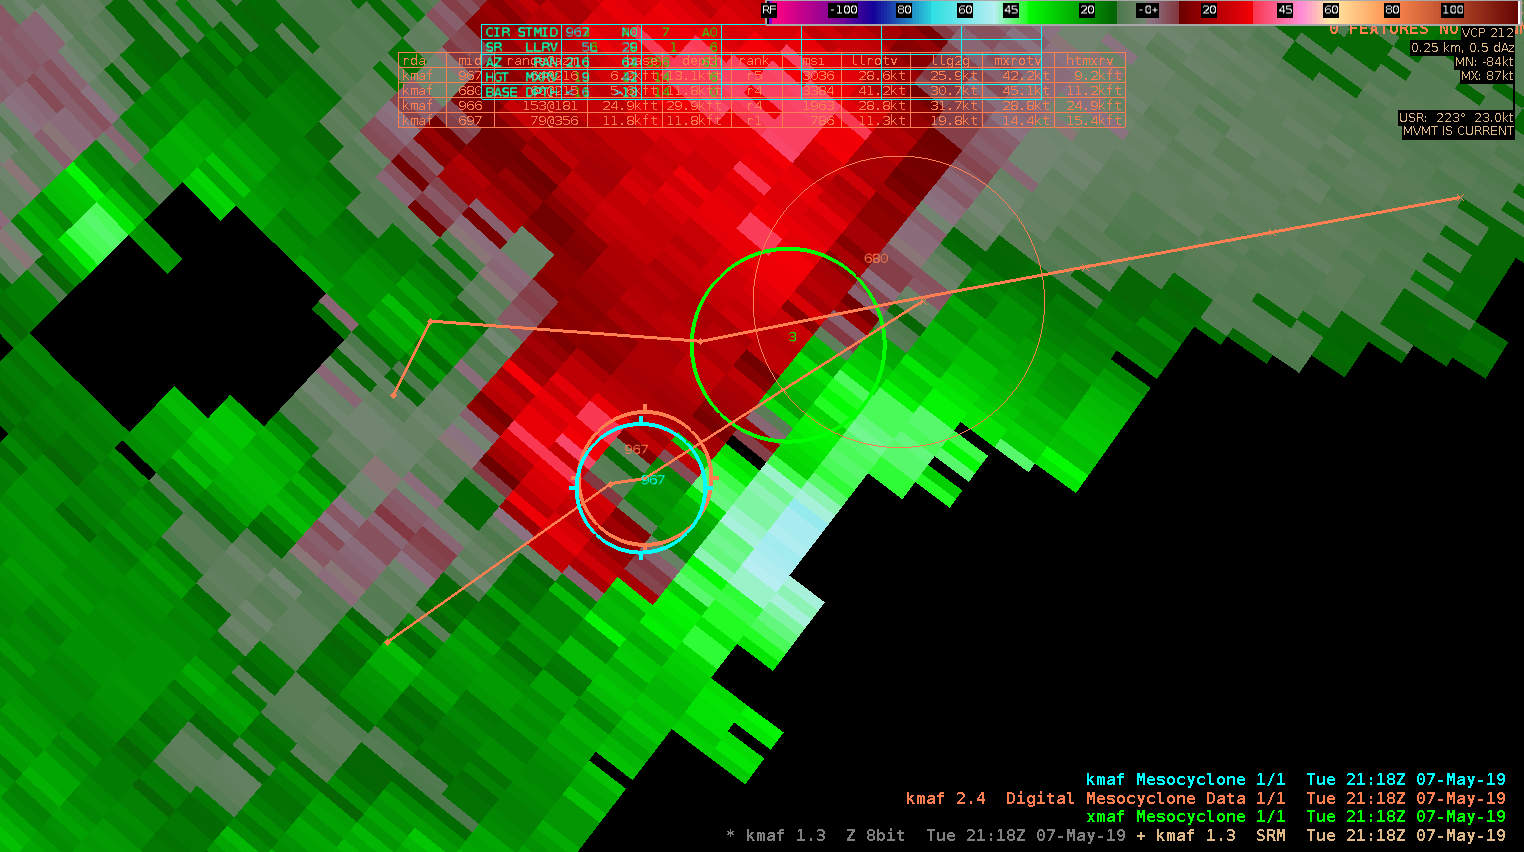
The NMDA also did well picking up on this circulation before tornadogenesis, but I had some questions regarding the data quality in the low-level detection prior to the tornado.

#ProtectAndDissipate

NMDA falls short

NMDA (in green) had problems picking up on the 1.3 slice circulation compared to DMD (in orange) and MDA (in cyan). This is a mid-level rotation at about 11K ft above sea level. This is about half an hour before tornado touchdown.

ZDR_Arcophile

Lightning Jumps in Action

The storm near Tulia is…impressive.  Aside from being a long-tracked supercell, the storm has been extremely active electrically.  There have been several lightning jumps with this storm that appears to coincide with an increase in the strength of the mid-level mesocyclone.  First we will take a look at an hour long loop (TL – Flash Extent Density overlay with Vaisala GLD, TR – Minimum Flash Area, BL –  Optical Energy, BR –  Mid-level Azimuthal Shear (3-6 km AGL) with New Mesocyclone Detection Algorithm Overlay) :

There are two jumps to take a look at, 1) between 21:29 and 21:40, 2) 21:55 – 21:20.  Although the AzShear product doesn’t show a strong mid-level meso developing, the number of positive CG flashes in the GLD data increases and we see continued small area flashes in the core.  The more impressive jump is the second one;  AzShear shows a much more pronounced area of positive shear, a long-lived NMDA indication (the circle with 4 pips on it), and overall smaller flashes in the area of that storm.

Shortly after the last jump (and not shown here), live stormchaser feeds showed a rapid strengthening of low-level features; well defined wall cloud, organized rotation, and frequent CG activity sending a flurry of stormchasers heading east to get out from under the storm…

-Dusty

False meso alarm?

In this image from LBB, the legacy MDA (top left) and DMDA (top right) were indicating a meso in an area where a hail spike was resulting in false velocity data. The NMDA was the most trustworthy during this time frame.

GLM Helped Situational Awareness

GLM data helped me stay situationally aware as new updrafts quickly strengthen on eastern edge of CWA.

Issued a warning on this cell about ten minutes after upon continued strengthening in the radar fields and prob severe (hail/wind) values rapidly increasing (I find the time series plots very valuable). Given storm environment I expect the storm to continue to strengthen to severe levels.


-icafunnel

Evolution of ProbSevere

I am finding the all hazards version of ProbSevere to be extremely useful as a situational awareness and decision making tool. Here is a short animation of the evolution of ProbSevere thresholds for a storm near Kermit, TX.

Below is a timeseries for the same storm…

A loop of the ProbSevere thresholds provides a quick look at the potential hazards, but it becomes even more powerful when you combine it with the timeseries.