
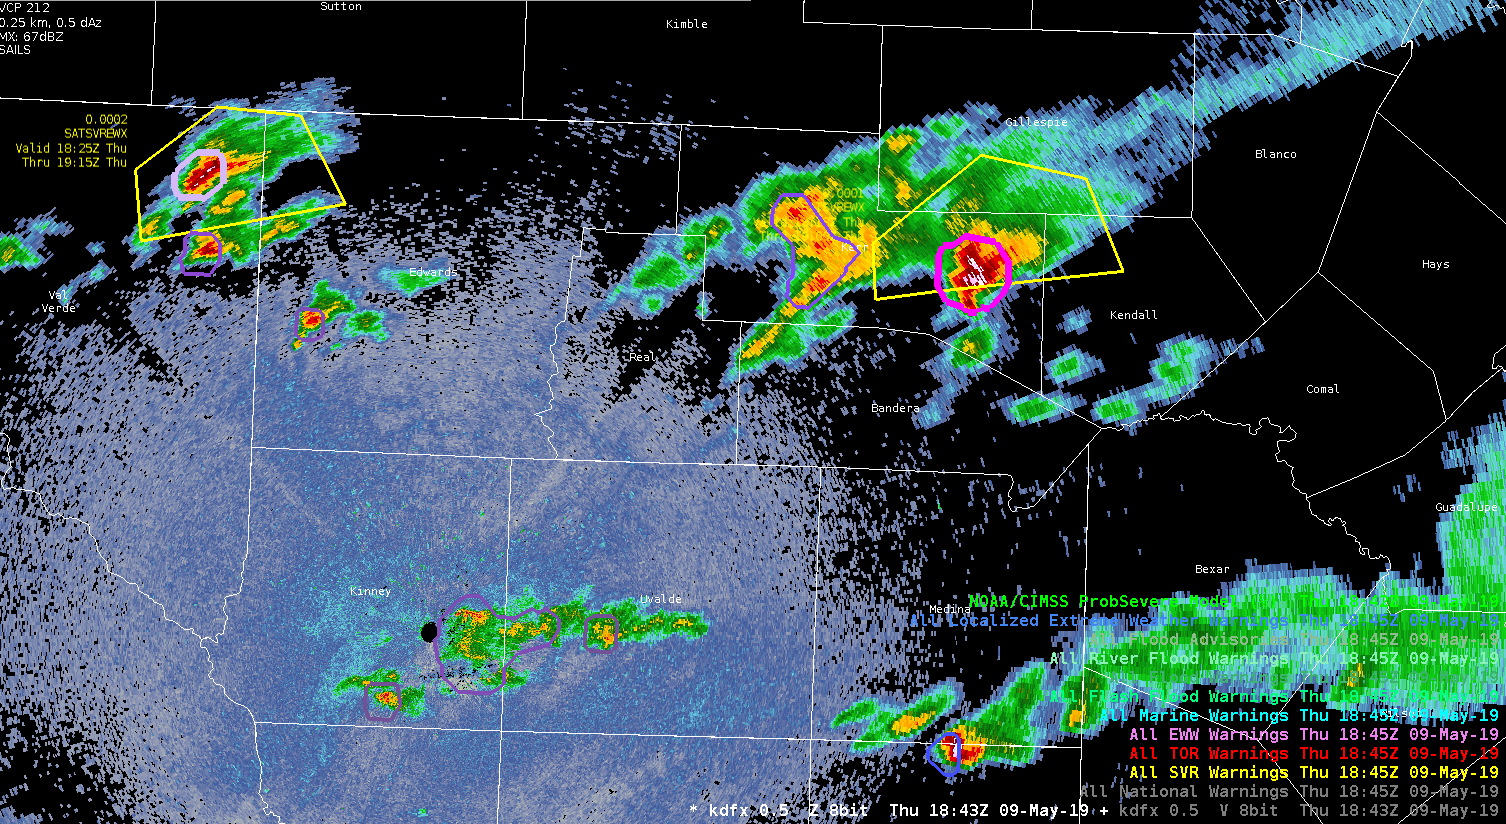
Despite a concerning hook-ish appearance on radar, I chose to hold off issuing a TOR due to the lack of persistent/significant Az Shear values.

Author: Tiffany
NUCAPS FCAST
Knowing that the NUCAPS FCAST information was in today for the first time this week, I decided to do some analysis of the fields. Initial thoughts are that the missing blocks of data (not sure if that is typical – more visible in the CAPE field in top image – similar data holes observed in LCL, LFC and EL) make it hard to have confidence in it at first glance.
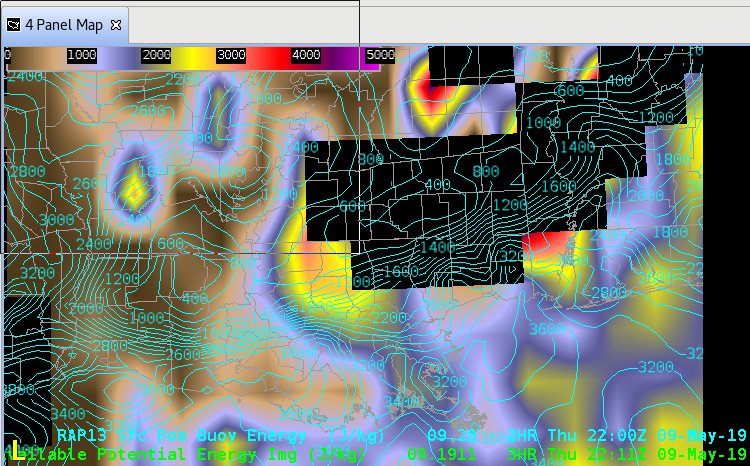
CAPE (Top Image)
NUCAPS FCAST CAPE data isn’t good in the pre-storm environment along the LA coast. RAP13 initialization is overlayed for comparison. RAP13 values are 2500-3500+ and much more representating thatn the NUCAPS values that in some cases are less than 500 ahead of the line.
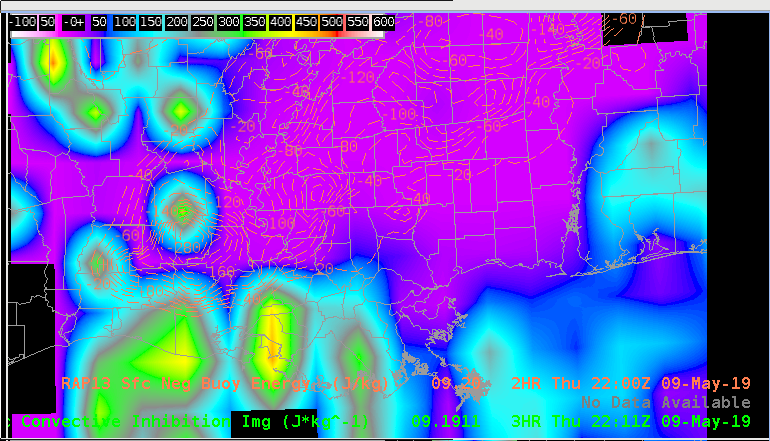
CINH (Lower Image)
While these values appear to be more closely representative compared to the RAP13, the inability of the product to adequately represent the boundary layer at times during the week don’t provide me much confidence for these surface based stability parameters.
-icafunnel
NUCAPS_Ahead of Line
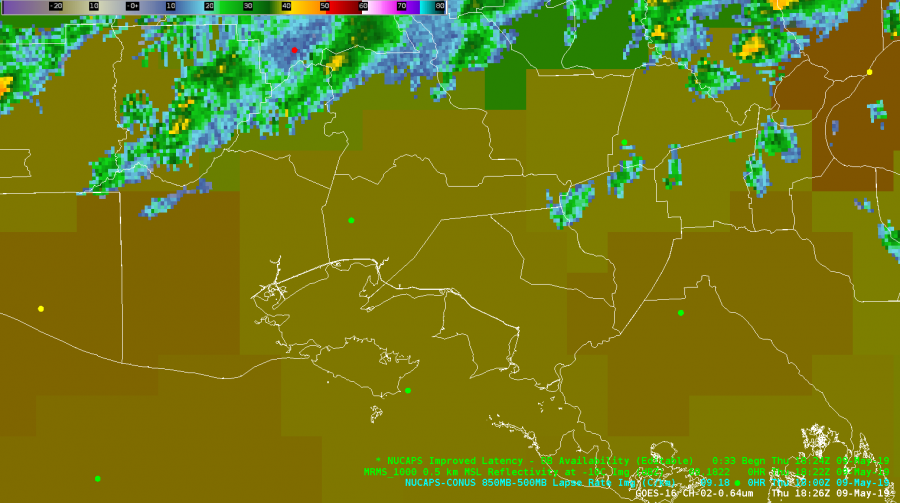 NUCAPS data in advance of convective line today. Iberia County METAR station coincides with NUCAPS operational sounding (modified soundings not available today).
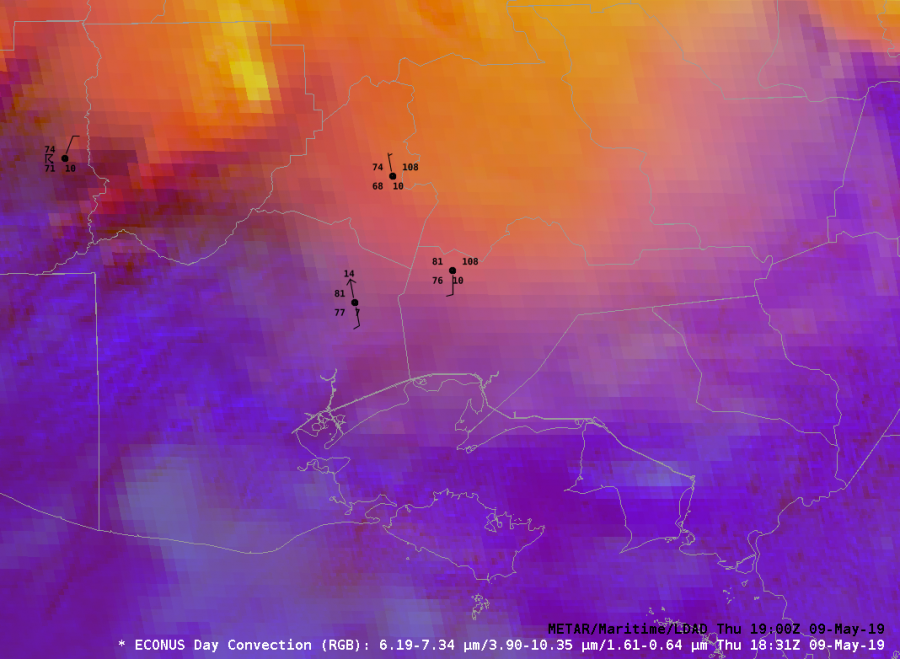
As you can see from the plotted NUCAPS sounding below, the surface values are too low. From the METAR in western Iberia County, you can see in the first image the the T/Td values are 81/76. Sounding surface values are 76/70. Other sounding points in the pre-storm environment are also about 5 degrees too low on temp and dew. While I can modify these, it doesn’t give me confidence in an accurate representation of the boundary layer and on any day expected to be busy I’d likely use other products.
-icafunnel

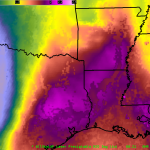
Four Views of TPW
After making some adjustments to the color scaling, we’re able to mix model and analysis products of TPW. The GOM was mostly clear, while clouds covered most of the land. A very moist airmass was onshore, the Hammond LA GPS site measured 2.25″ of TPW.
The GFS and HRRR forecasts both indicated this maximum. The All-Sky LAP also did well, although it’s field is a reflection of the good GFS forecast. The Merged TPW did not generate these very large purple values (> 2″ of TPW) except in a very small area. The polar orbiter TPW retrievals used in Merged TPW must not have sampled these large values to advect in. The operational blended TPW (which relies heavily on GPS sites for the analysis over land) also showed a maximum. This points to the possibility that including the surface GPS network into Merged TPW and All-Sky LAP might be a way to increase the precision of these analyses.
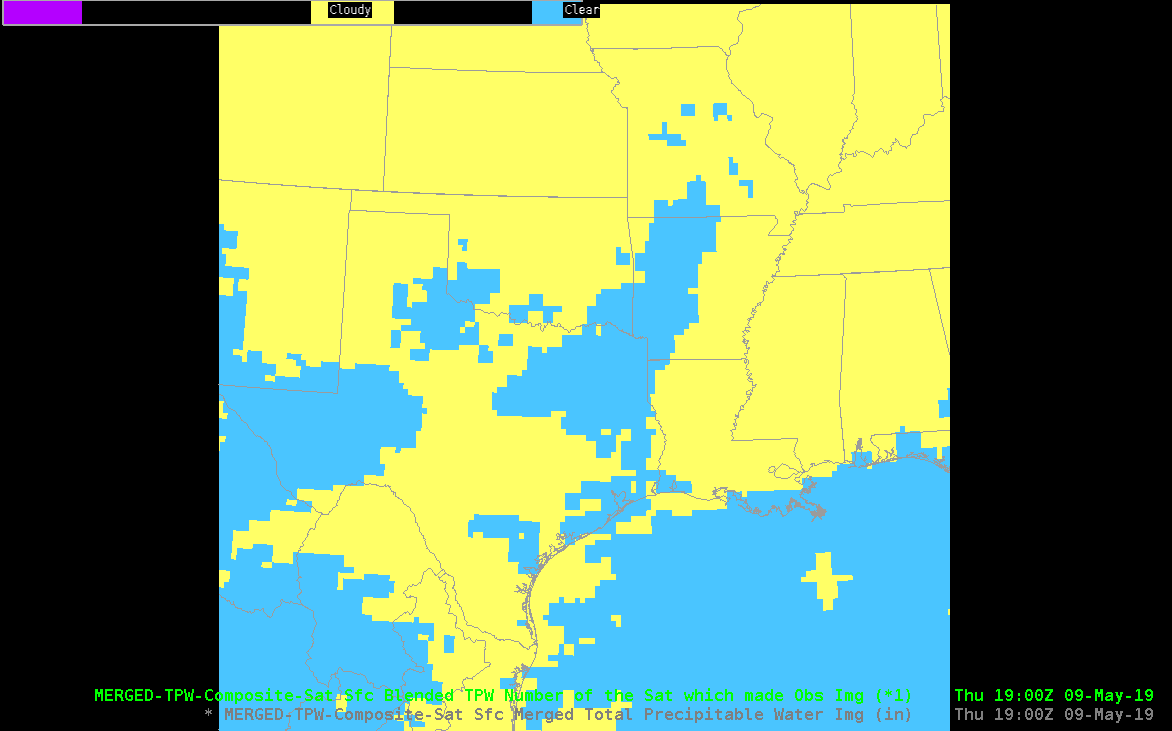
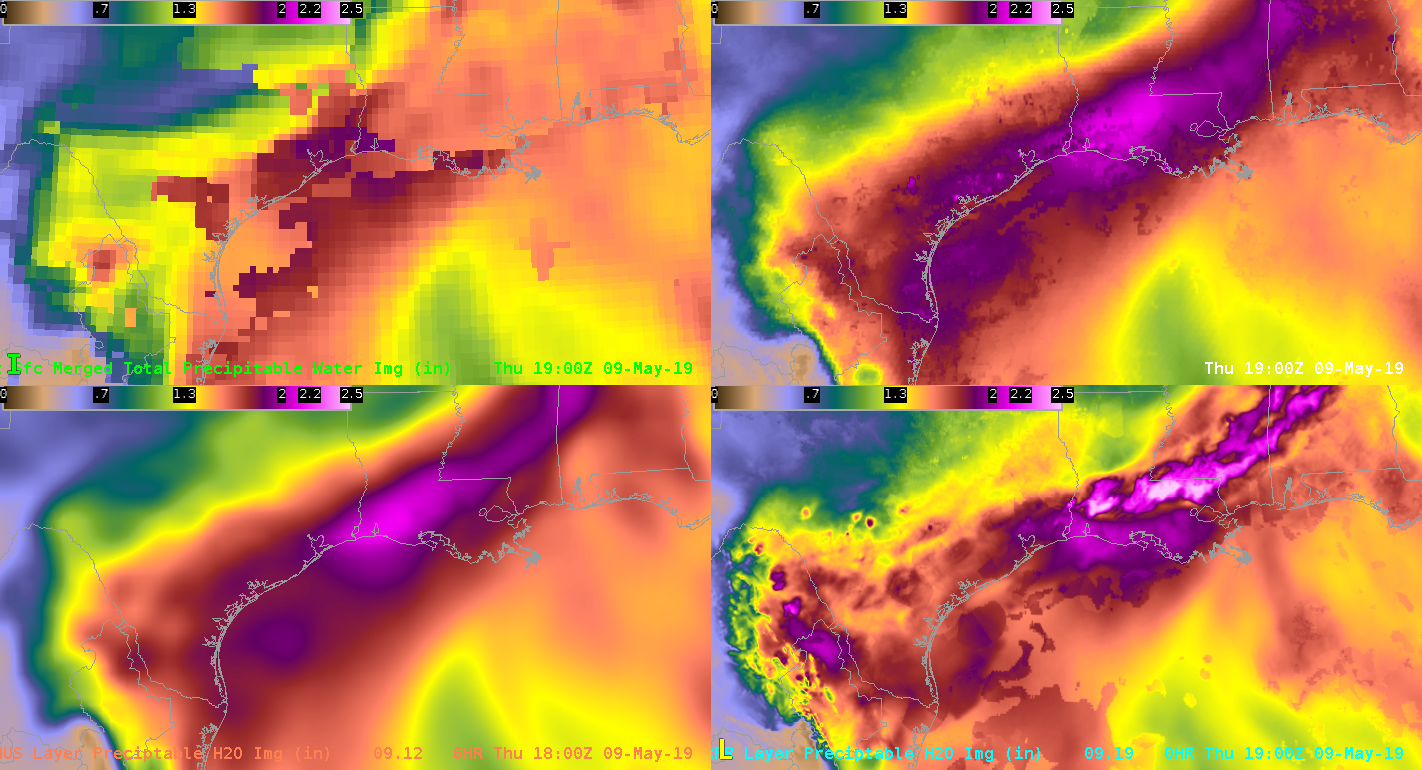
Analyses and forecasts all agreed well on the drier air over the central GOM.
JohnF
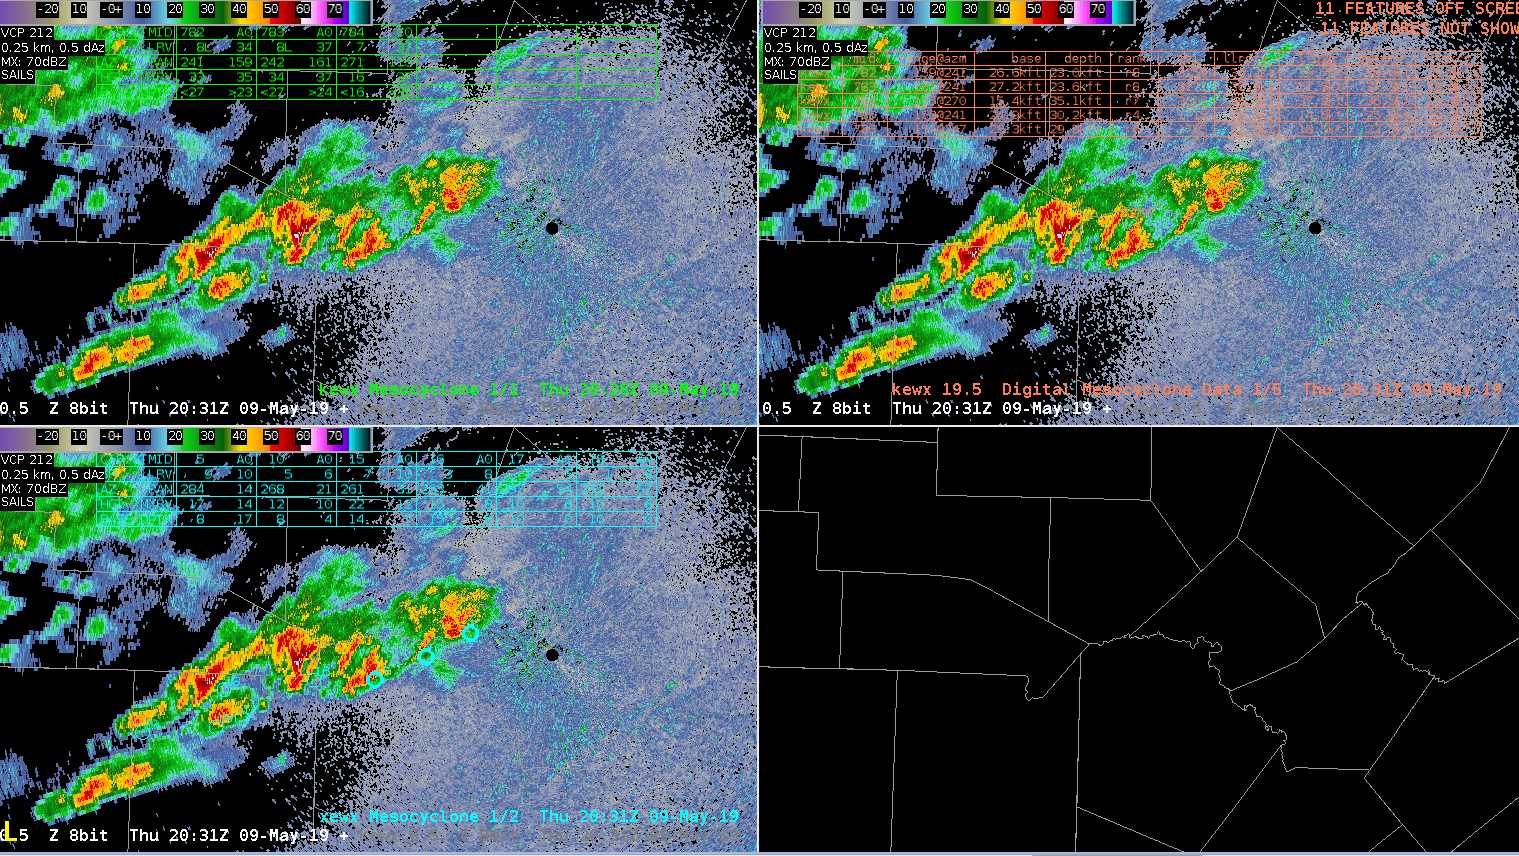
NMDA Tripped up by OutFlow Boundary
Example of NMDA (bottom left) from KEWX getting tripped up by an emerging outflow boundary while the legacy MDA/DMDA (top left and top right) were not.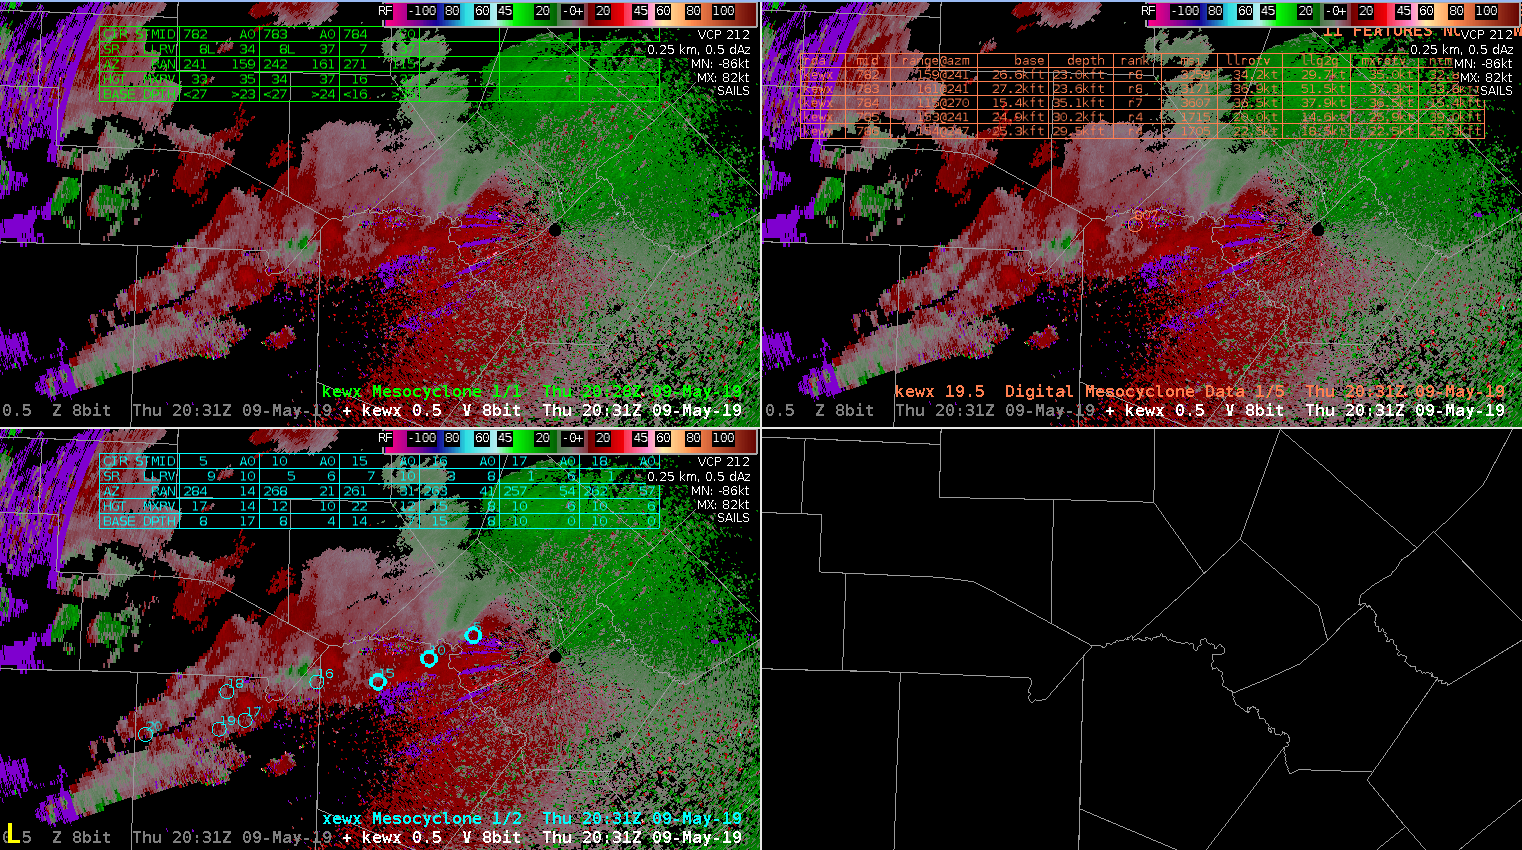
GLM Minimum Flash Area Indicates Convective Weakening
GLM Minimum Flash Area indicating potential weakening in convection. Larger area/extent is likely due to lightning along the anvil, and less localized/shorter distance also indicates potentially weaker updraft. Reflectivity in this example also confirms weakening of the convection.


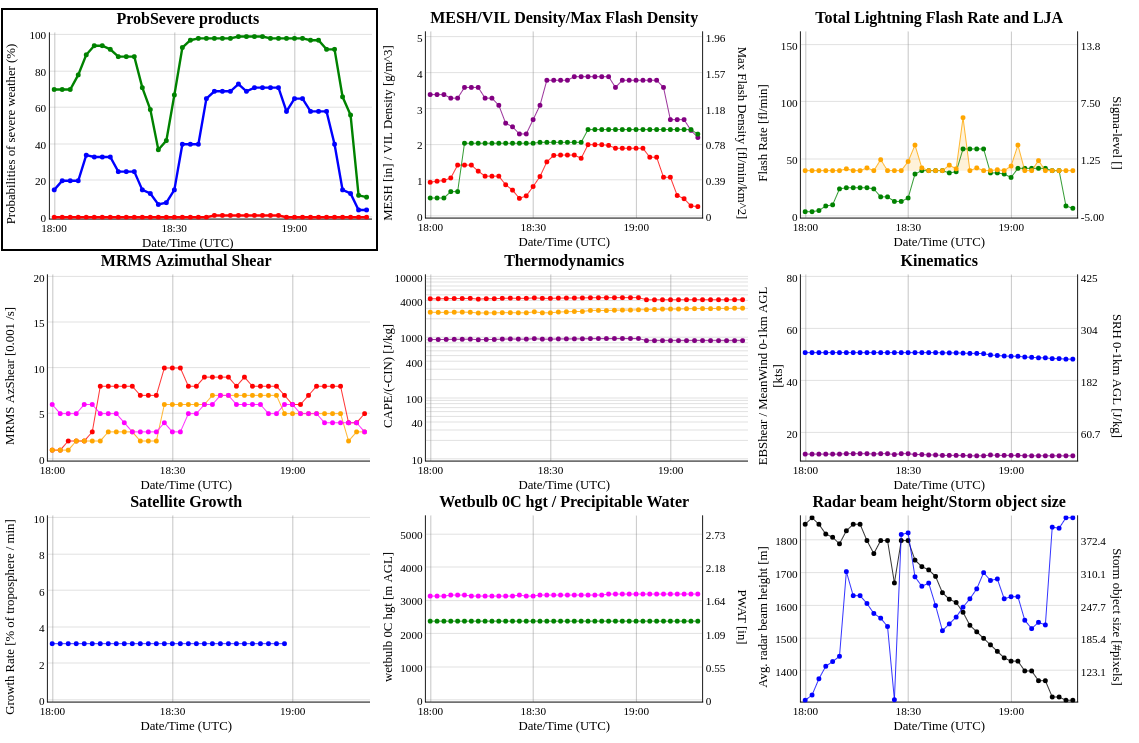
Downward Trend in ProbSevere Time Series & GLM Results in Warning Cancellation
A noted downward trend in the ProbSevere Time series along with a downward trend in the GLM products (not pictured) resulted in this warning forecaster to cancel a SVR for Kerr County early. This early cancellation may not have occurred had these products not been available, potentially leading to areas being unnecessarily warned for a longer amount of time.
HWT Issues SVR 3-Min Before Field Office Does Due to GLM & ProbSevere Data
A strengthening thunderstorm in Val Verde County was noted by Prob Severe and GLM data. The Average Flash Area and Minimum Flash Area values quickly increased in the area of a strengthening updraft across Val Verde County. The combination of these factors, along with a noted uptick in ProbSevere data, prompted the HWT warning forecaster to issue a SVR for Val Verde County at 1:25pm CDT with WFO EWX issuing a SVR for Val Verde at 1:28pm CDT. 


ProbSevere Time Series Used to Hold off on Warning Issuance
While the storm looked strong to possibly severe on radar, the trends in the ProbSevere Time Series were indicating a downward trend/weakening. Thus, I chose to held off on issuing a SVR. The storm did ultimately weaken (middle image compared to bottom image), as the ProbSevere Time Series was indicating.


Six Hours Later – Same Surging in All-Sky LAP TPW
At 2127 and 2157 UTC on 8 May (exactly six hours after it was previously noted), a surge in TPW in a cloudy region (Northeast TX region). This might be a predictable behavior in All-Sky LAP and points to improvement needed in how it handles new model cycles. Similar jump behavior was noted in All-Sky LAP CAPE.
2127 UTC 2157 UTC
JohnF.