messing around with NUCAPS in the volume browser

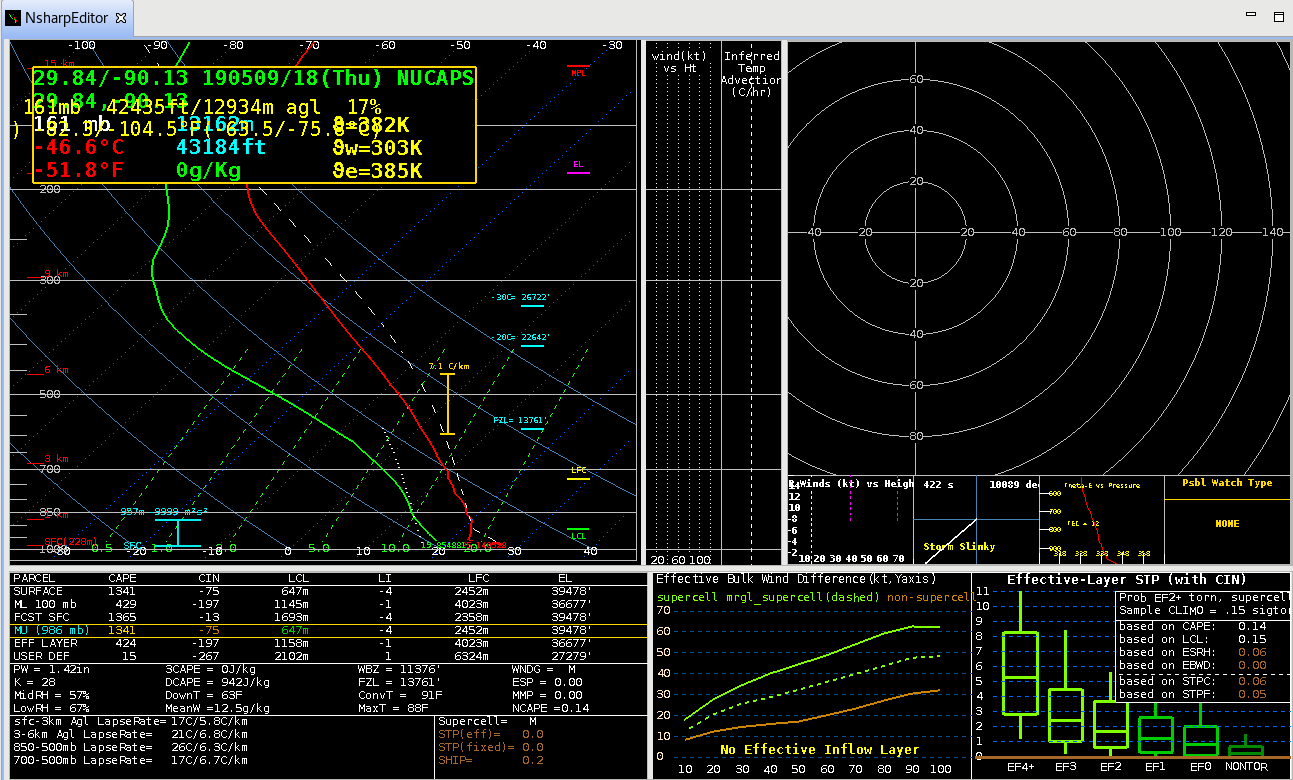
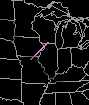
A first cut at depicting the added value of the volume browser in AWIPS for NUCAPS soundings is shown below. I messed around with vertical cross-sections and time series of NUCAPS soundings in the upwind area of the MCS in northern IL that is expected to contain some potential for new convective initiation. Below is  the transect of the cross-section.

Here is the cross-section of equivalent potential temperature from NUCAPS at 18Z, NAM-12 at 18Z, and the HRRR at 18Z.

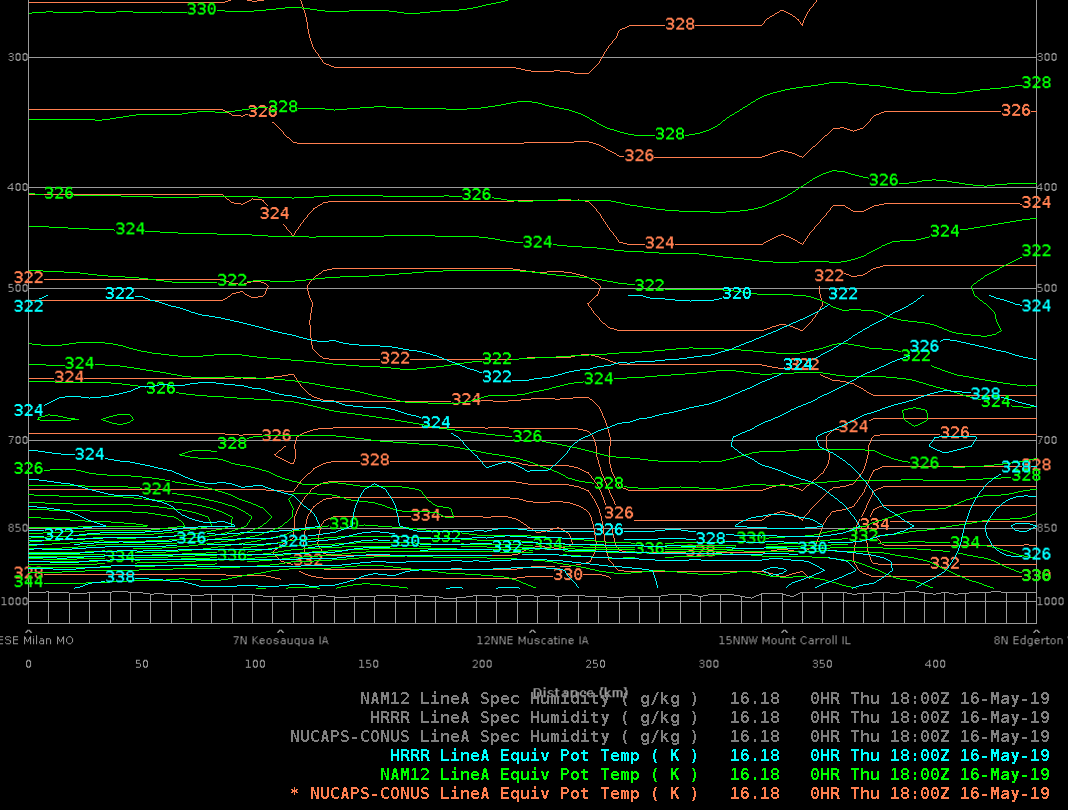
The two models and satellite soundings are in very good agreement at altitudes above 700 hPa, in less agreement between 700 and 850 hPa, and in poor agreement between 850 hPa and the surface. NAM12 is the highest with theta-e values between 336 and 344K, with HRRR about 5-10K colder, and NUCAPS still colder in the SW portion of the cross-section, and slightly warmer in the NE portion of the cross-section than HRRR.  Is it because of temperature or moisture differences?  It appears dominated by moisture discrepancies as shown below:

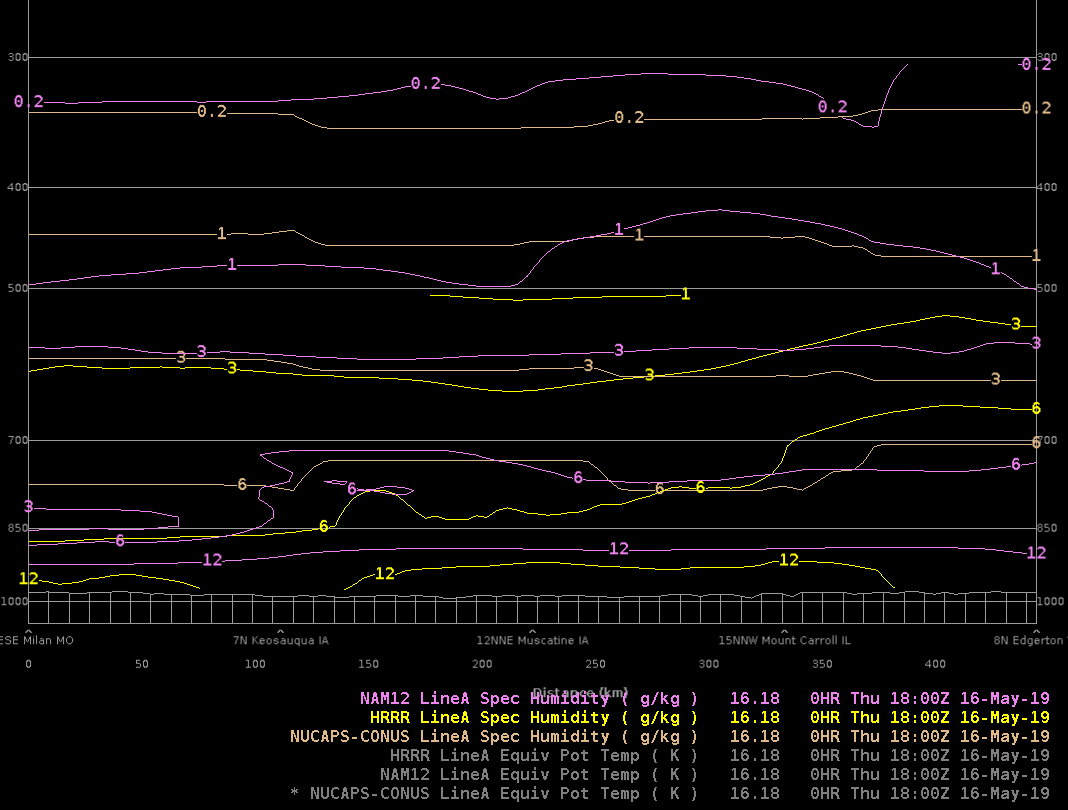
I can’t quite figure out how to plot additional (or fewer) contours (AWIPS newbie here) but its quite clear that NAM12 is the moistest and NUCAPS is much drier near the surface. The 12Z Quad Cities RAOB had 7-8 g/kg for water vapor mixing ratio but with the six-hour discrepancy it is challenging to establish ground truth.

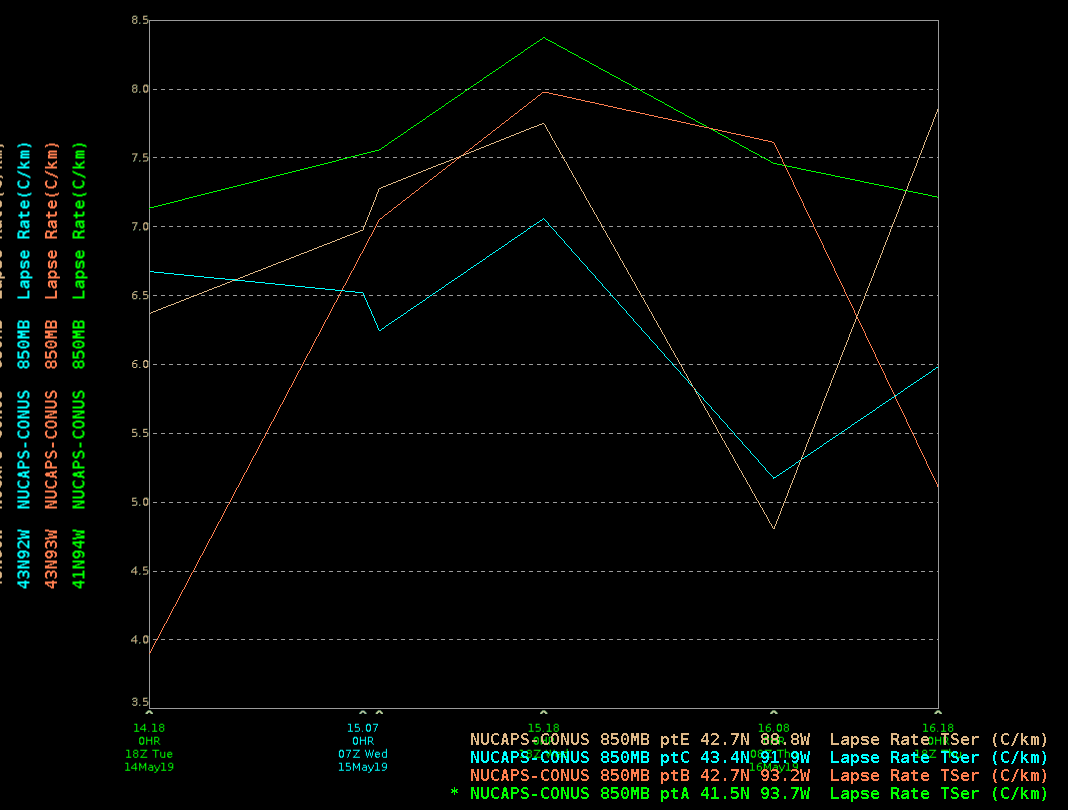
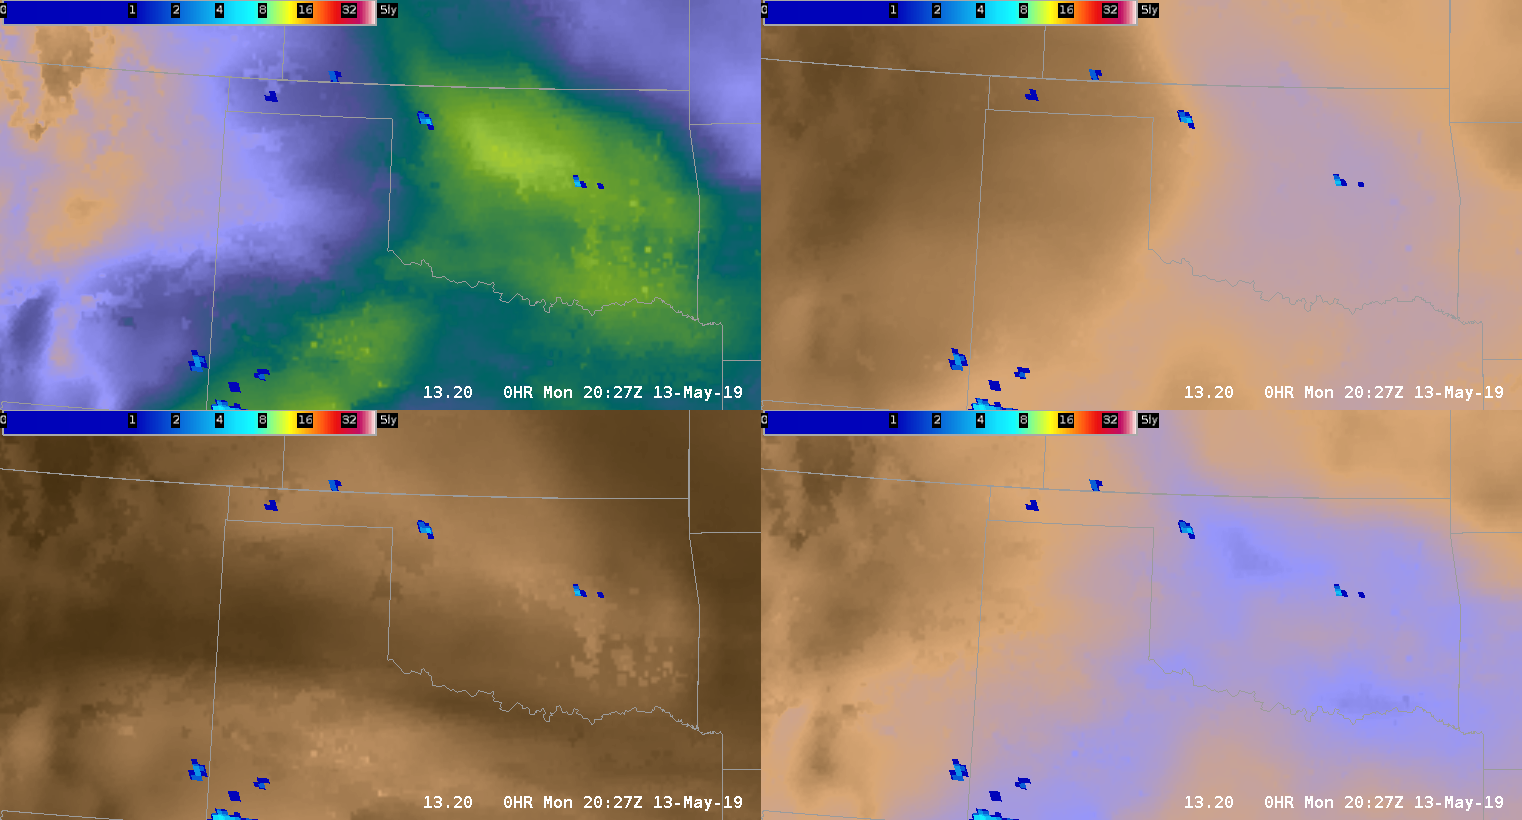
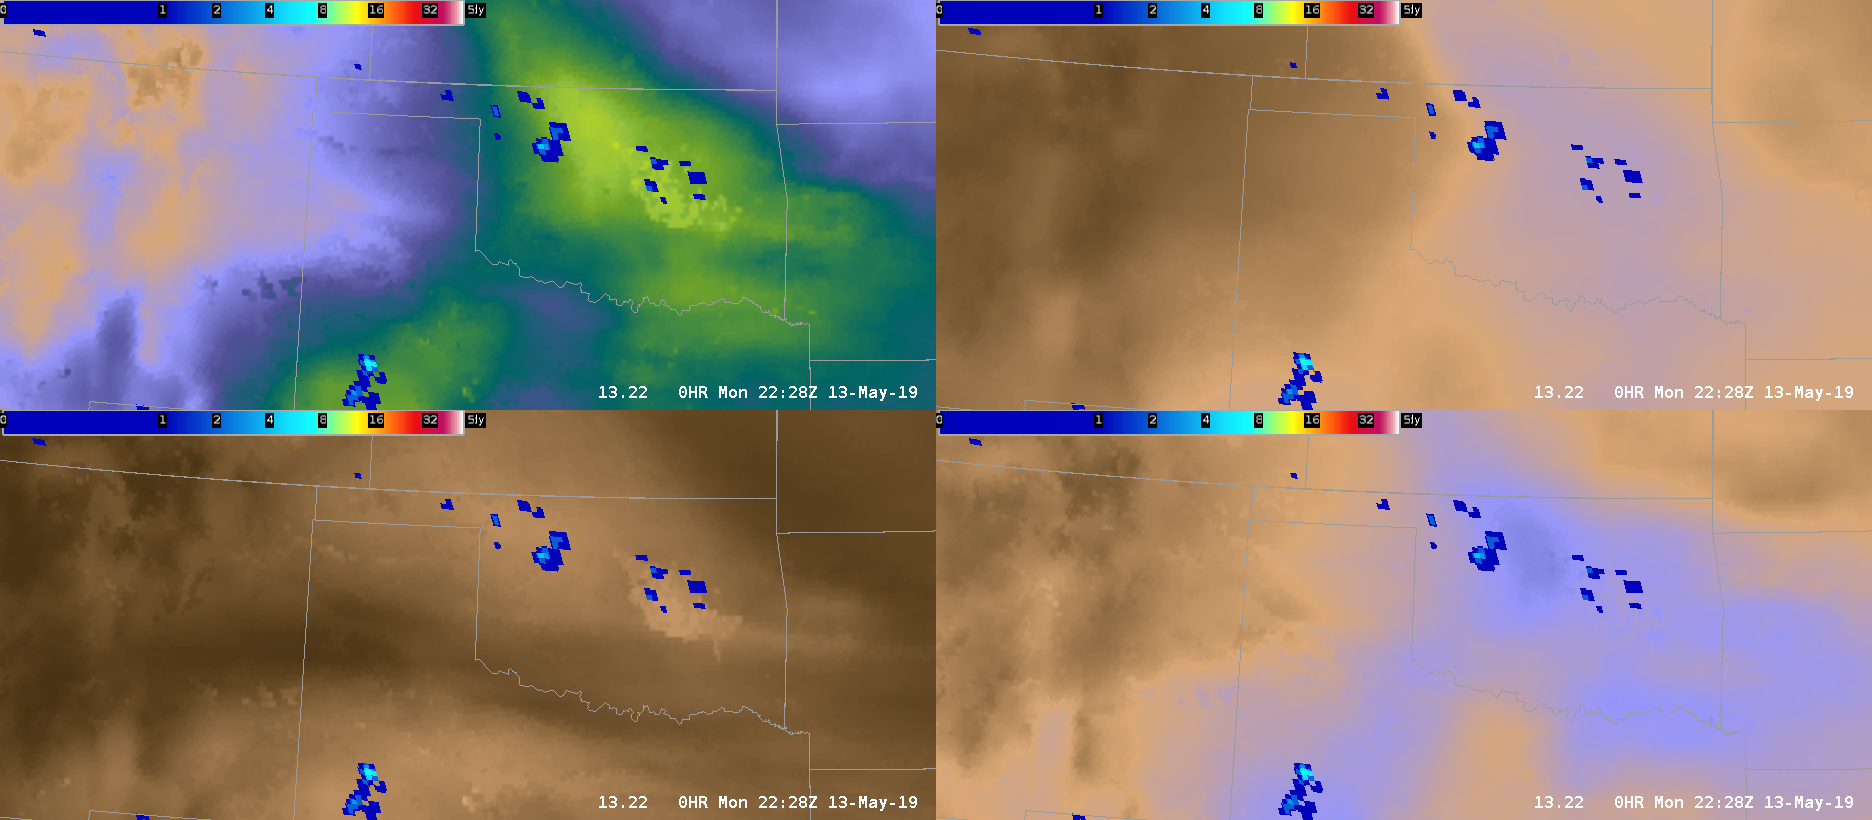
The volume browser is capable of making time series plots too.  Here is a ring of points depicting time series of 850 hPa temperature lapse rates over the last few days of soundings:

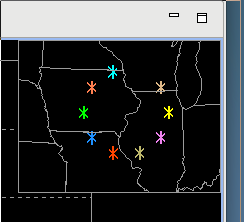
The time series plot is shown below.  A two-day time series of sparse satellite soundings  isn’t all that insightful, but using this for 0-6 hour NUCAPS-FCST products (in comparison to model output) might be quite valuable for forecasters.

Brian Kahn

NMDA sensitivity issues. No anticyclonic detection either.

This will be a great case study to follow up on with the NMDA:

As we were watching the differences between the NMDA compared to the MDA and DMD on a QLCS/squall event over east-central Illinois/northwest Indiana, we noticed some differences in circulation detection. Particularly, it was noted that the detection sensitivity was poor when there was a strong anticyclonic circulation present aloft (KIND ~100nm southeast of storm; 0.5deg; 12kft AGL). Interestingly, all 3 of the algorithms picked up on the weaker cyclonic circulation instead; all with different sizes and intensities.

See below 1847Z: MDA upper left, DMD upper right, NMDA lower left.

Image below 1854Z: As the storm progressed and started having a cyclonic rotation associated with the area of interest right next to an anticylconic area of rotation, the MDA (upper left), DMD (upper right), picked up that particular circulation first. The NMDA (lower left) was still slow to grasp onto this very strong circulation aloft that could have a Severe lead time significance as the rear inflow and convergence strengthens.

Looking several radar scans forward now below (1900Z), the NMDA finally recognizes significance of this large feature (see below; lower left panel). However, it is still does not signify a strong circulation as denoted by its tiny circle. I’m curious about LSRs during this time.

Finally, 16 min later (1916Z see below; 11kft AGL), the NMDA finally shows a significant circulation center due to a strong descending rear inflow jet/notch. I would suggest that the NMDA does not give me a lot of lead time confidence in issuing a severe thunderstorm warning in this instance (probwind showing over 90% at this time). NMDA only seems to help give confidence once it detects the feature after it has already evolved. What’s also interesting to note from the below image is that the DMD and MDA picked their denotations on (only) the cyclonic circulation, whereas the NMDA only seems to centrally focus on a weird convergence region and not the cylconic side of this lowest scan velocity data (i.e. more localized for NMDA). None of the products seem to attract to the anticyclonic side, which actually strengthens with time due to the descending notch. -shearluck

IDSS Usage from GLM/Minimum Flash Area

An MCS shifting southeastward across northern IL was producing quite a bit of lightning, and much of it was moving through the southwest portion of the line per Flash Extent Density. From a IDSS standpoint, the Minimum Flash Area and FED proved that it’s necessary to look at both GLM products and ground based lightning products to see the “total” picture. The GLM products captured a larger flash that extended out into the stratiform area behind the main line that is not seen in the ENTLN and NLDN products. This information can be especially important for Airport Weather Warnings and/or outdoor venues. You can easily see that the flash extends almost back to the Rockford Airport, while the main line and most of the flashes are ~80 miles away. In other words, areas near Rockford Airport are not out of the woods yet for lightning.

Clockwise from top left: RALA, Minimum Flash Area, NLDN and ENTLN Lightning Plot, Flash Extent Density

-Tempest Sooner

NMDA QLCS Anticyclonic Meso

A strong anti-cyclonic mid-level meso developed near the southern end of a QLCS south of Chicago (view form KLOX). NMDA did not pick up on this feature. Would definitely want to have this detection since a warning forecaster may not quickly pick-up on a developing mid-level circulation if they are closely watching for low-level mesovortex spinups, and this may be important in hail development as well as focusing and outflow wind surge.

11 minutes later on the 0.5 degree tilt, one the developing rear inflow jet starts to develop, the NMDA keys in the developing low-level cyclonic circulation. However, the additional 11 minutes of being alerted to the developing mid-level meso could help extend warning lead times.

— warmbias —

Convection on LL PW Gradient

Convection began along a low level PW gradient across NW OK per GLM Flash Extent Density. Expected forecast: Based on steering flow, the storms should move into a more moisture rich environment and expand in coverage.

2027Z Upper Left: TPW, Upper Right: Sfc to 0.9 sigma PW, Bottom Right: 0.9 to 0.7 sigma, Bottom Left: 0.7 to 0.3 sigma PW

A little while later…Storms continued to expand eastward along the gradient into the more moisture rich environment.

2228Z Upper Left: TPW, Upper Right: Sfc to 0.9 sigma PW, Bottom Right: 0.9 to 0.7 sigma, Bottom Left: 0.7 to 0.3 sigma PW

-Tempest Sooner

Event Density with RGB Composite VIS/IR Sandwich

Image 1 shows the  GOES16 RGB Composite VIS/IR Sandwich.  This product displays the texture of the convective cloud tops and the temperature of those cloud tops.  The texture and temperature of the clouds provides information about the updraft.  The 2nd image shows the most intense GOESR GLM event densities and how they correspond with the taller clouds and strong updrafts. – Jonathan W. Smith (ESSIC/UMD) .

unstable NUCAPS soundings east-southeast of TX convection

The 1921Z NOAA-20 overpass is now in and there are many valid soundings to east-southeast of convection in west Texas. Several soundings indicate CAPE above 1500 J/kg with a few soundings over 2000 J/kg. Below is a short loop of GOES-16 channel differences between 1.6-2.1 microns and the NUCAPS sounding quality control.

The black circle indicates the selected NUCAPS sounding depicted below with MUCAPE of 2188 J/kg.

This sounding (centered on Edwards County) as well as neighboring soundings were obtained over fairly homogeneous terrain and surface topography doesn’t appear to be complex and therefore problematic for near surface layers. These soundings are near the edge of the NOAA-20 swath, thus they are much larger than the nominal 45-km spatial resolution at the center of the swath.

Brian Kahn

Storm Trends – ProbSevere

While the storm looked strong to possibly severe on radar, the trends in the ProbSevere Time Series were indicating a downward trend/weakening. Thus, I chose to held off on issuing a SVR. The storm did ultimately weaken, as the ProbSevere Time Series was indicating. Note, in the image, the warned storm on the right has lower probs, but was stronger in earlier scans and had produced severe hail.

GOES 16 – Full Disclosure

Ok, last post….honesty time.

I didn’t make this a secret in my application that I had been out of meteorology for about 4 years between 2014-2018. During that time, GOES-16 launched. As I returned to broadcasting, I didn’t adequately spin-up on the new capabilities of this new generation of satellites. I was aware of the spatial and temporal resolution improvements of course – what meteorologist – currently working in or out of the field, didn’t get excited about 1 minute imagery?

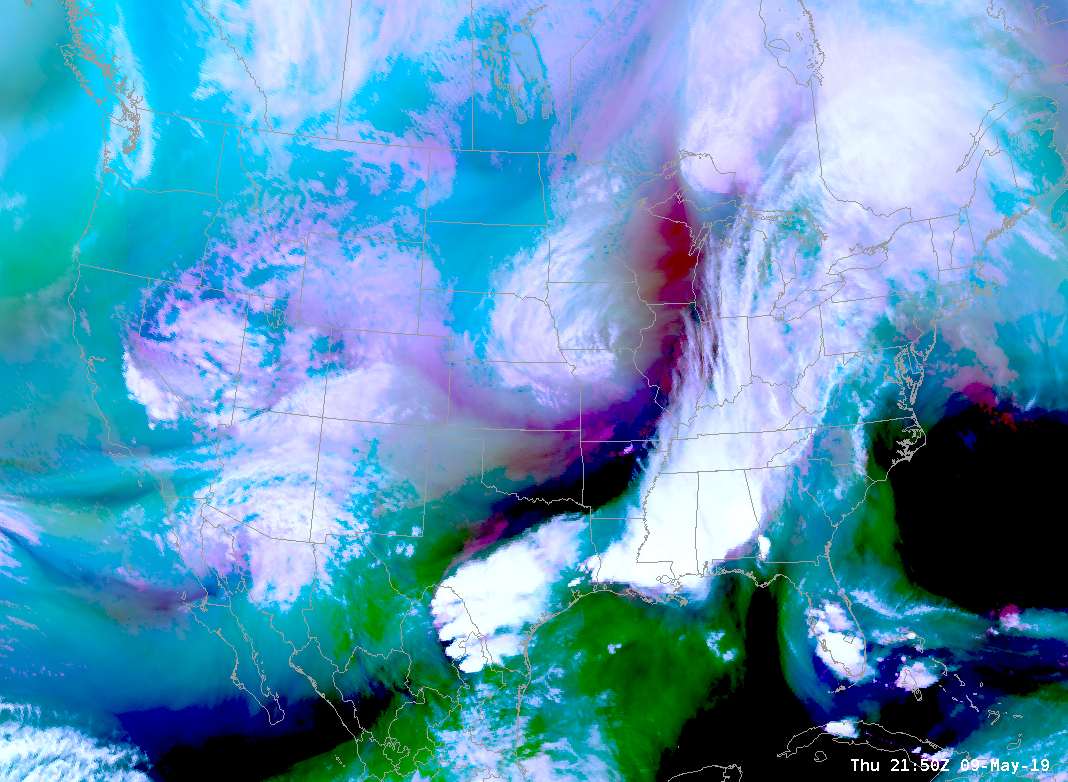
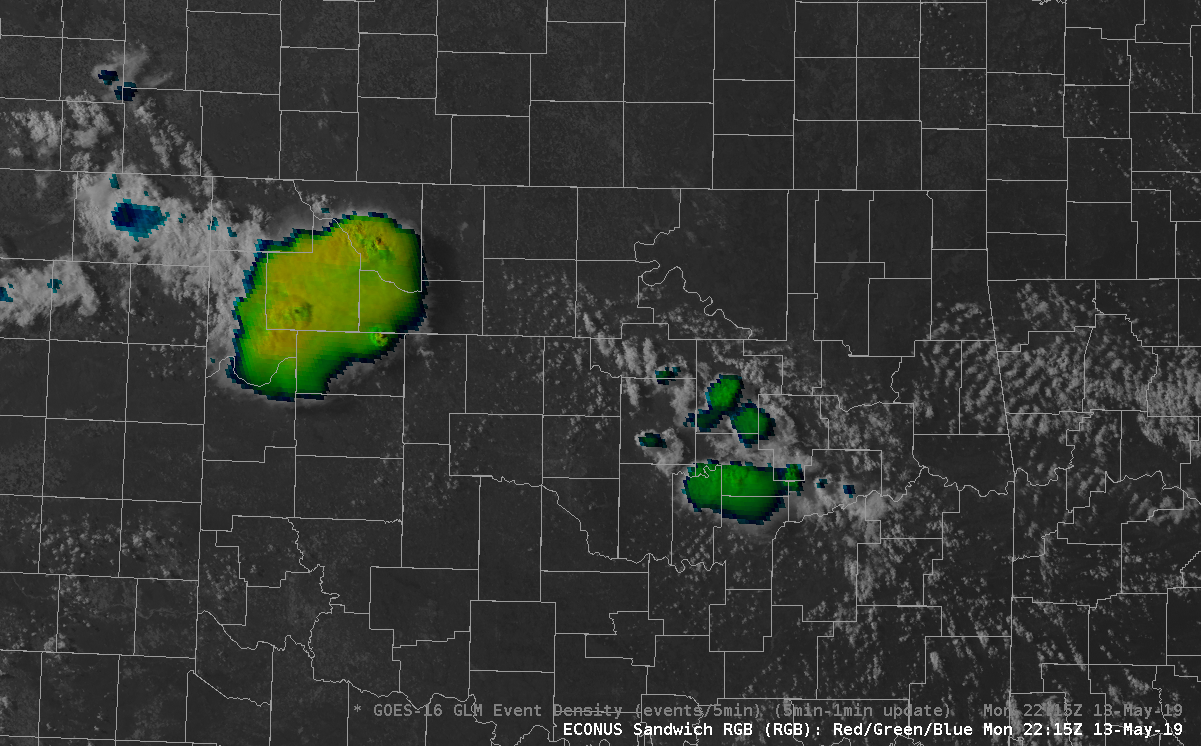
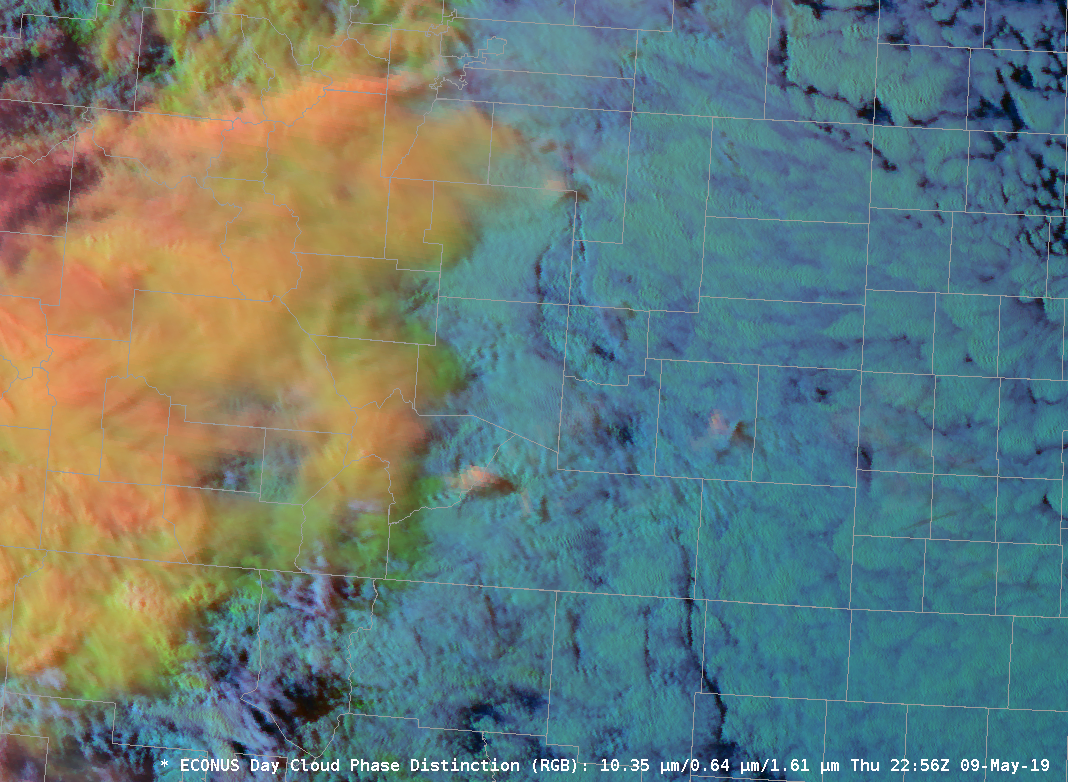
However, I wasn’t aware of some of the RGB combinations that I’ve been exposed to here at the HWT. The features that can be picked out by applying coordinating colortables to multiple channel views is simply astounding. I’ve used the simple water vapor, day cloud phase distinction, day convection, differential water vapor RGBs this week….I’ll be making a phone call to my broadcast weather vendor. I know I’ll need to get some other broadcasters on board with me to lead a charge, but count me in. Until then, I’ll be livin on the CIRA RMMB Slider site!

Color (RGB) Me A Fan!

-icafunnel

NUCAPS Comparison with Special 17Z Sounding

Today we were tasked with the LIX CWA (New Orleans/Slidell, LA), and the NUCAPS sounding went overhead at 1824Z. Luckily there was a special sounding out of the LCH (Lake Charles, LA) office at 1700Z so there was at least a loose chance to compare the data. So, let’s do just that! First the LCH sounding…

Shows a relatively unstable atmosphere with decent lapse rates in the mid-levels.  And now the nearest good-value NUCAPS sounding (taken just north of Vermilion Bay)…

The two soundings aren’t an exact comparison, they aren’t in the same location or taken at the same time, but synoptically it should be a pretty similar environment ahead of the broken line of storms moving into the area. The biggest problem comes in the boundary layer with values that are way off. The profiles were showing a 2m value of 76/70 when in the observed sounding it was 82/75. Given that the sounding was taken earlier in the day, it’s troublesome that the temps were much higher than the NUCAPS sounding. Unfortunately, modified soundings were not available on this day and given the unmodified soundings inability to correctly analyze the boundary layer, it makes trusting any surface derived data near-impossible. The only application I can see for these soundings are to analyze the upper-level synoptic environment (i.e., upper-level lapse rates, relative humidities, etc.) For this, you can compare some values… 850-500 Lapse Rate was 6.1 C/km in the NUCAPS sounding it was 6.7 C/km, some variability is expected and it’s not too bad but the difference is worthy of caution. In the gridded product somehow the Lapse Rate was 6.48 C/km, much better given the expected variability but I’m not sure these values are different. Are the gridded data not derived from the soundings or vice versa? Mid-level RH in our LCH sounding is 90%, yet in our NUCAPS sounding it’s 79%. I’d expect these values to be a bit closer given the strengths of NUCAPS, but it’s close enough to perhaps chalk up to differences in space and time.

Afterwards, I saw that LIX also had a Special Sounding that could be comparable, I’ll leave the comparisons below…

#ProtectAndDissipate