The Aggie Tornado From a Shower

PRIOR to the Milam/Burleson County tornado warnings that you can read about below in other blog posts there was a tornado near the Texas A&M Campus in College Station. See these tweets:

  • https://twitter.com/cgar1999/status/1121171711855034370
  • https://twitter.com/jeanette_wx/status/1121171983633350661
  • https://twitter.com/KAGSnews/status/1121205013236391938

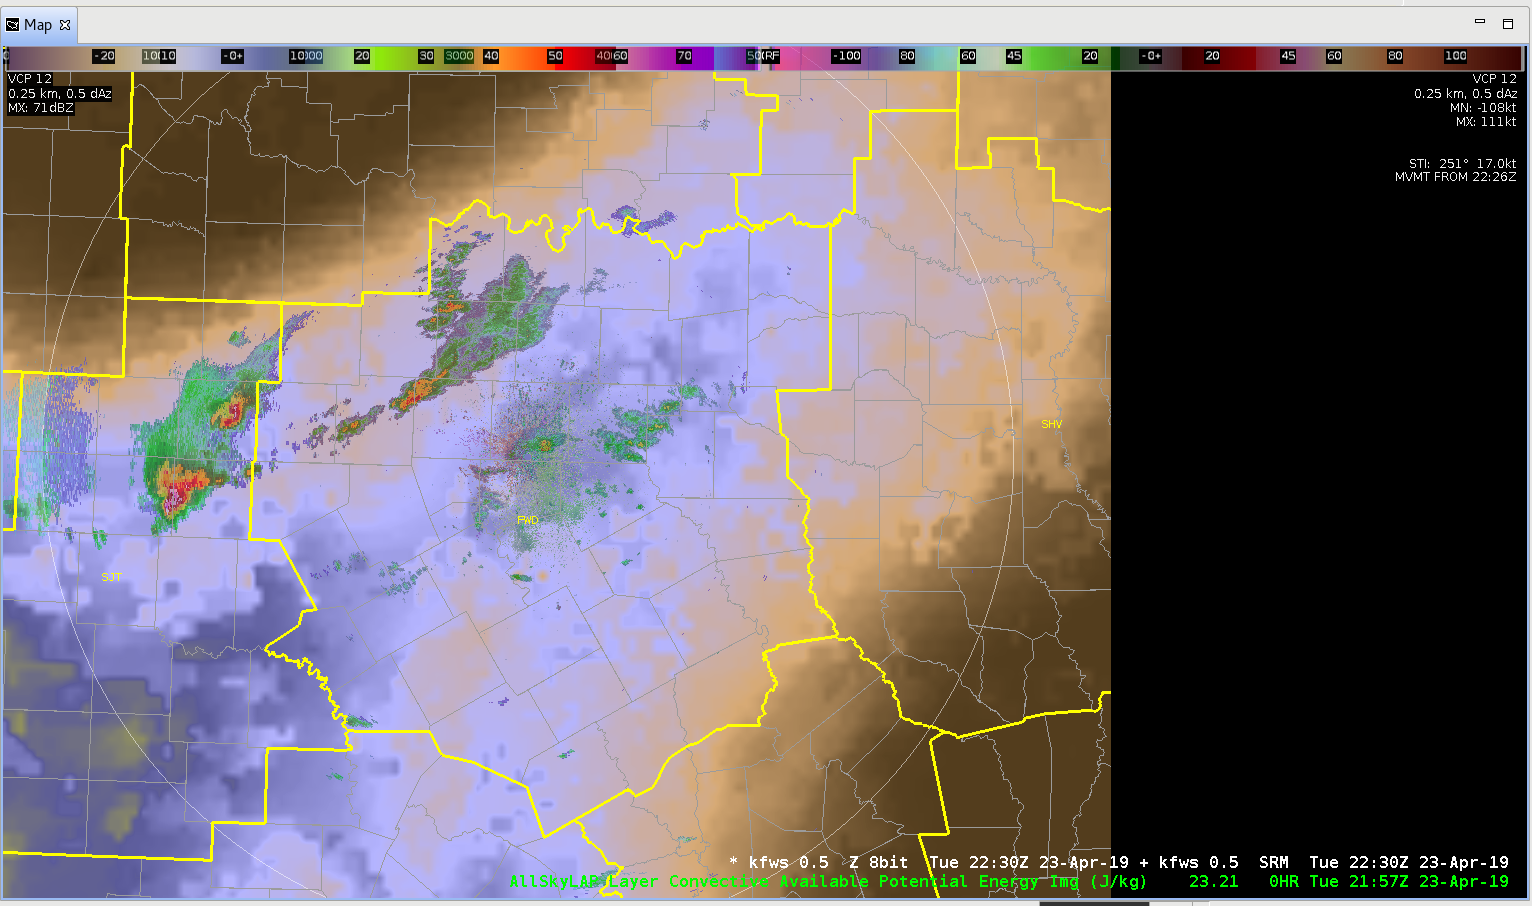
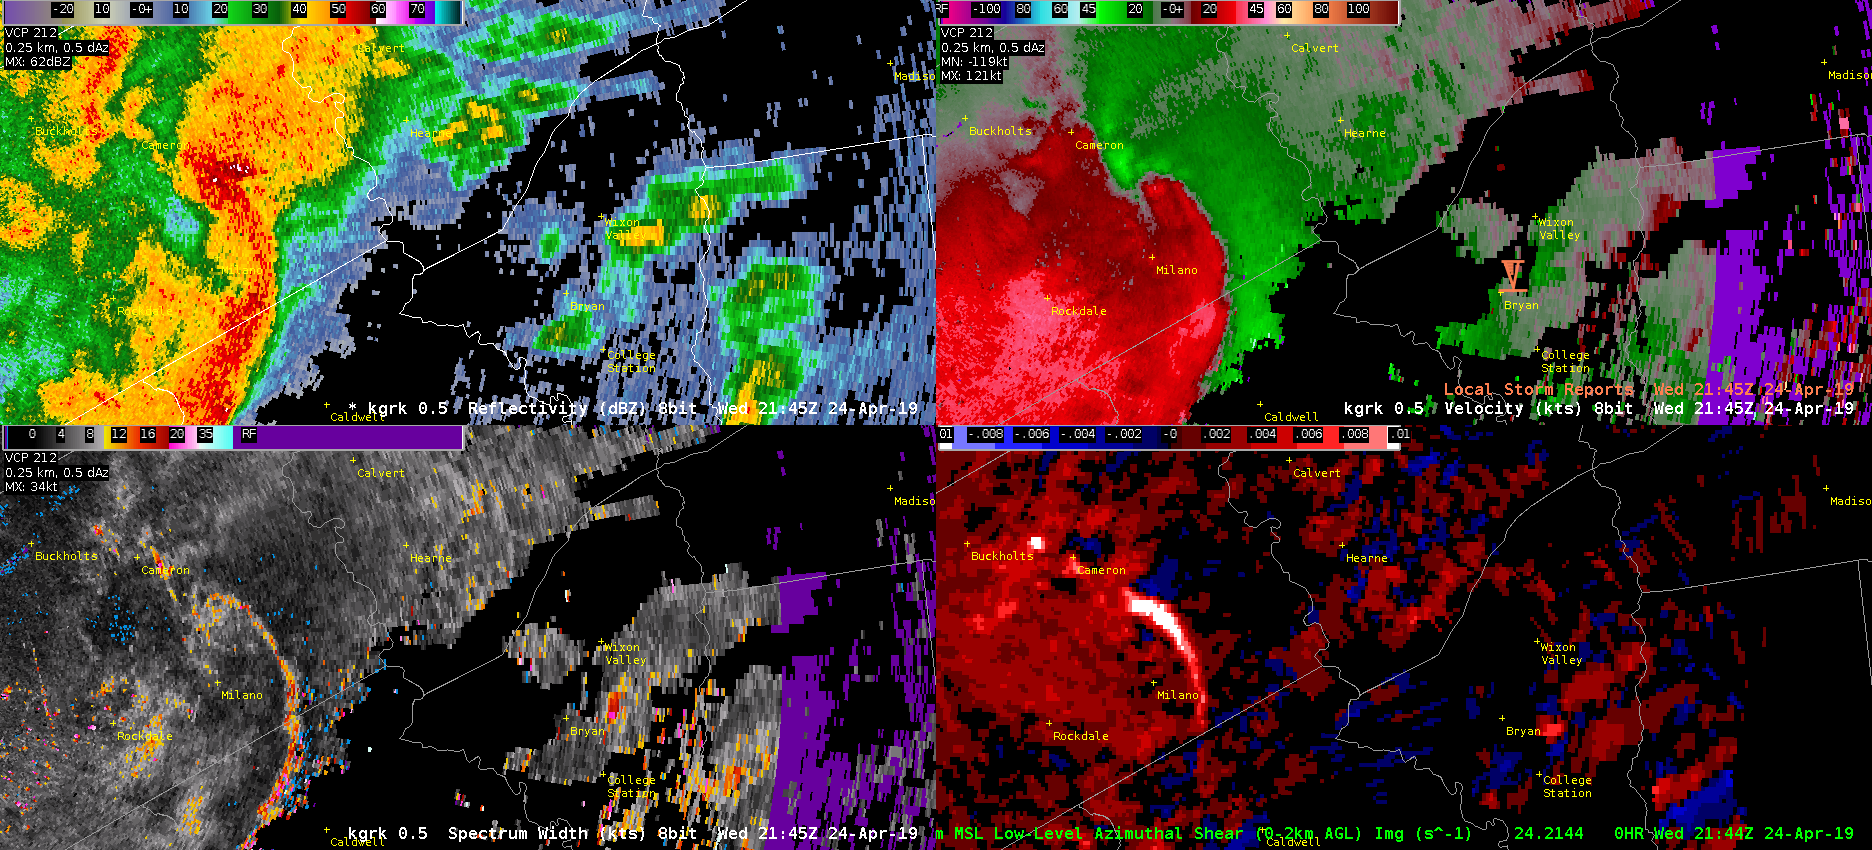
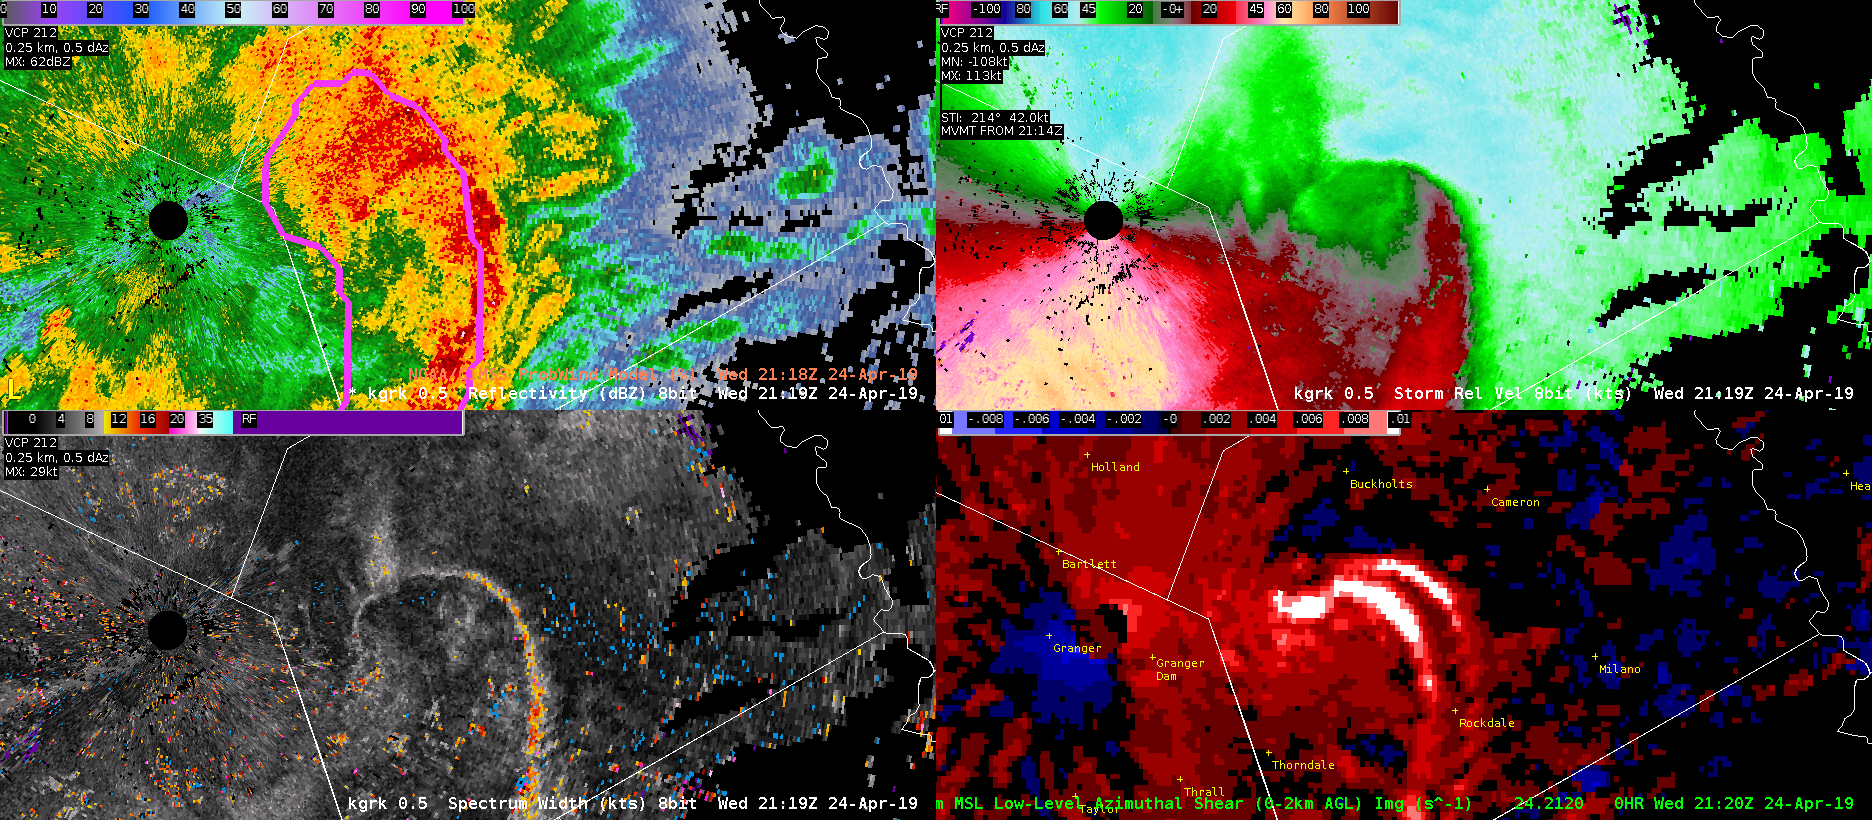
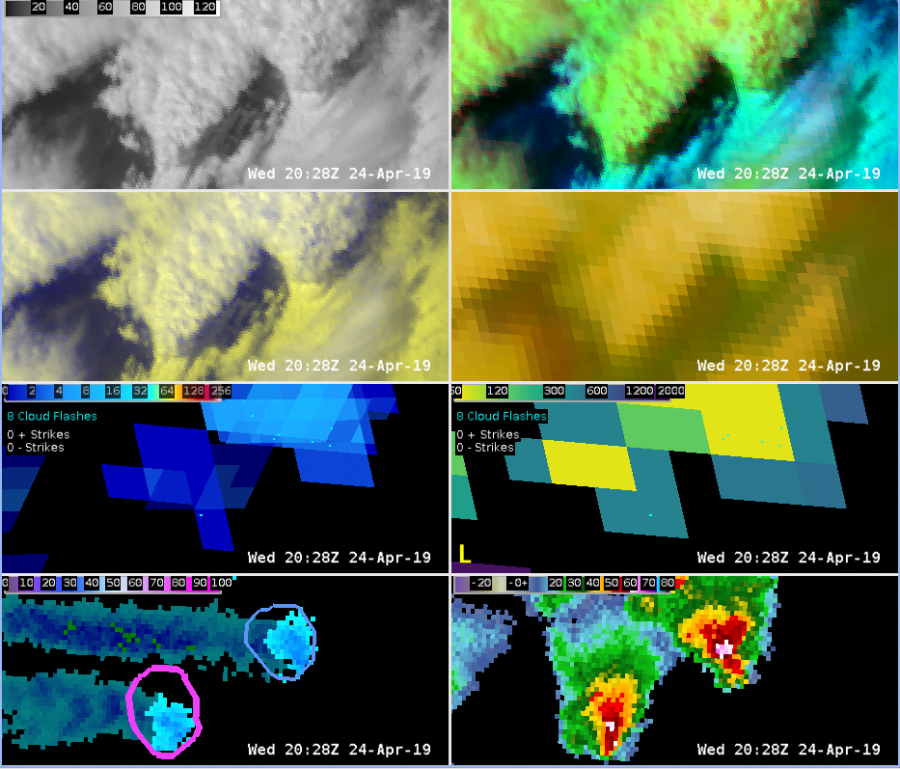
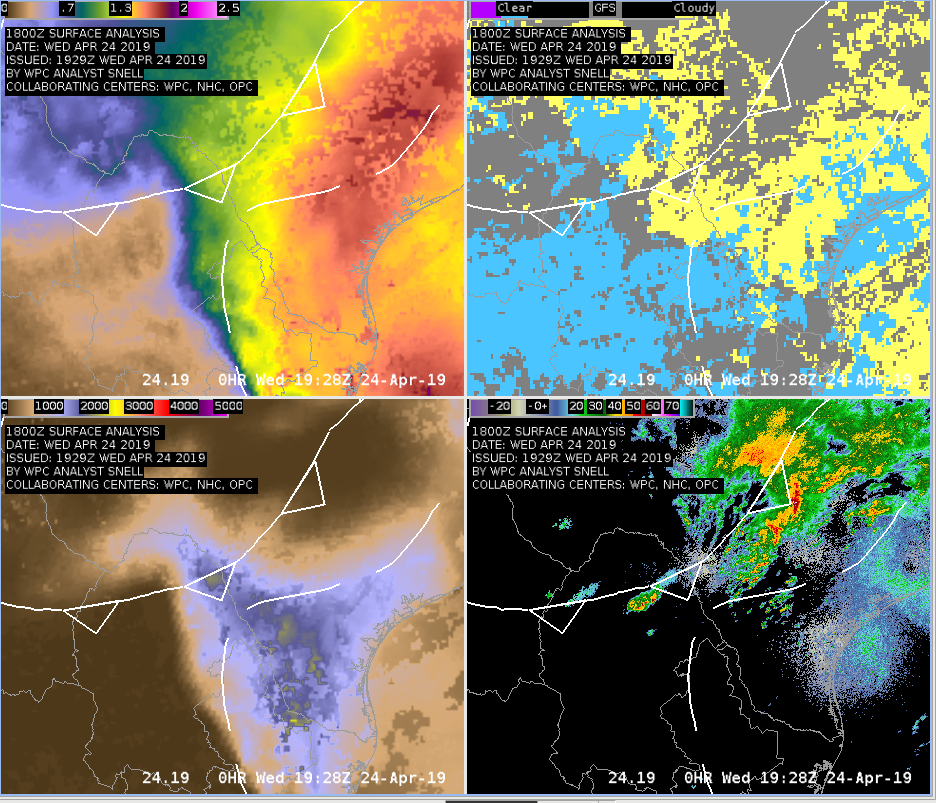
If you looked at the image below you would not really be concentrating on the storm (I use the term ‘storm’ loosely) near College Station on the right side of each panel. Based on velocity, AzShear, Reflectivity your focus would be the bowing line segment to the west that would soon produce gate-to-gate velocity signatures south of Hearne.

If you were to zoom into Bryan-College Station though a few things begin to jump out at you. Mainly the high Spectrum Width, the relative maxima in AzShear, and a VERY weak couplet looking signature in velocity (look near the blue Tornado Icon). This is the time that the tornado was reported. The good news is that Spectrum Width picked up on the turbulence in the storm, and AzShear does have a local max, but the values are only 0.007 s^-1 compared to 0.014 s^-1 at the bookend vortex to the west. This scale only goes from 0 to .01 s^-1.

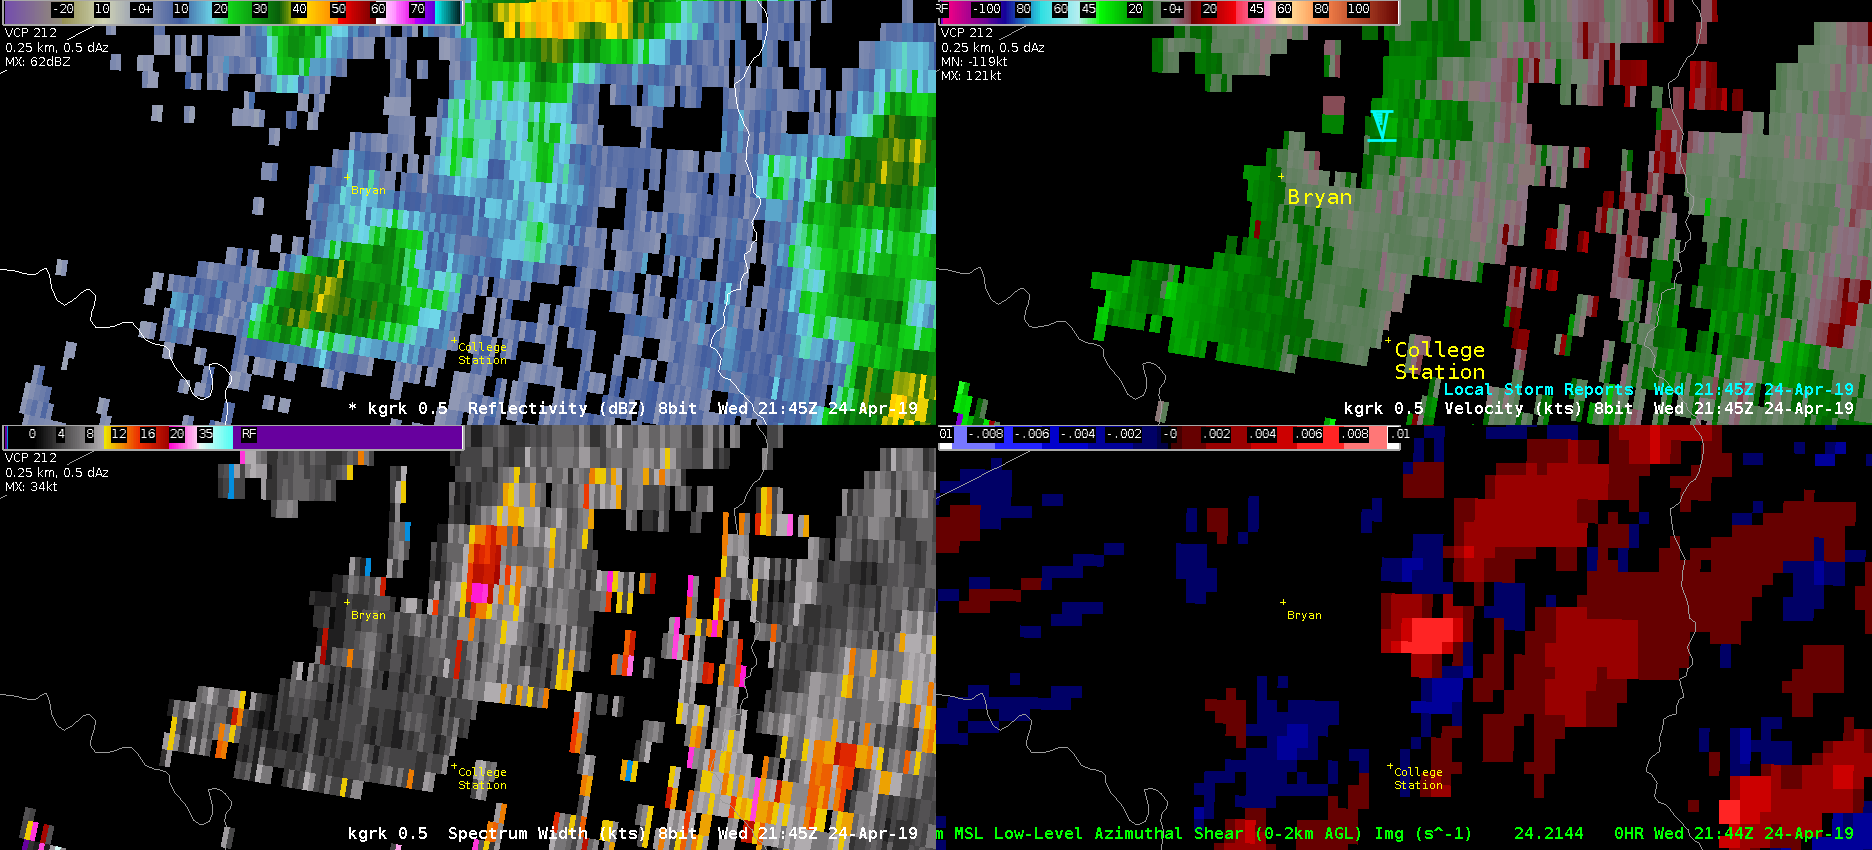
The velocity signature does get slightly better in the 2149z. This is probably a quick spin up due to boundary interaction, but it is shocking that this little SHOWER produce the tornado when the larger storms to the west produced NO reports as of  now (0026z). The good news is that there were local maxes in the AzShear and SW, but not enough that these would be your focus of course.

ProbSevere never pinged the storm…and there were other indications in velocity, AzShear, and SW with other showers that were similar to the tornadic College Station storm. Oh the joys of quick spin up tornadoes due to boundary interactions in Central Texas!

-Alexander T.


Tornadic Supercell and AzShear and ProbTor Ramp-Up

The storm along the Milam/Burleson county line began to wrap up showing increasing Merged 0-2km AzShear and a stronger velocity signature. From 2204z – 2208z there was a brief couplet from this storm and the FWD and HGX offices, and the HWT forecasters all tornado warned this storm. You can see the Spectrum Width maxima at the point of the couplet and along the leading edge of the bowing segment to the south of the couplet. There is also an inflow notch as well all situation near the bookend vortex. The big thing to note is how the AzShear Merged product ramped up from 2154z to 2204z. This also impacted ProbTor. The trend went from:

  • 2149z: ProbTor 11%
  • 2154z: ProbTor 60%
  • 2159z-2206z: ProbTor 84%
  • 2208z-2212z: ProbTor 86% (2207z is when WFO FWD issued their warning)

ProbTor maxed out at 87% from 2216z-2218z while the couplet became less gate-to-gate. If you used a ProbTor threshhold of 60% that would have given 15 minute additional minutes of lead time, while a threshold of 80% would have given approximately 8 more minutes of lead time. As of writing this blog (2240z) there are no LSRs reporting anything in terms of damage or tornadoes with this storm.

-Alexander T.


GLM Products Identify Hook Echo

In our NWS Corpus Christi Warned Storm (ACTUAL NWS CC) The GLM did a fantastic job of identifying the rain wrapped hook echo. I’ve attached visuals and corresponding velocity. Just thought it was pretty neat. The satellite and radar imagery was a little too busy to define it as nicely as the GLM did.

-lakeeffect

ProbSevere Large Areas Impacting Threat Percentages

With this storm going through Milam and Burleson Counties in South Central Texas ProbSevere is saying 90%+ for ProbWind and only like 15% ProbTor. One possible reason for the lower ProbTor may be the large area that ProbSevere is tracking as one storm. Yes, it certainly is one large bowing line segment, but if you look at the AzShear Merged data in the lower right you can see localized maxima in Milam County. While there is not a defined couplet at this point there is some bookend vortex action going on in the area of the AzShear maxima. If the ProbSevere was broken into two different areas would the ProbTor and/or ProbWind be even higher for the Milam County storm due to the locally higher AzShear? I would say probably so! Because ProbSevere is encompassing the entire line segment the values of AzShear going into ProbSevere are probably dampened some from the less active southern part of the storm.

-Alexander T.

GLM MFA for Storm re-generation

GLM 
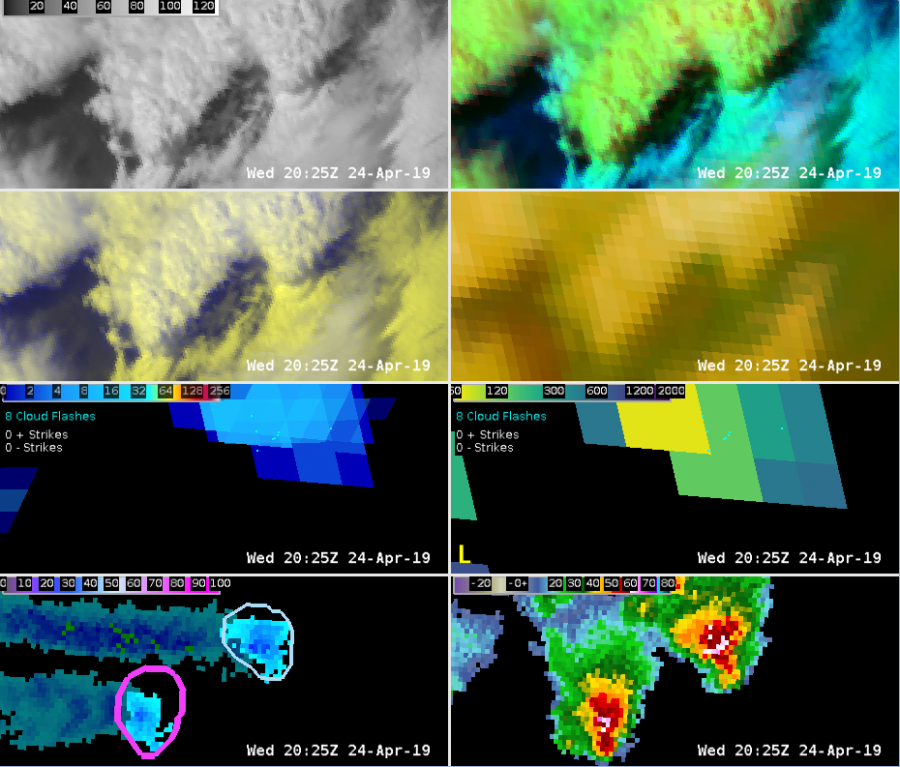
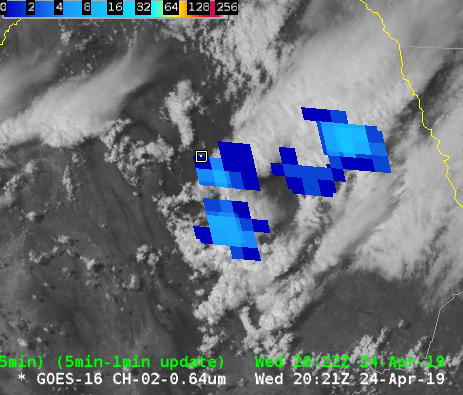
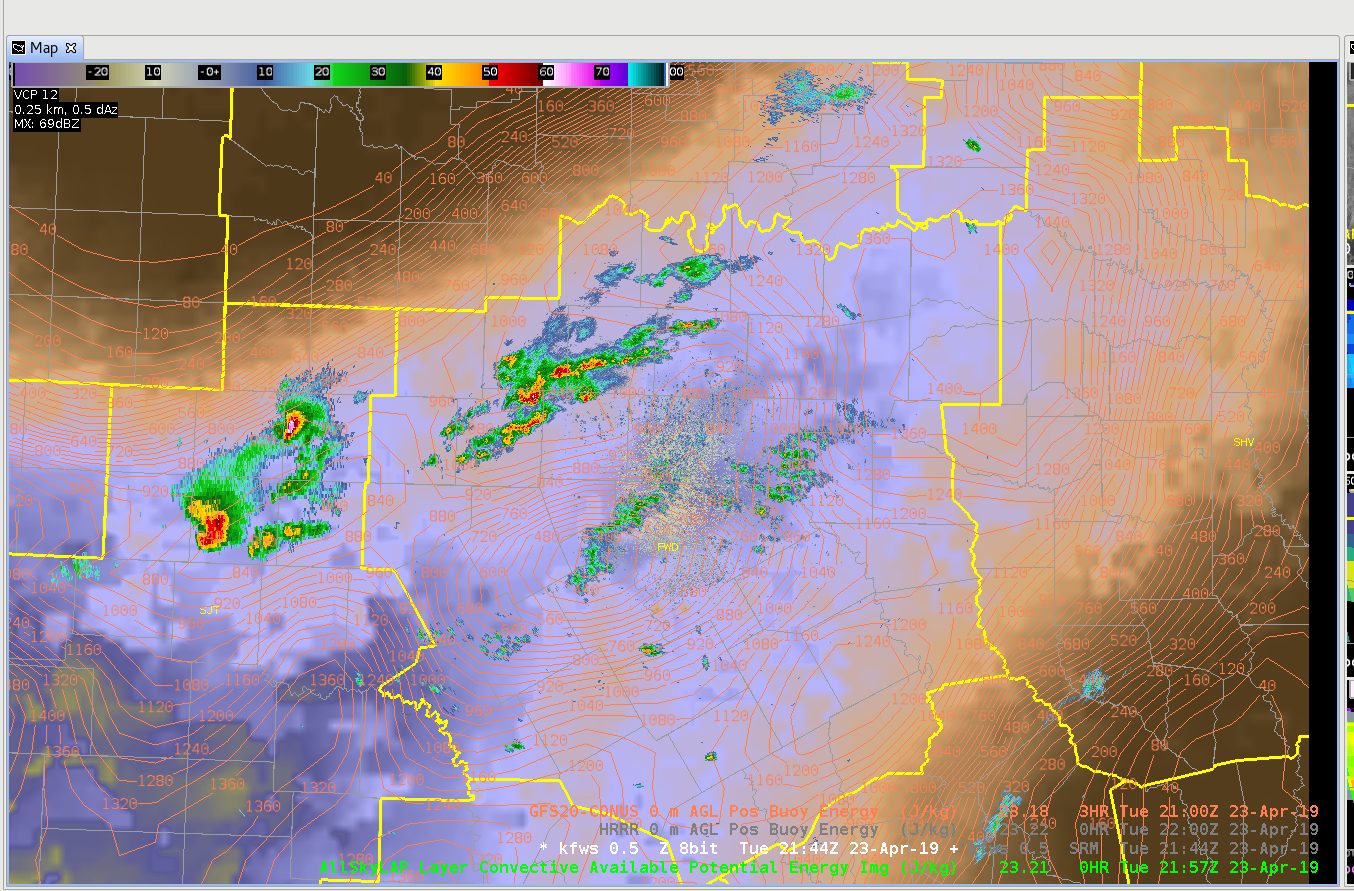
Minimum Flash Area showed some utility in boosting lead time for storm re-generation. The storm in the center of the first image had started to weaken a bit after moving off of the outflow boundary that initiated it.
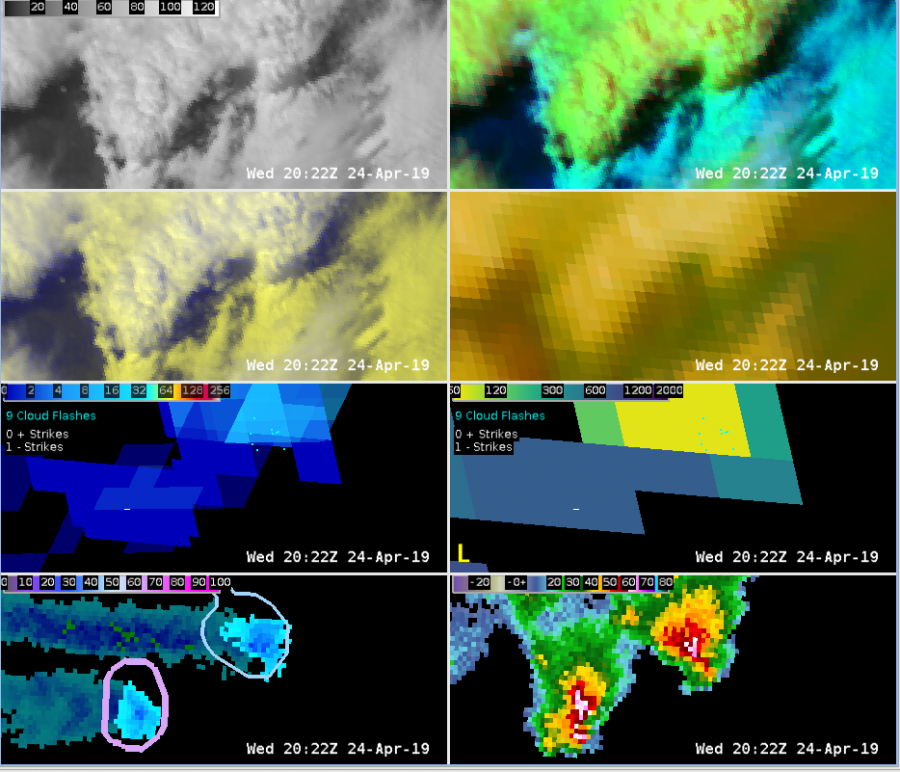
The storm continues to show no new updraft development in the sat imagery as well as MFA product.

At 20:29 GLM MFA begins to indicate that there may be a new updraft forming as it interacts with a differential heating boundary/outflow from the leading storm.

Over the next 20 minutes the updraft continues to strengthen as the storm becomes more robust. The MFA led the visible satellite depiction of the new updraft by 2-4 min. This could be useful when trying to decide whether to continue warnings or not.


Waiting on convection – diagnosis and investigation of products

Corpus Christi —

In investigating the environment we’ve deemed the convection to be more or less dependent on synoptic forcing via the cold front dropping southeast.

A

In A, plotted is Total Precipitable Water along with SPC Convective Outlook and analyzed fronts. A couple of things can be noted: TPW is very high under the Slight Risk, and it is displayed very nicely with good resolution contained within the gradient. This is a good example without going into too much detail about how our environment is primed for severe weather. However, NUCAPS Gridded Data has not come into our area as of 20z. This makes it hard to test the product and how it captures the boundary layer. 

Now, we wait.

B

As we wait for the cold front to drop SE, our attention is focused on convection happening in NE Mexico (pictured in B). These cells popped up right along the CAPE boundary between values of 300 j/kg to 1500 j/kg.

C

As can be seen in C, the GLM has indicated these storms contain lightning, thus they are intensifying in nature. We will now be monitoring the hail threat.


-lakeeffect

All-Sky Gradients & New Storm Development

Today was a great example for how the improved resolution from All-Sky LAP allowed us to hone in on exactly where new storm development will occur.  Convection across Mexico developed where the front sagged south along the moisture/CAPE gradient. While in this case the CIRA Merged TPW showed the same gradient, the resolution was still better with All-Sky. Baseline blended TPW as well as satellite derived TPW/CAPE were useless due to either being overly smoothed, or not displaying in cloudy areas. Great diagnostic tool.

— FLGatorDon

AllSkyLAP CAPE – Trends

Noticed the trend of AllSkyLAP – CAPE was interesting – and bucked the trend of the GFS background.

2157 UTC:  LAP seemed to have a good handle on higher CAPE trends at this timeframe with over 1000 J/kg in a wide area – which seemed to match convective trends.

2227 UTC:  LAP reduced CAPE over much of the area – even in areas that did not see storms.  Skies were generally were generally partly/mostly cloudy – but the trend appeared to reduce values too quickly.

2258 UTC:  LAP CAPE appeared boost again somewhat – but still less than the GFS CAPE.  These sort of “bouncy” CAPE trends will be examined the remainder of the week – to see if this trend continues.


SJT MNDA

Primary area of interest on this storm is the western-most mesocyclone highlighted by the NMDA. Unfortunately, the NMDA identifies this rotation with several different names, making it difficult to track through time.Sandor Clegane

AllSkyLAP – CAPE vs Radar

Easy display for SA is to plot radar (Z) over the AllSkyLayer CAPE.  In this case – storms are moving off slowly to the NE – in an area of similar CAPE values.  With expected cloud cover, further destabilization is not anticipated.  Thus, would expect storms to remain at current levels – or perhaps slowly intensity.  Would need to be monitored – but “rapid intensification” is not expected.