Today’s details of products and warnings: Midland, TX

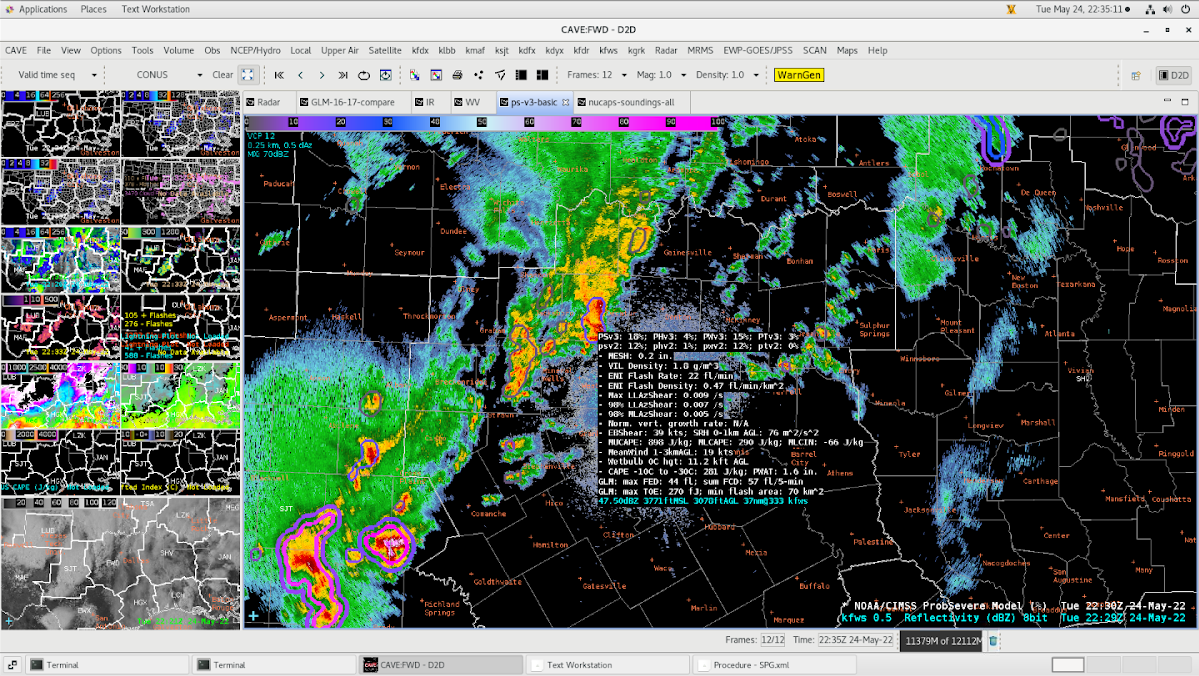
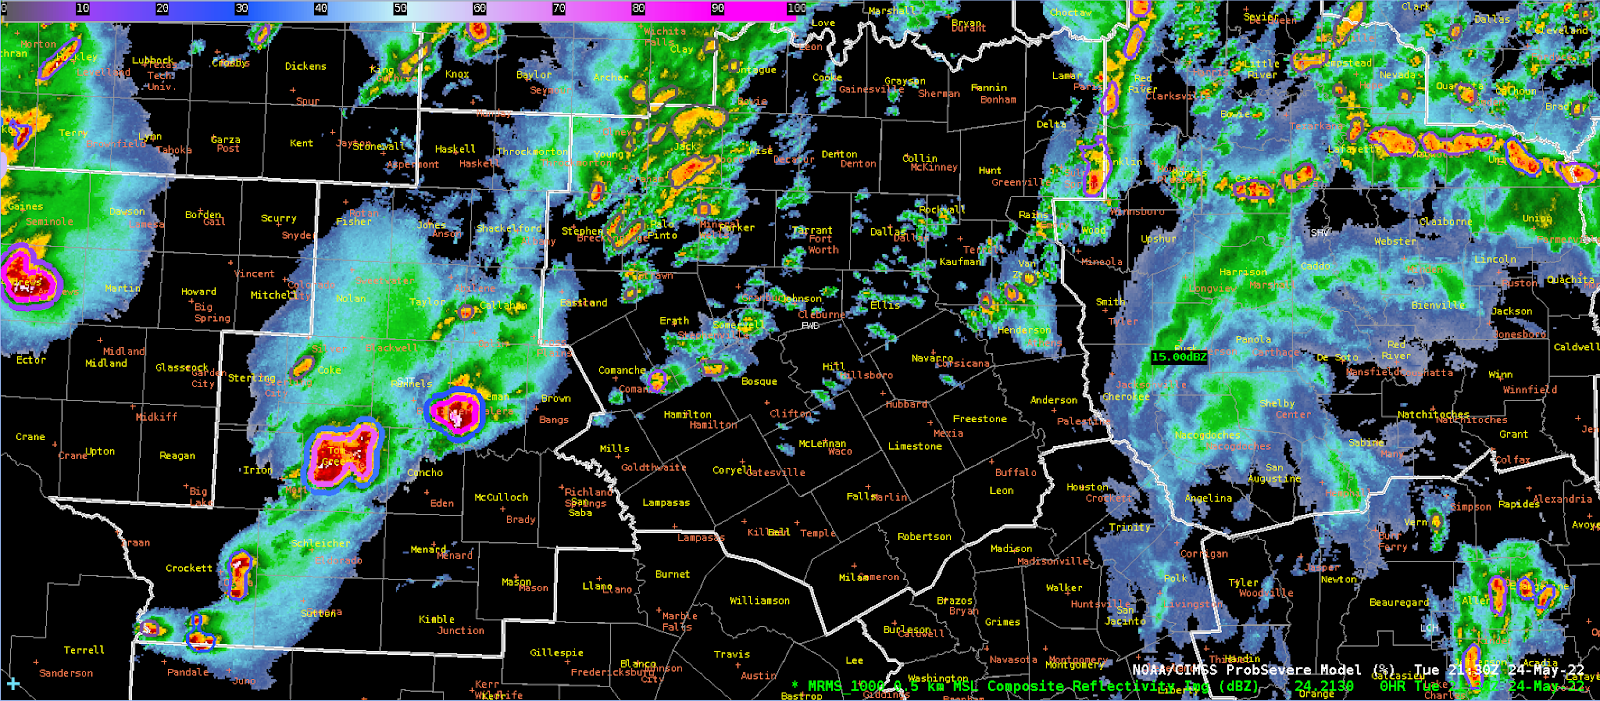
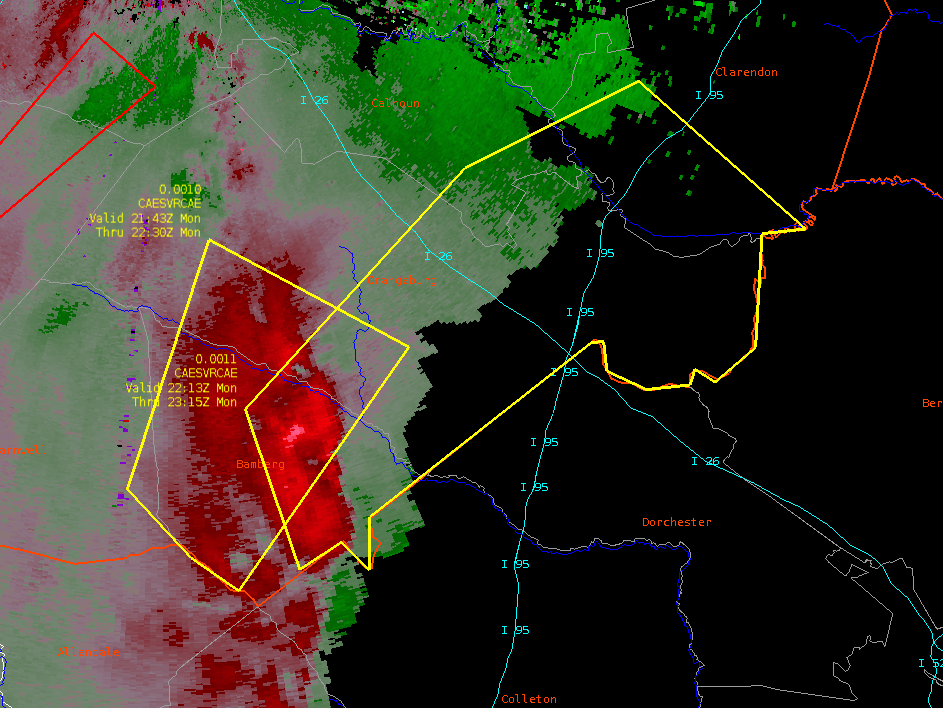
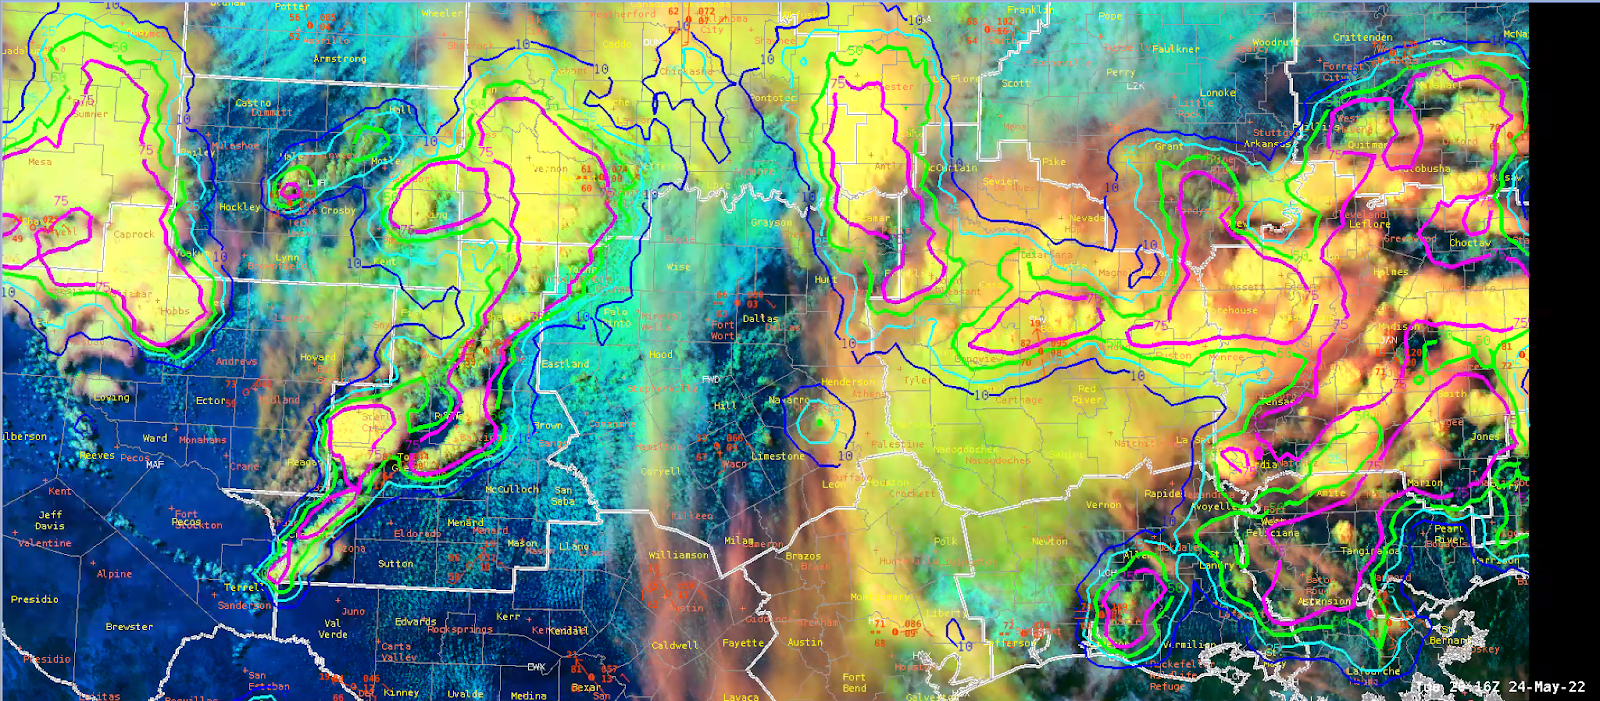
I found the PHS products useful for seeing the corridors of enhanced severe risk. They correctly showed that hail (or wind) was the highest risk compared to tornadoes.

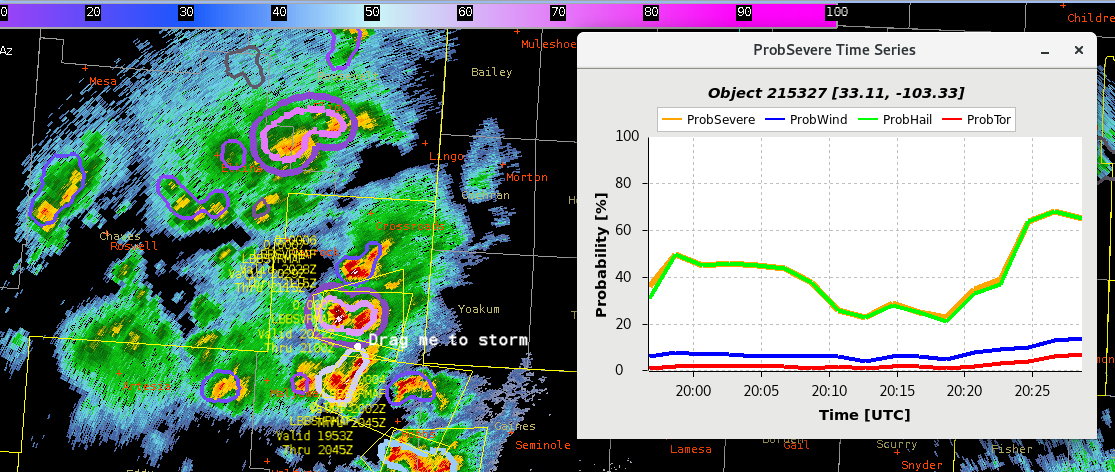
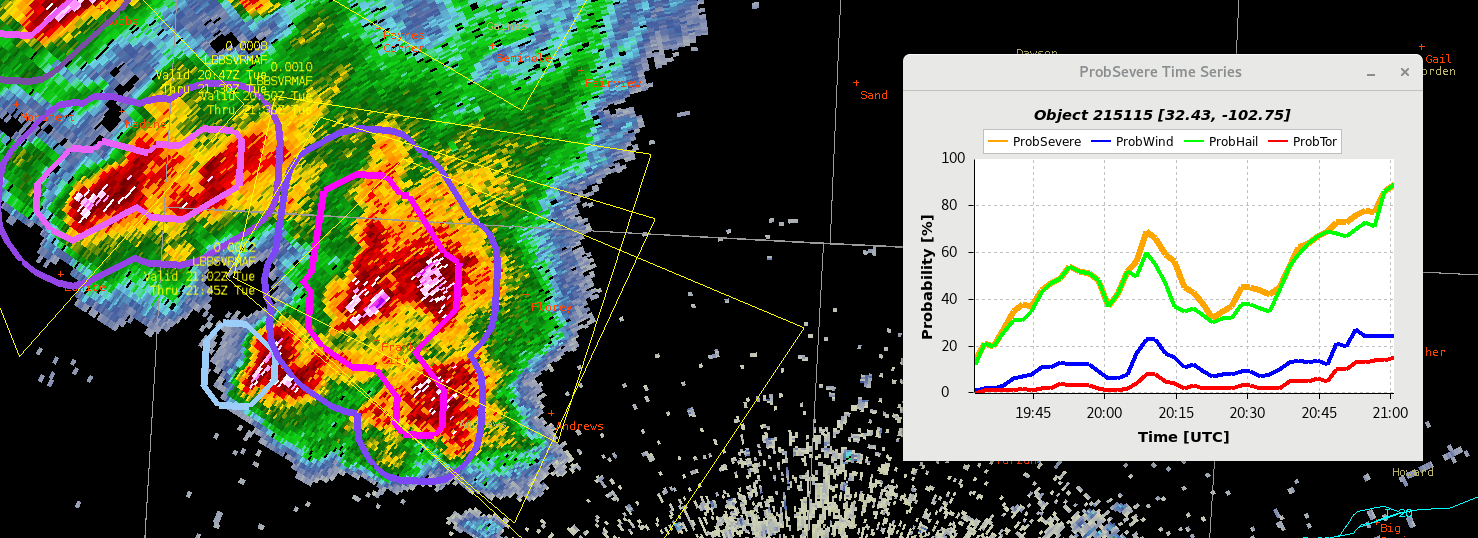
ProbSevere was very useful with the trend lines. Again and again correctly identified risks as they occurred.

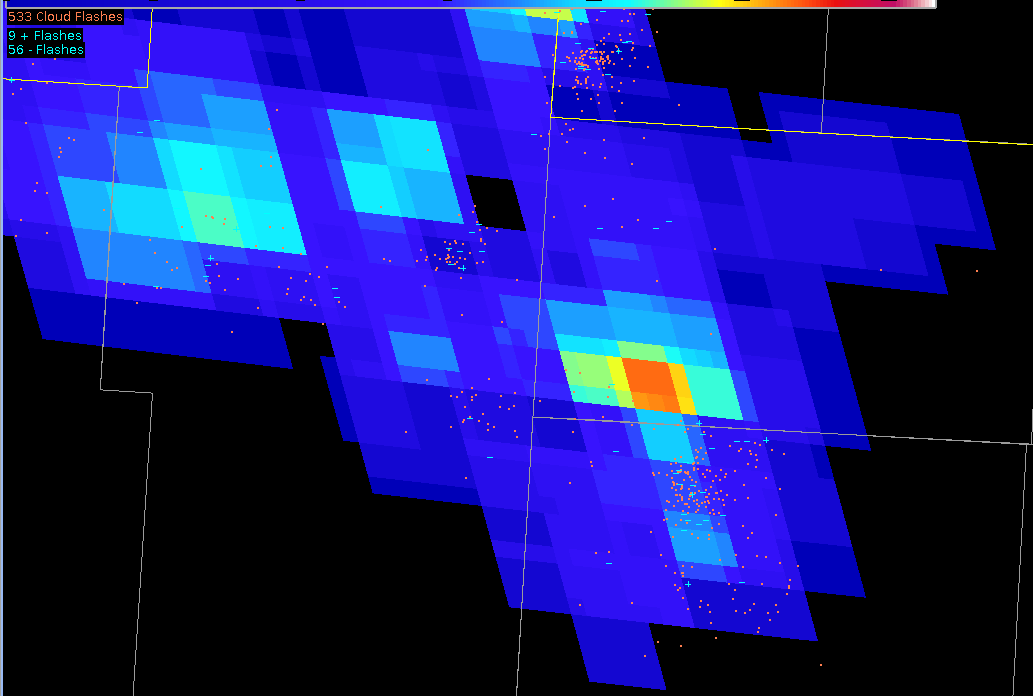
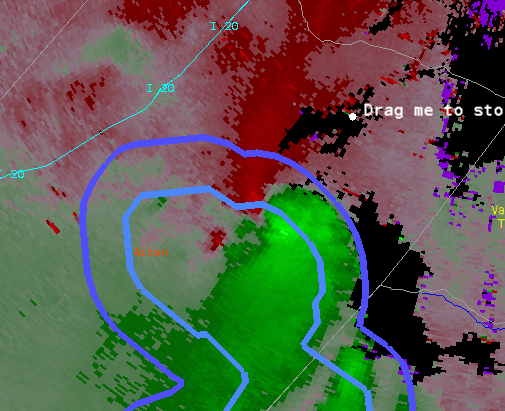
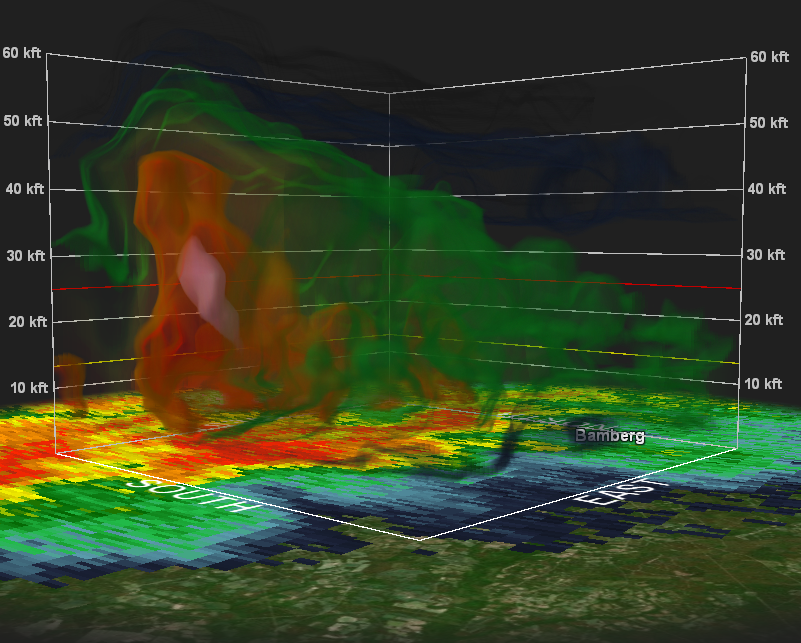
GLM showed strong ramp ups in activity prior to each severe issuance. No complaints here.

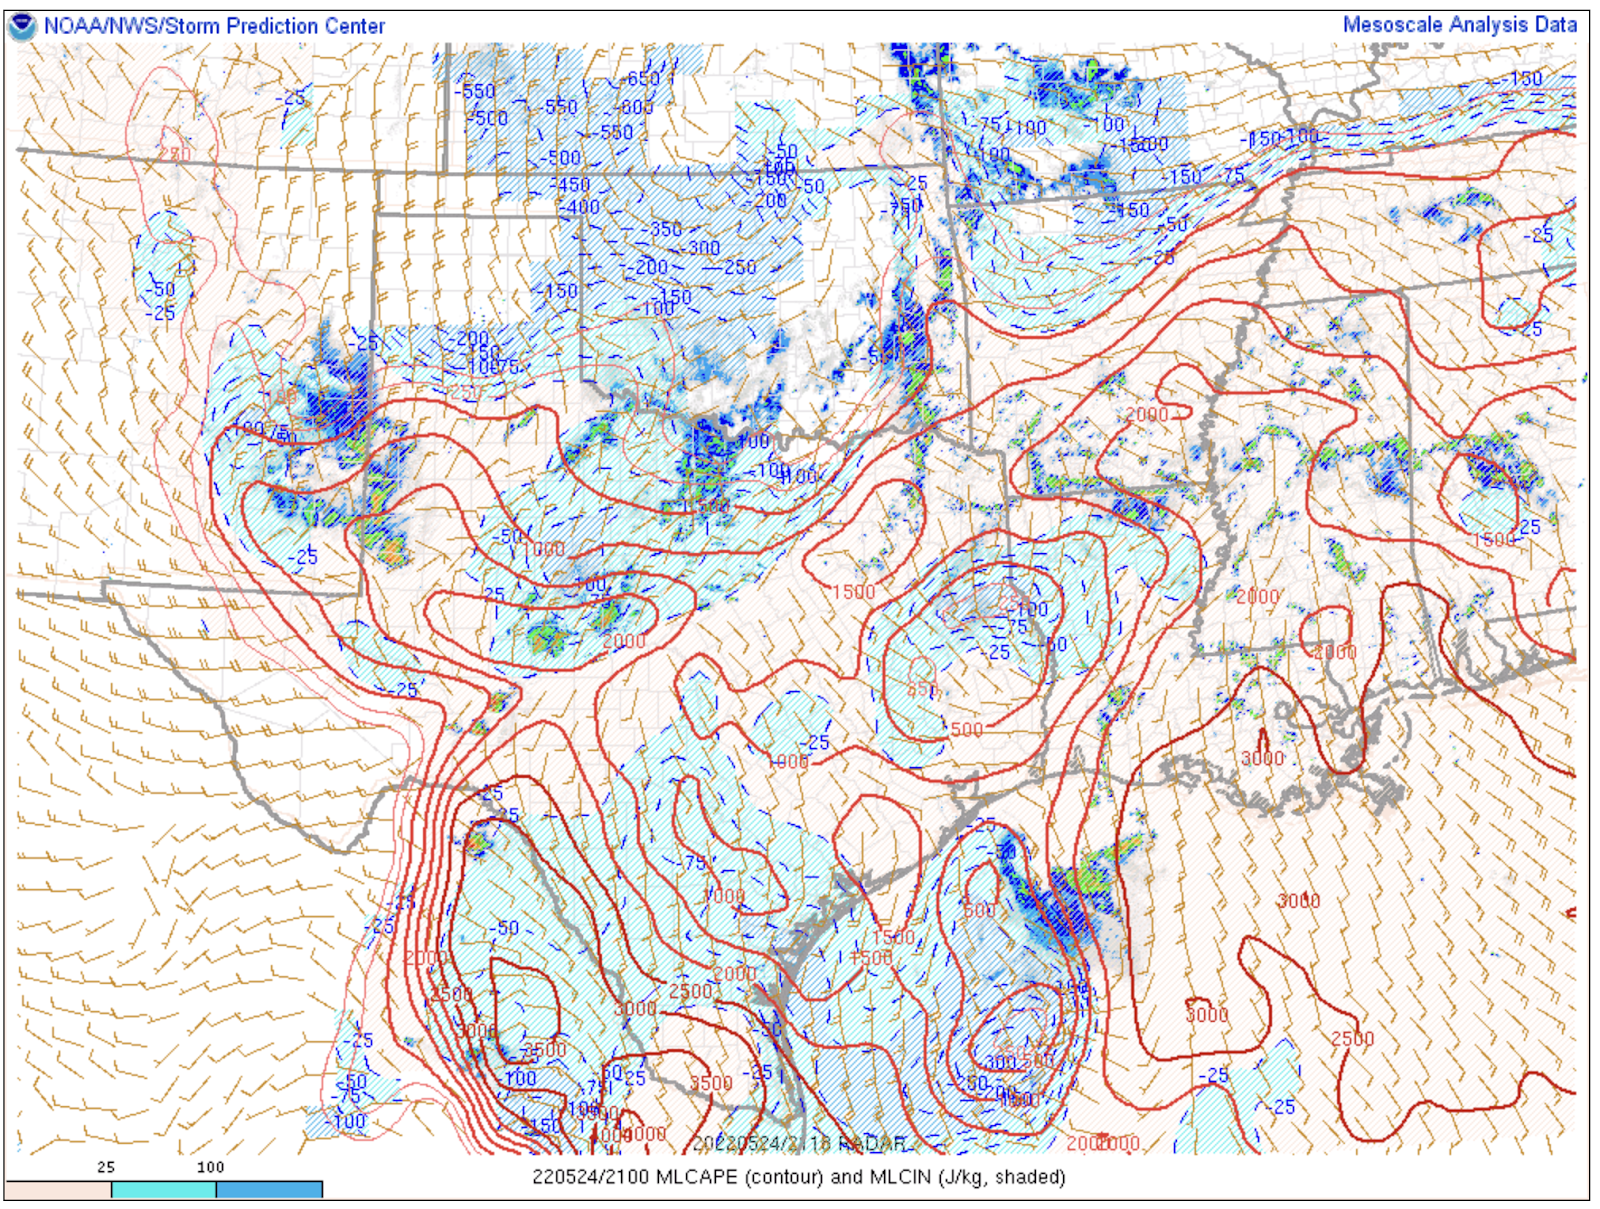
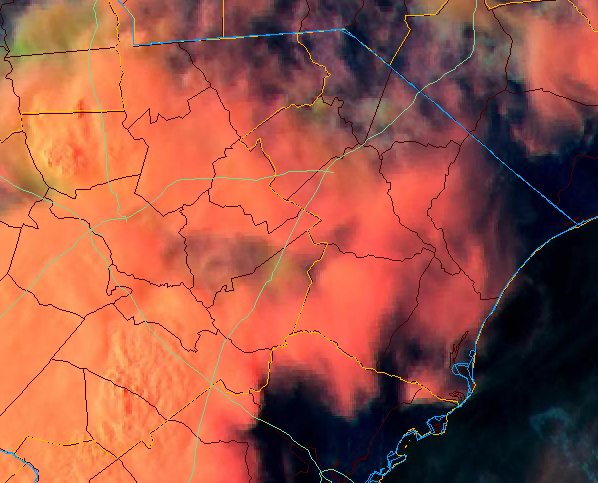
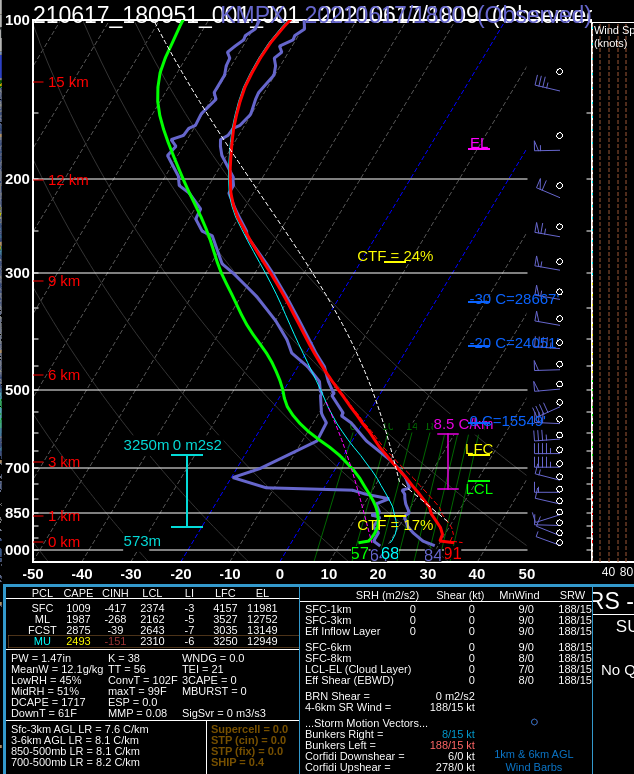
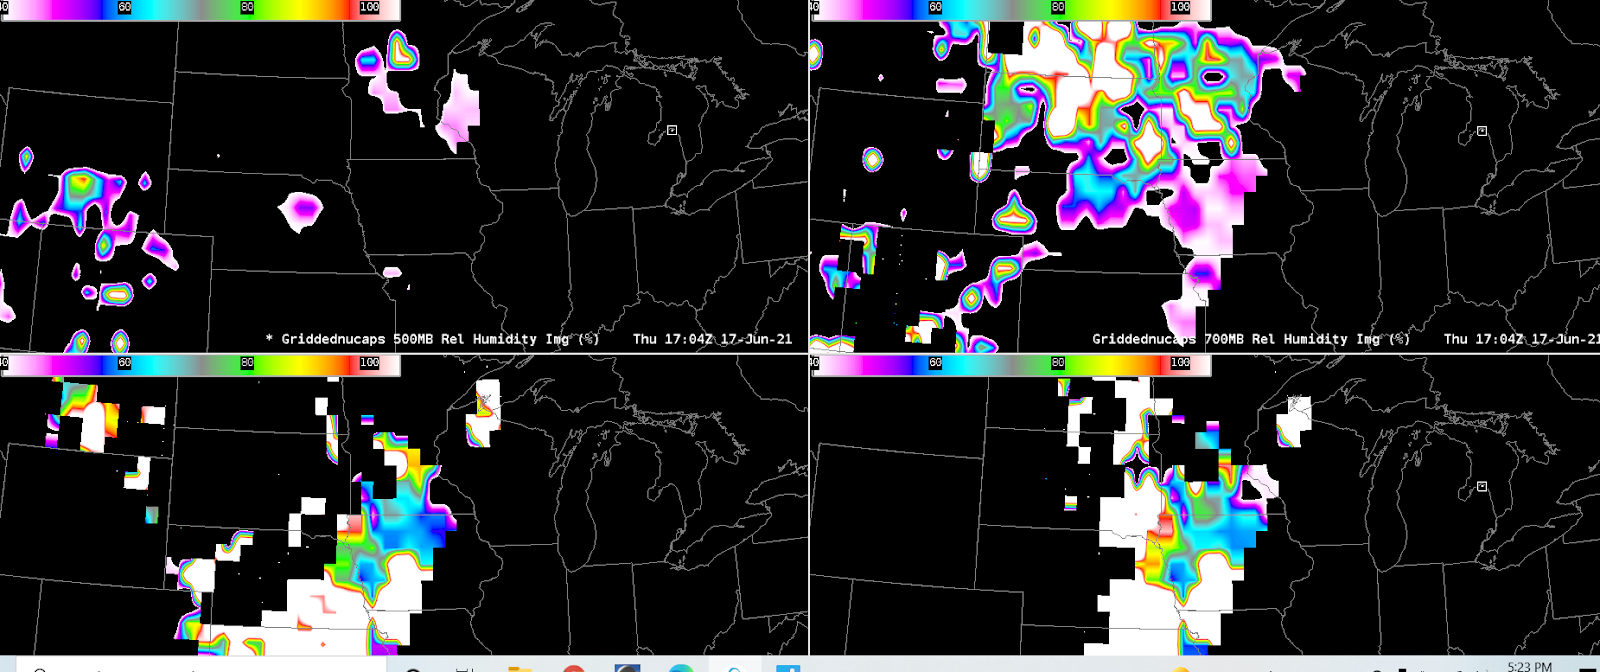
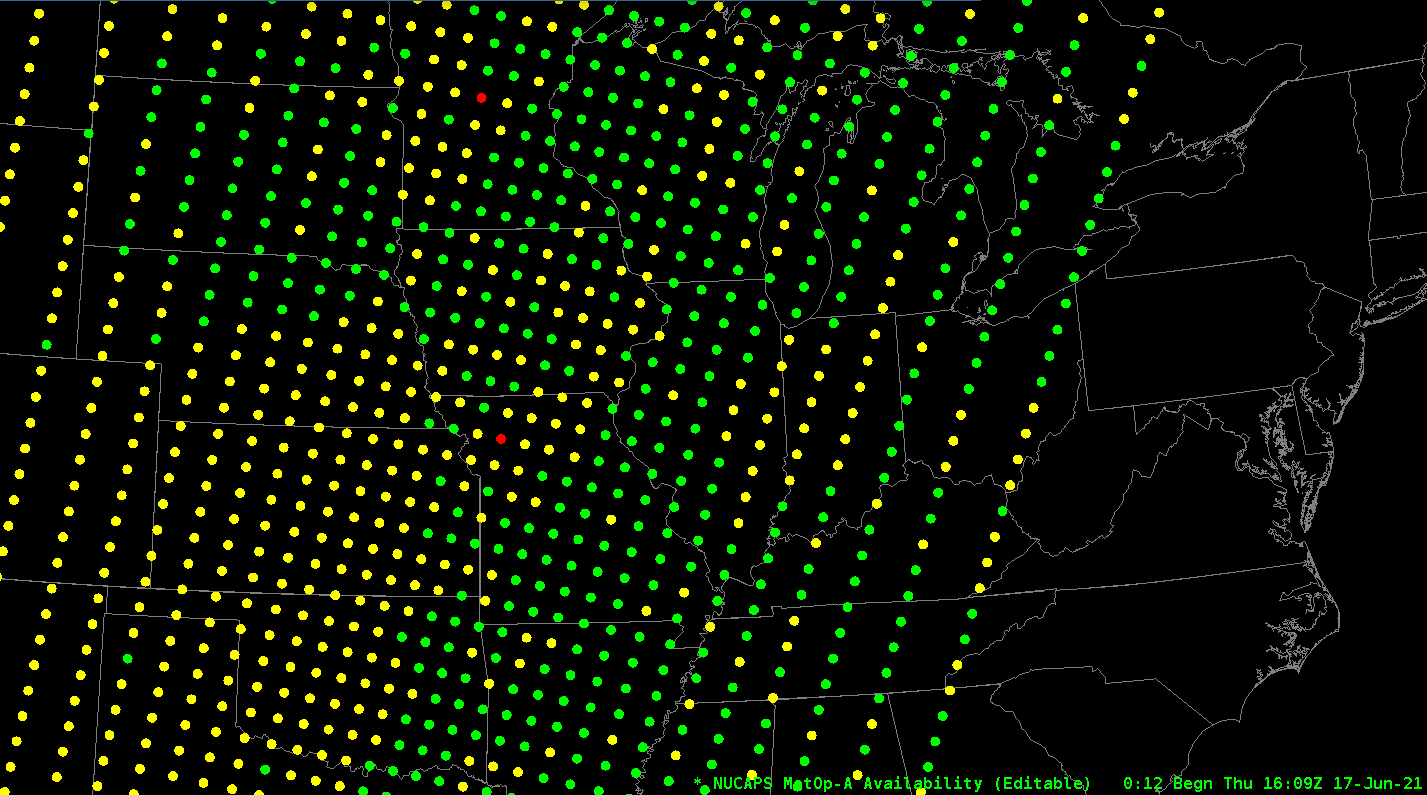
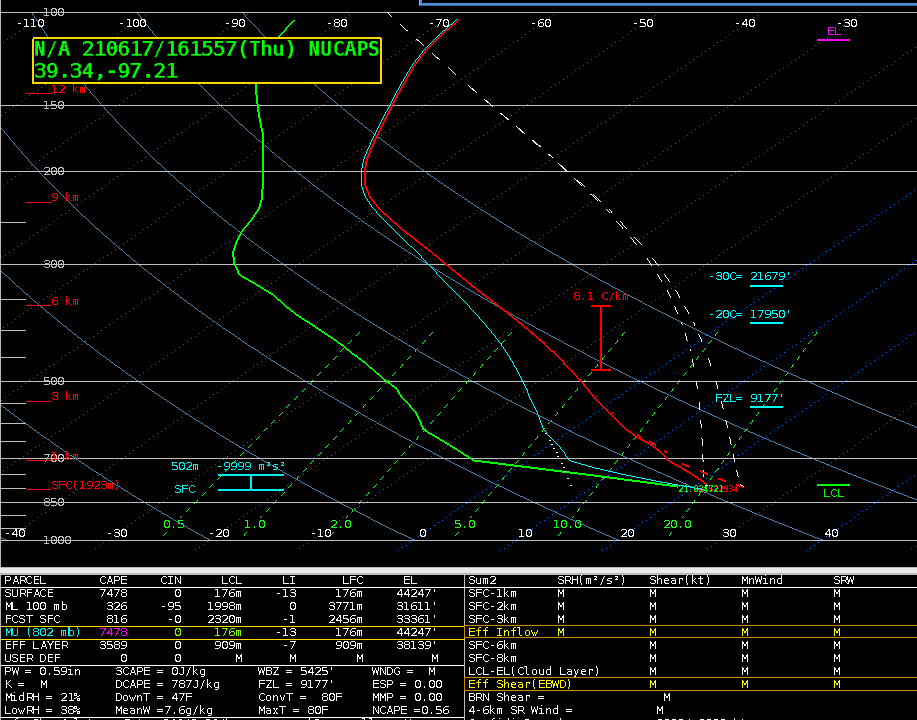
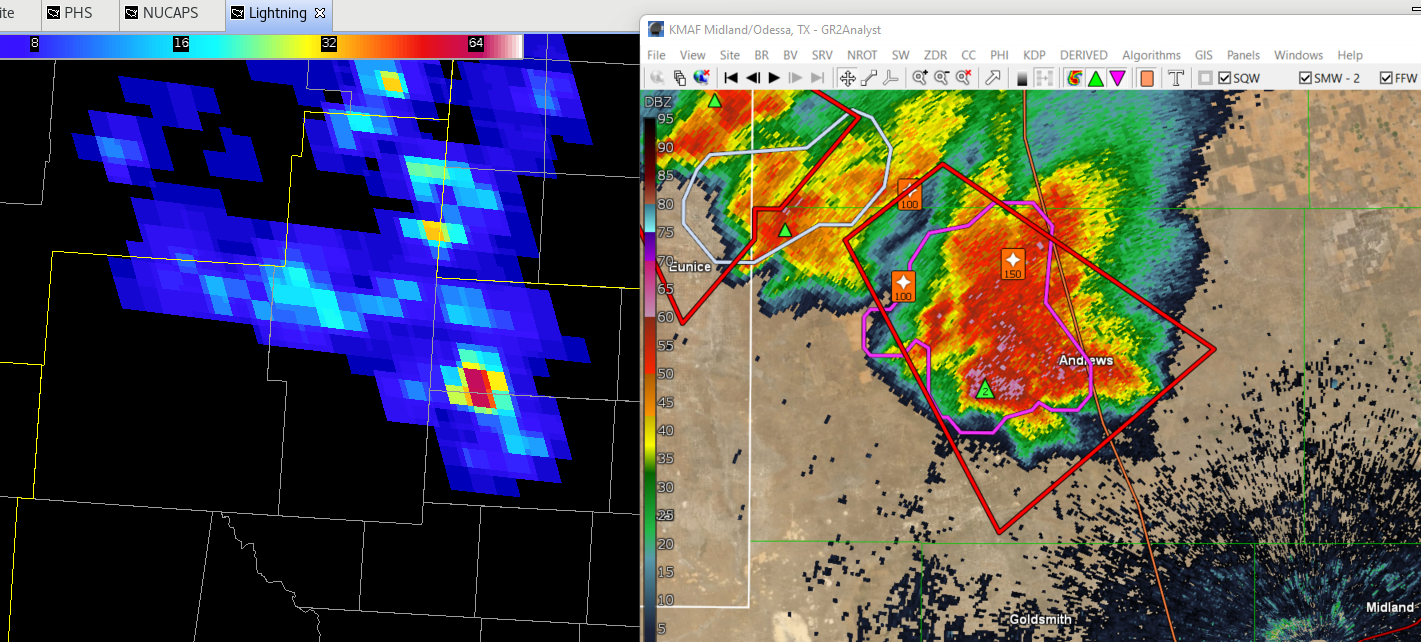
NUCAPS data was less useful, but with the skew-t pop up I was able to correctly see areas of mid level dry air. I did not use optical flow. Prob lightning was useful to see the first cells pop up but did not serve as much purpose after that with no known DSS opportunities.

Some Random Guy

Observations and DSS for Fort Worth, TX

AWIPS radar display over Texas. Synopsis – An upper level storm system and a cold front will bring a chance of showers and thunderstorms this afternoon and evening over the Forth Worth, TX area. Some storms could be severe with damaging winds and hail. Activity should exit to the southeast late tonight or early Wednesday morning.


VIS: Storms initiating in the NM/TX border. Anticipating a line of storms to develop along western TX and pushing southeastward.
Infrared.


WV


DSS: Colonial Country Club – Charles Schwab Tournament – Forth Worth, TX


AWIPS radar display over Texas.


SPC Mesoanalysis:  CAPE values of 2500+ J/kg, setting the stage for active convection this evening over much of TX.


SPC gives an enhanced risk of severe thunderstorms across parts of TX.


VIS @ 22Z: Storms maturing quite well in SJT.


Issued another DSS update about the likelihood of lightning passing over the property.


Polygon warning.


ProbSevere 3.
Vortex Power
Tags: None

Fort Worth ProbSevere

21:47Z: The 21:47 UTC Prob Severe with MRMS overlaid gave us situational awareness on where to focus our attention for severe storms. It highlighted two big cells southwest of our CWA, where the ProbSevere values approached 80 and 93%, respectively. The storm closest to our CWA had a 50 kt inbound velocity on the lowest scan.

Snowfan

Fort Worth NUCAPS

21:19Z: There was a NUCAPS passover around 1930Z over the Fort Worth area. One sounding in our southern CWA showed this:

The sounding showed MLCAPE of around 1500-1600 J/kg, with DCAPE values in excess of 1000 J/kg. Compared to the SPC meso page, these values agree quite well:

Snowfan

Fort Worth PHS

20:10Z: The PHS is showing a very unstable environment along/south of the outflow boundary, stretching southwest to northeast across the Fort Worth CWA. Temperatures are in the 80s south of the boundary with upper 60s to lower 70s dewpoints. North of this boundary, temperatures are in the lower 60s with lower 60s dewpoints.

Over time, close to 00-01Z, the boundary slides south and east toward the southern portion of the CWA, with SBCAPE over 2000 J/kg, STP values upwards of 3-5 (perhaps picking up on the better curved hodographs along the mesoscale boundary), and LI values approaching -8 to -10. The CAPE seems to match up very well with that seen on the SPC meso page. The SPC meso page had a higher STP southwest of our CWA at this time. This product helped me to focus on regions where new convection would likely form, good for situational awareness.

Snowfan

Severe wind across SC with isolated tornado/hail

This was the lone tornado warning I issued. It was borderline but a nice MCV wrapped up after this. Likely contributed to some severe winds at times.

This helped lead to a warning at 2146 UTC. This cell was near our southern CWA border. This looked good for hail.

Here is the same storm a bit later when it’s more of a wind threat. 40 kt winds showing up even with a poor radar angle.

Good overshooting top with that same storm showing up nicely in the DCP.

Other notes. I liked the idea of the micro wind product but it’s too hard to read. Needs work to be usable.

One last minute tornado warning…

  • Some Random Guy

Gridded NUCAPS Issue WI/MN

Sampling Total PW gridded NUCAPS with contours overlaid on top, we see that the values are unrealistically high (over 3 inches). The 18 UTC soundings from the Twin Cities offices shows PWATs only around 1.30” which confirms this is incorrect. Also, the contours are in centimeters, not inches which is what the images. I plotted the NUCAPS sounding points to see if the points were “yellow” but it looks like the points were unavailable at this time step.

From this time step, the gridded NUCAPS matched up very well with the special 18 UTC soundings and the total PW values are realistic and make sense given the environment. Also the NUCAP points are all green which solidifies that the satellite was able to obtain a good sample.

– Fear the Shear

Tags: None

NUCAPS in the ARX area

Comparison of a modified 18z NUCAPS sounding in far southern MN suggested a fairly accurate temperature profile (surface temperatures in southern MN were warmer than up at MSP.). NUCAPS did miss a pronounced dry layer around 700 mb, while it was too dry higher up especially around 500mb.

We also noticed some erroneous gridded NUCAPS precipitable water data round 16z across the Midwest (values of 3 to 4 inches). These looked more reasonable with the pass at 18z.

There was also 120 to 150% 850mb and 925mb RH.

The only satellite pass around that time was Metop-A. While the soundings were yellow, they generally were ok and didn’t match the gridded data.

– Barry Allen

Tags: None