

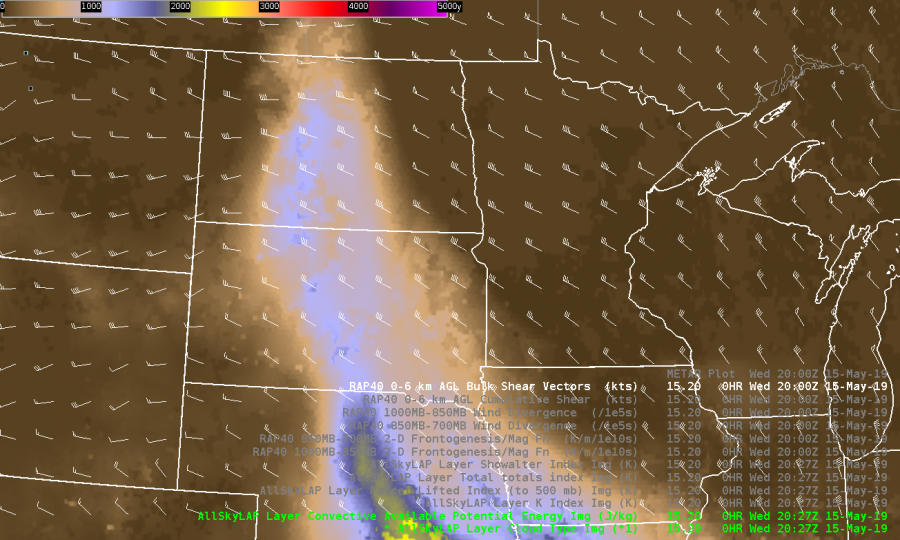
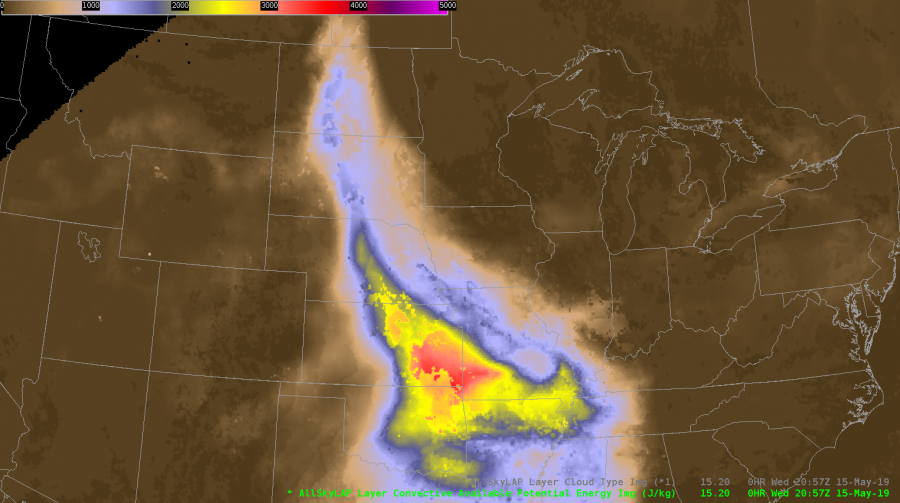
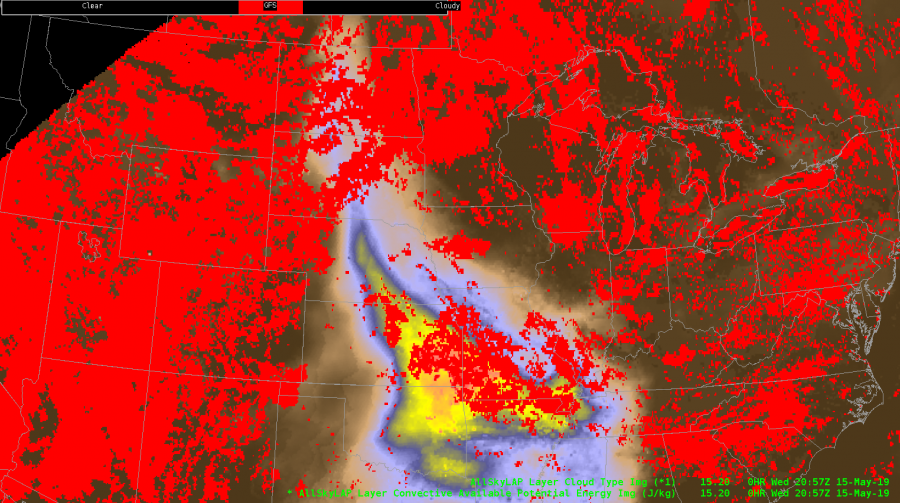
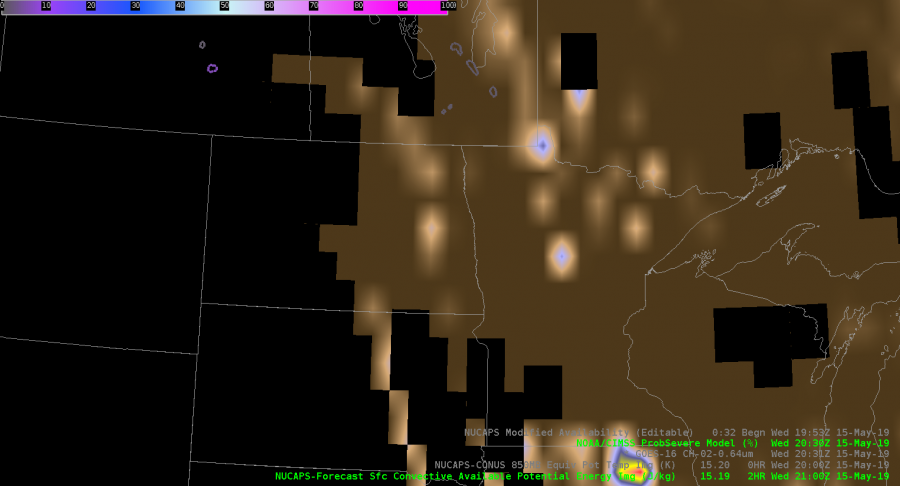
NUCAPS and AllSky both were helpful in tracking the afternoon destabilization over North Dakota today. Both data sources provided what seemed to be fairly accurate assessments of CAPE values. Clear sky and GFS retrievals in AllSky were similar, with the clear sky retrievals very closely matching the NUCAPS retrievals. Having a plan view depiction in AllSky was very helpful when combined with RAP shear vectors in accessing afternoon storm potential.
NUCAPS Sounding:
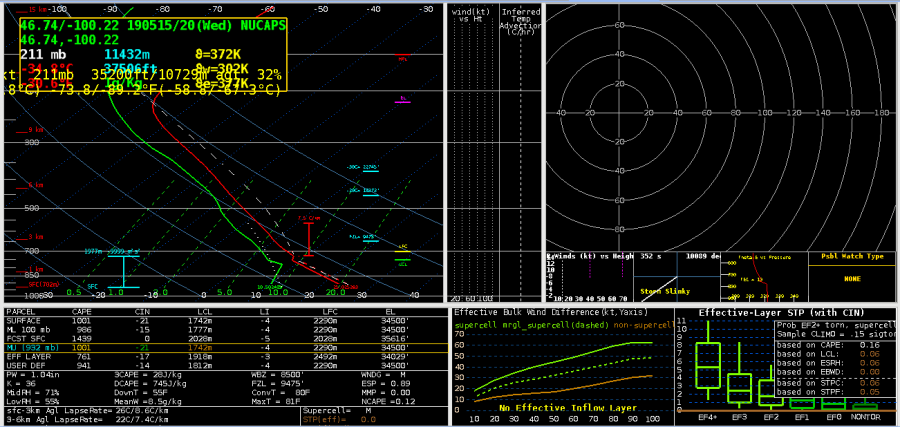
— warmbias —


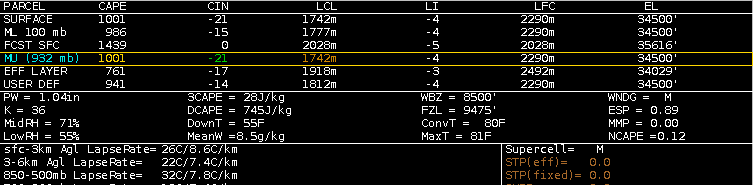
 To further confuse matters the NUCAPS forecasted SFC CAPE values for the same location and time is 400J/kg…which is closer to the observed sounding than to the NUCAPS sounding.