
June 15, 2023 – Role playing as DDC, a colleague and myself were tasked with creating a public graphic for a near term forecast regarding the location and timing of the potential for severe thunderstorms and associated hazards.
There was ongoing severe convection within the western half of the CWA by the start of our shift. After going through a quick forecast process and mesoanalysis, it was determined that a prime environment for either additional or sustained severe convection was spreading into the southern and eastern portions of the CWA.
Shortly thereafter, satellite gave indications of convective initiation in the vicinity of a triple point of a surface low. Satellite imagery and products that gave indication of building, infant convection included Day Cloud Type RGB and LightningCast via GOES-West Mesosector 1.
Figure 1.
Day Cloud Type RGB was used to track the vertically growing Cu, while using the Time of Arrival Tool and knowledge of the environment to estimate the spatiotemporal extent ( orange dashed outline) of where severe convection would occur within the next two to three hours, as displayed in Figure 1. Additionally, LightningCast was used to build confidence in where convection was growing and tracking, aiding in defining this area of concern.
Figure 2.
When comparing this to radar reflectivity (Figure 2.), radar was devoid of robust convection in the growing area of concern. Thus satellite proved useful in providing further lead time in defining the area of concern as well as when to start graphic creation. While we opted to not show satellite imagery for public consumption (satellite imagery can be distracting and/or misinterpreted when messaging severe hazards and impacts), it was crucial in the development stage of graphic creation, particularly defining areas of growing concern.
Here was the graphic we created:
How did it pan out? Pretty well, actually:
Figure 3 shows an animation of MRMS Composite Reflectivity and ProbSevere through the window of forecast hazards to help illustrate how severe convection developed between 20:00 UTC through 22:15 UTC within DDC during the period of concern.
Additionally, here are the SPC reports between 20:00 UTC to 22:15 UTC within DDC during the period of concern, including a measured 88 mph wind gust at 21:30 UTC within Seward County:
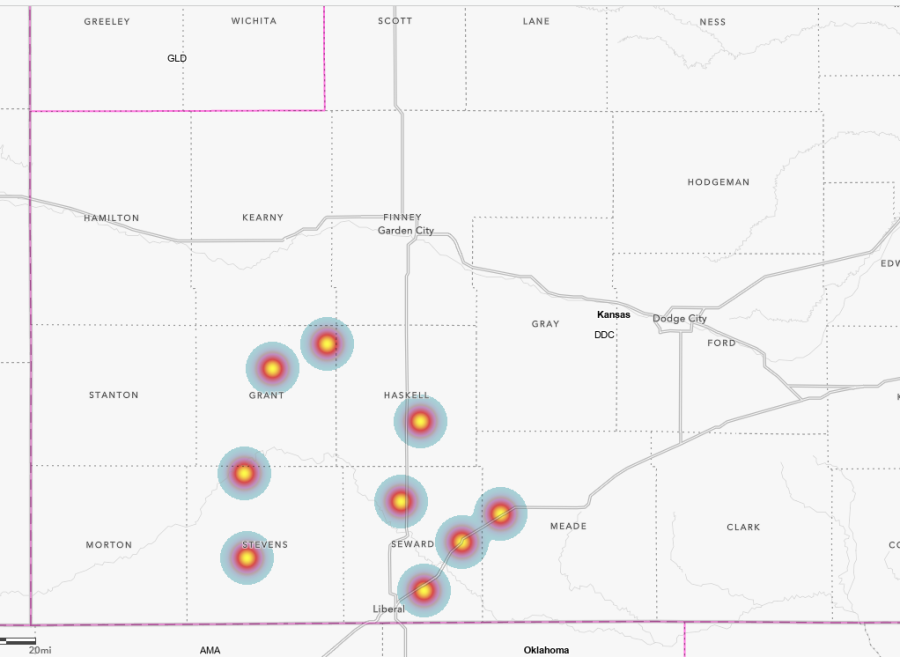
– 0SMBLSN