
PHS and NUCAPS
Today worked out well with PHS and NUCAPS. NUCAPS data came in shortly after opening up our work stations. We decided to compare the output between PHS, NUCAPS, and SPC mesoscale analysis. The variable that we chose was surface CAPE.
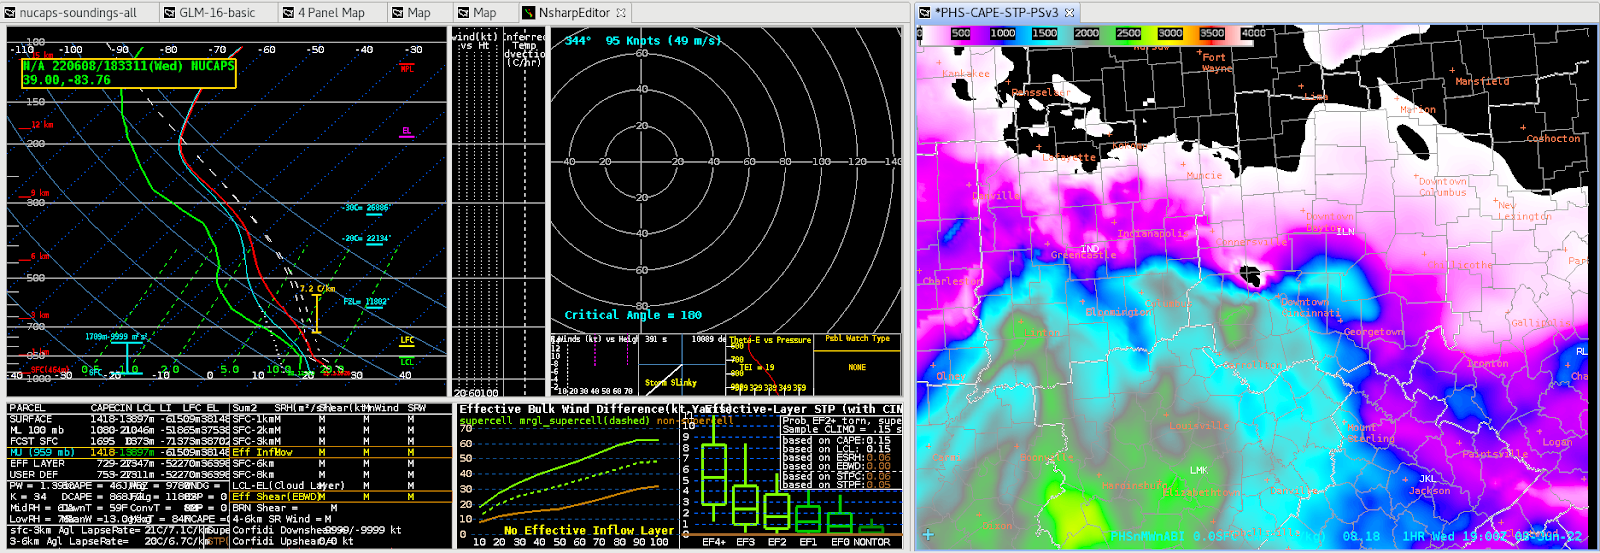
They all seemed to match up well highlighting the higher instability to the south that would gradually push north this afternoon. It was definitely a confidence builder in each product to see the agreement between them.
Optical Flow
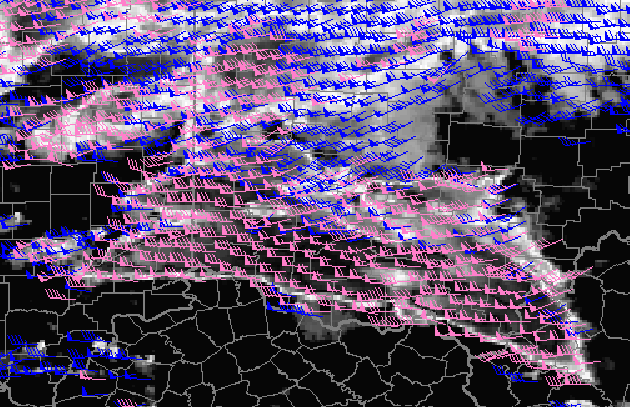
We also decided to compare the Optical Flow winds to SPC mesoscale analysis. Once storms developed a bit more, you can pick out a slight directional divergence signal in the flow. Looking at SPC mesoscale analysis there is also directional divergence is present in the mesoscale analysis.
Overall looking at these two examples, using these tools together can be a way to verify information and give the meteorologist more confidence (or less) in a specific product to help them with forecasts, DSS, and warning operations.
Prob Severe
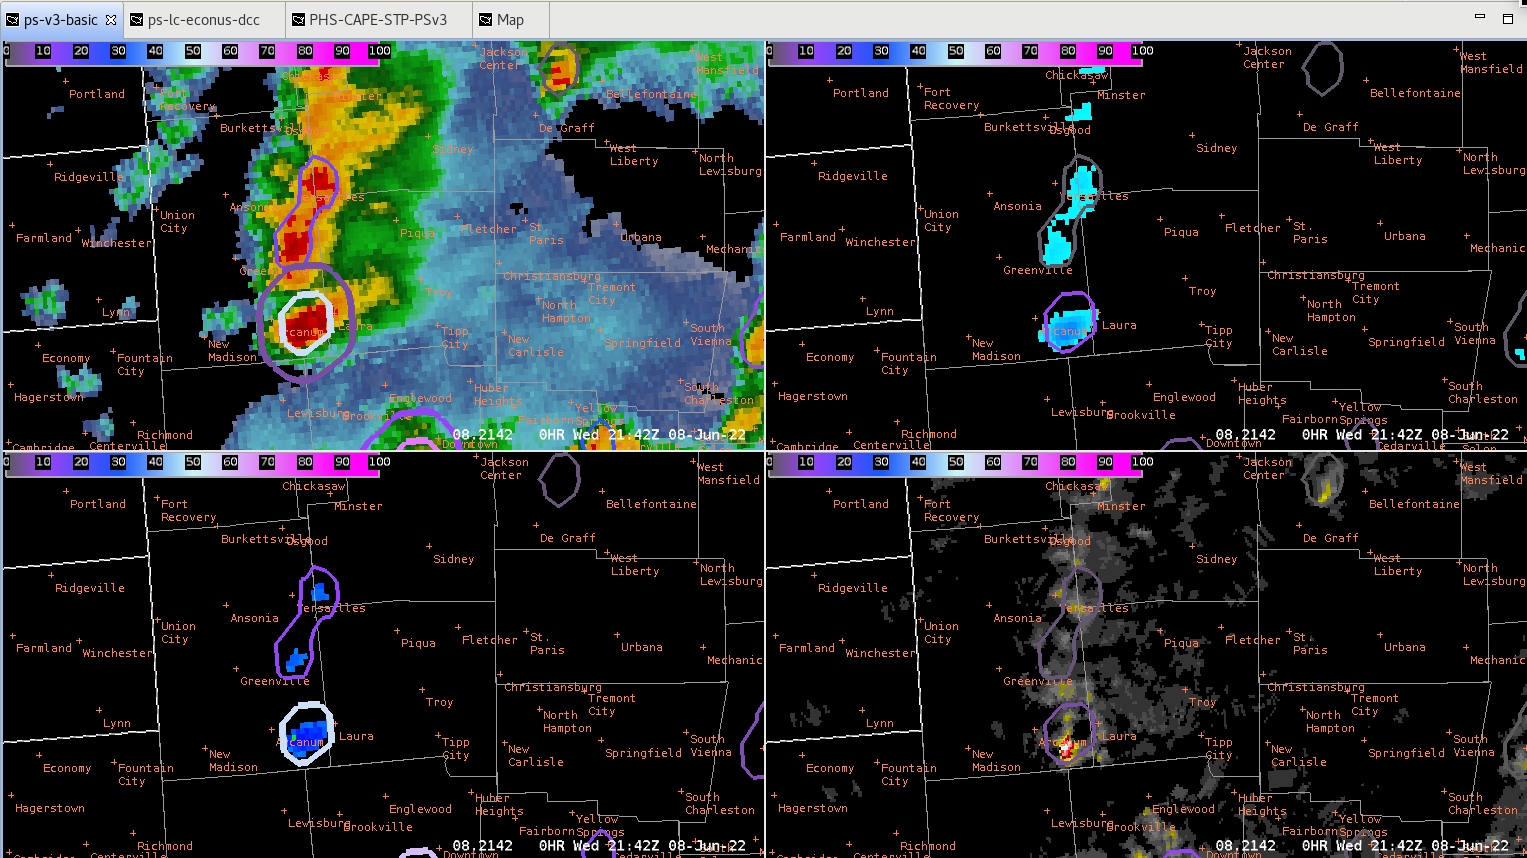
We were able to compare Prob Severe V3 to the time when there was an observed report and when the new tornado warning came with a radar observed tag due to a CC drop. The first image is when there was a twitter report of a tornado around 2142Z in SE Darke county.

At 2144Z the Prob Severe V2 tornado jumped to 21% while V3 only went to 6%.
The next image below is when the radar confirmed tornado was reported.


– Noctilucent & Matador