
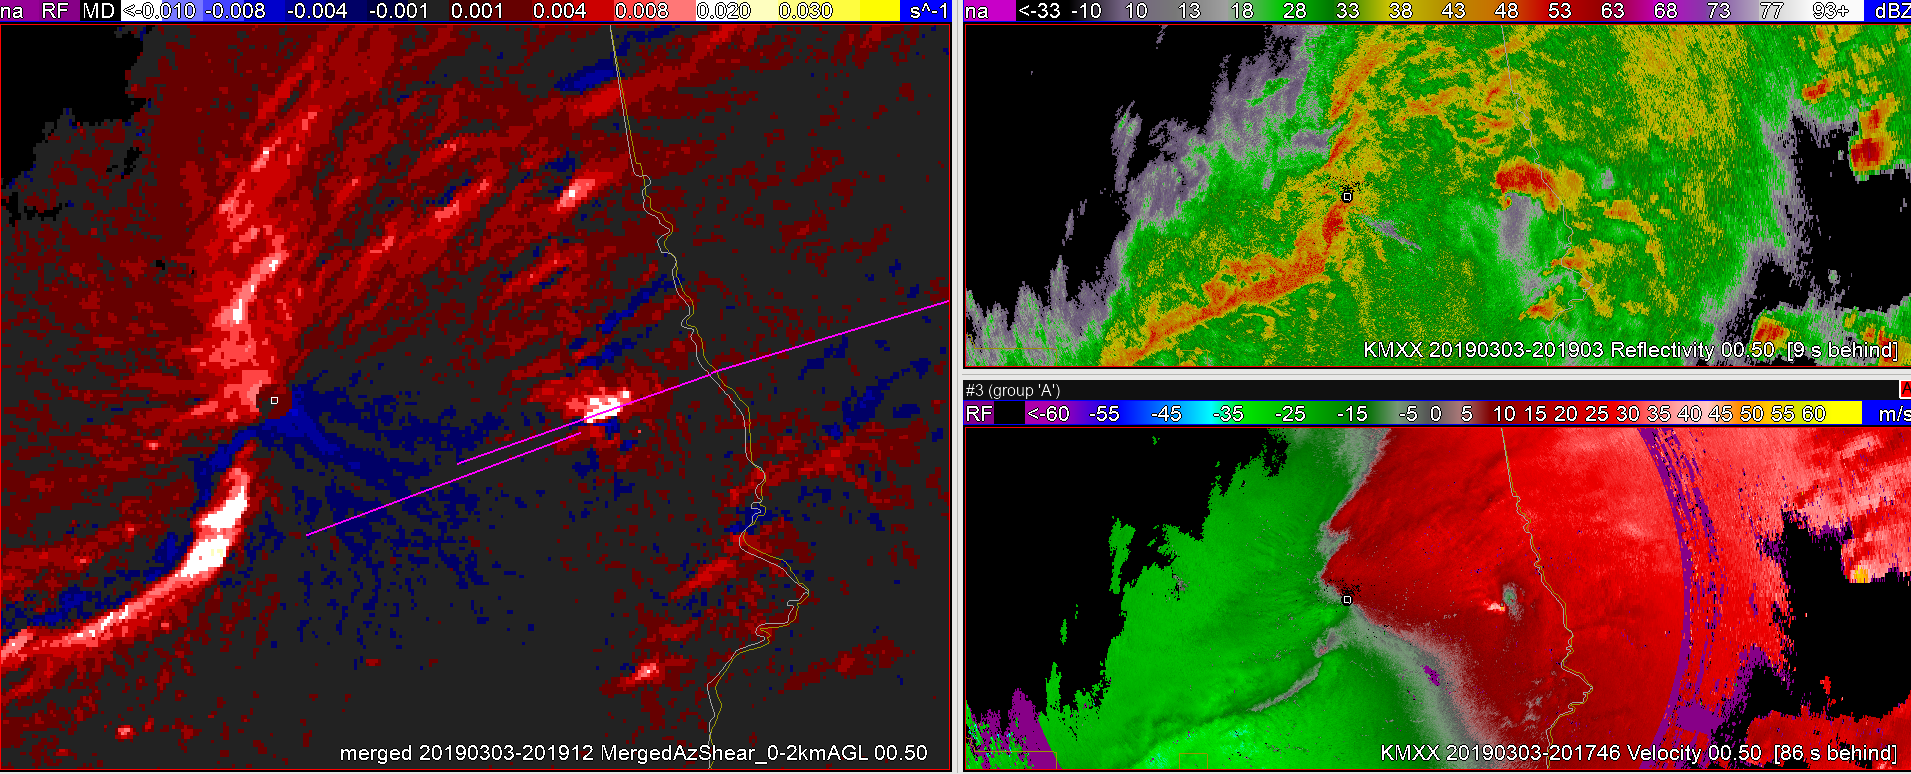
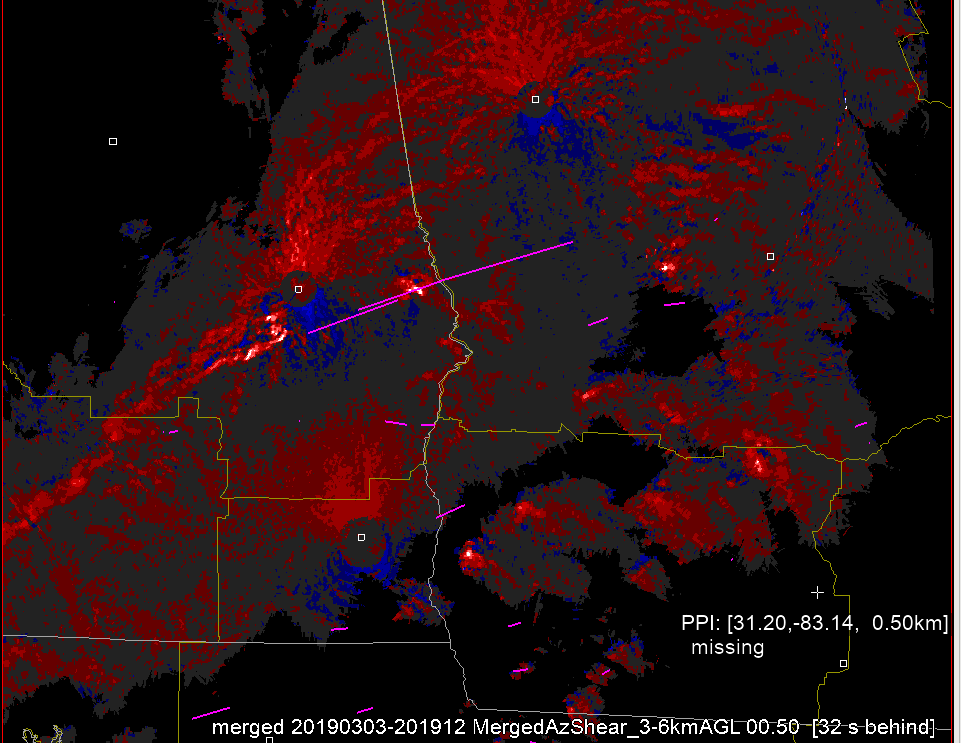
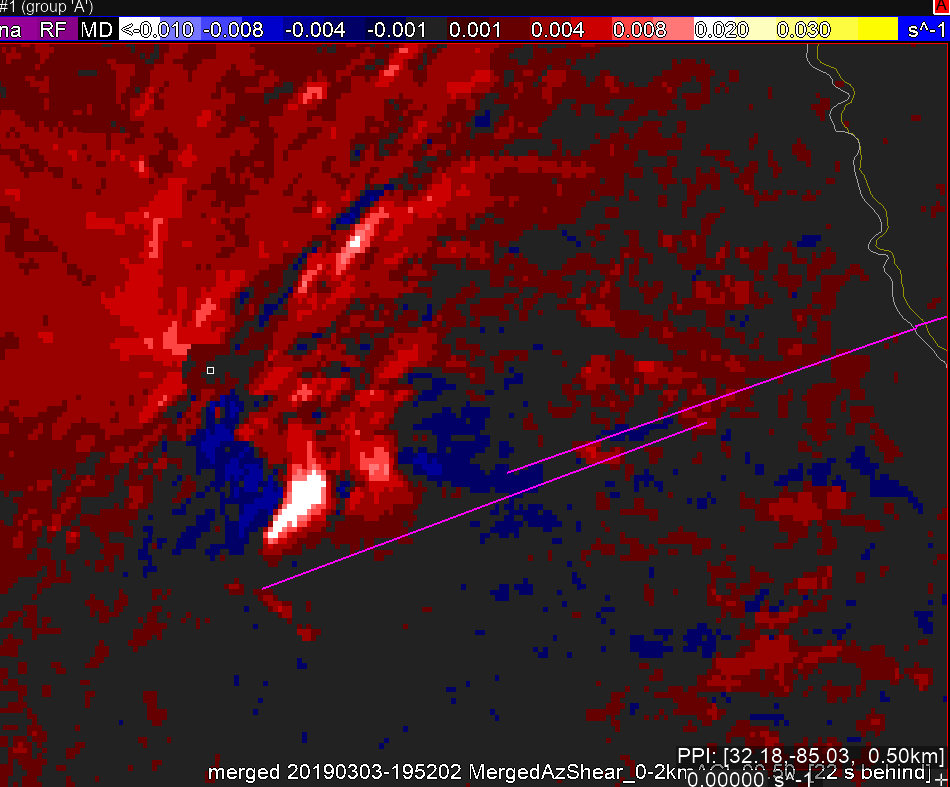
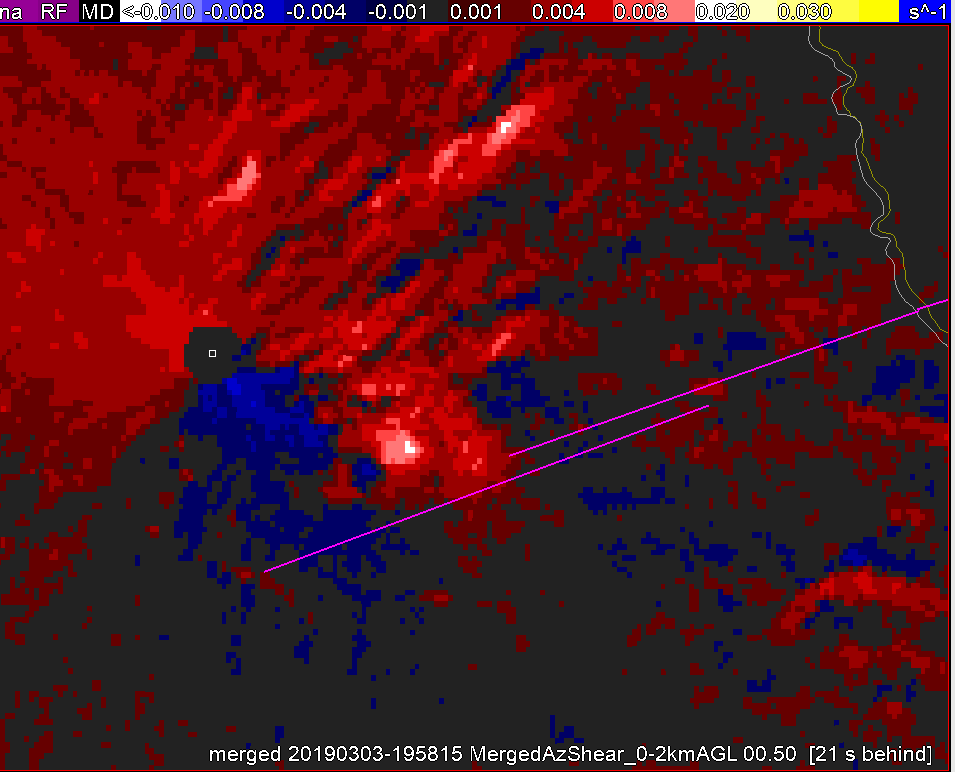
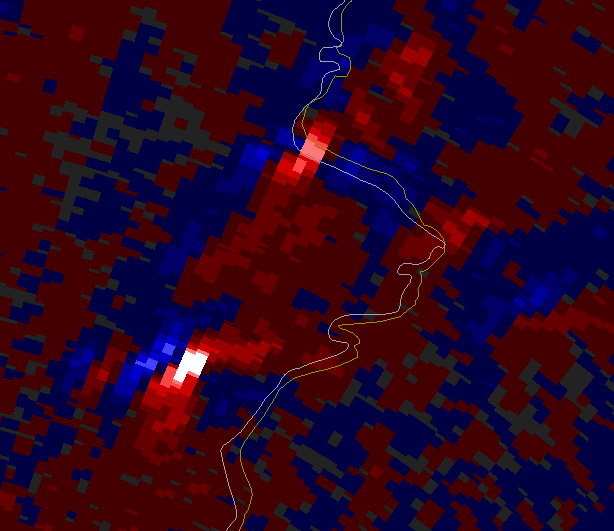
The 0-2km product still highlighted all three parts of the line, and reflectivity still shows the line breaks up north, but the velocity product itself is not showing much gate to gate tight mesos there, despite the higher AzShear numbers.
Charley
Official websites use .gov
A
.gov website belongs to an official government
organization in the United States.
Secure .gov websites use HTTPS
A
lock (
) or https:// means you’ve safely connected to
the .gov website. Share sensitive information only on official,
secure websites.

The 0-2km product still highlighted all three parts of the line, and reflectivity still shows the line breaks up north, but the velocity product itself is not showing much gate to gate tight mesos there, despite the higher AzShear numbers.
Charley
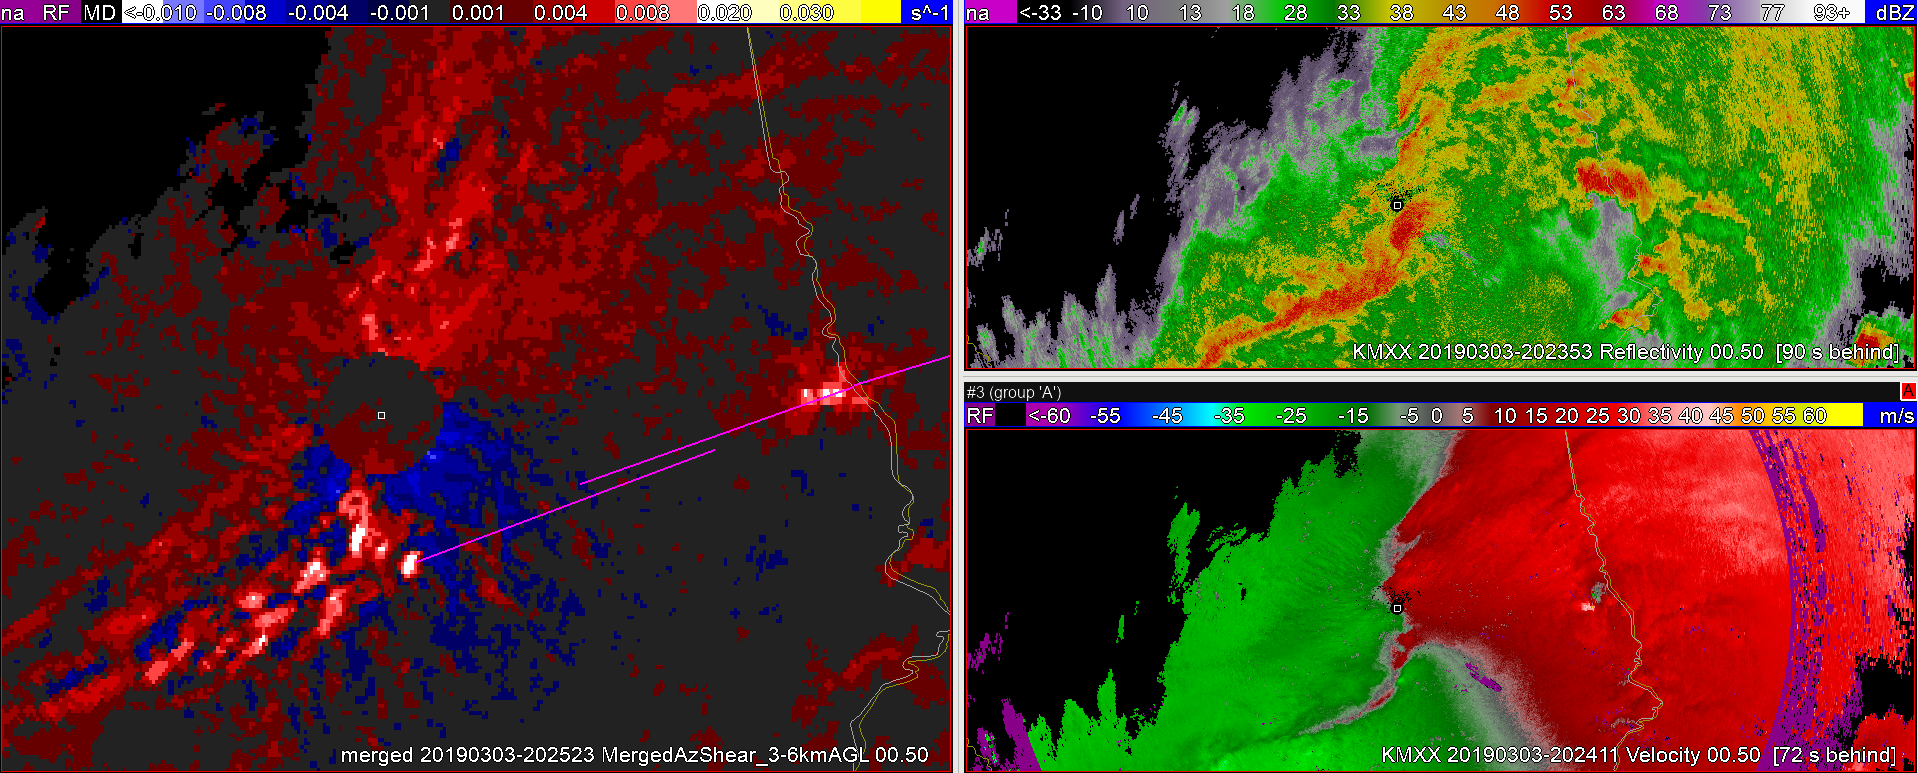
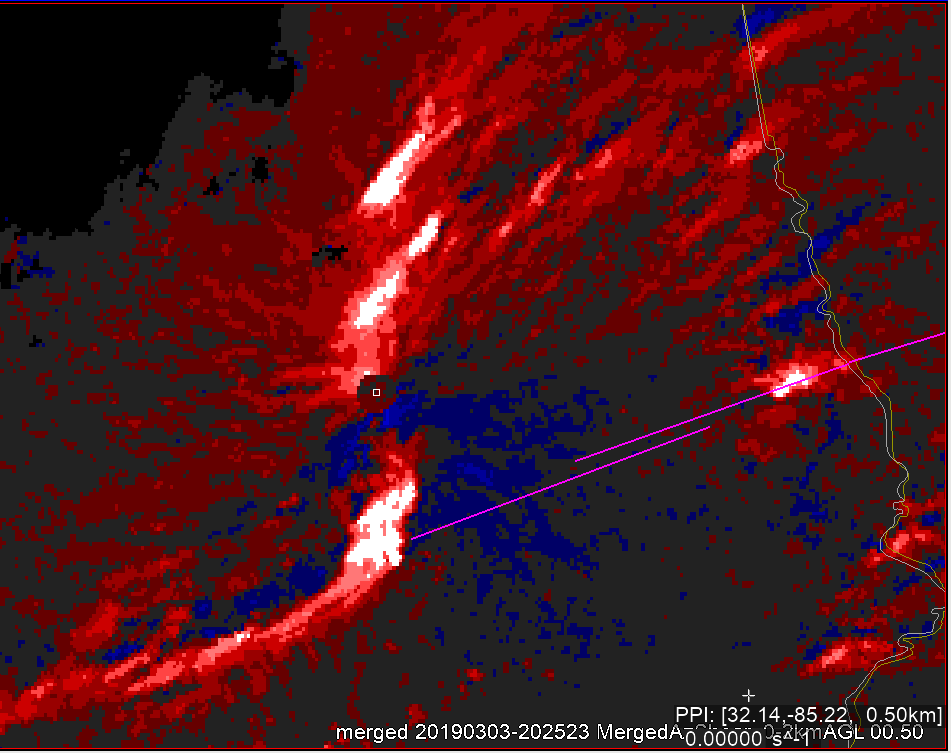
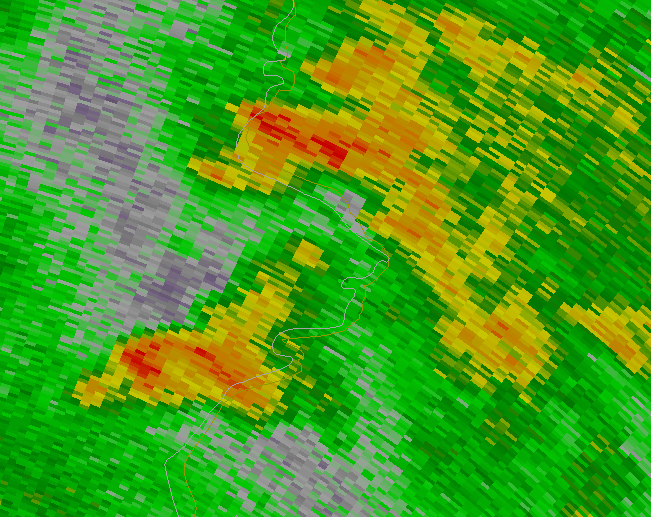
The merged 0-2km AzShear product shows threat more areas of interest along a north/south line crossing MXX. The southern one obviously is the strongest, but one just north of the radar and one farther north of the radar has reflectivity and velocity tags indicate some potential for tornadogenesis. Reflectivity shows line breaks and a convergence zone at enough of an angle to the 0-3km shear vector to induce some stronger mesos.
The 3-6km shear vector focuses more on the southern one of those three.
Charley
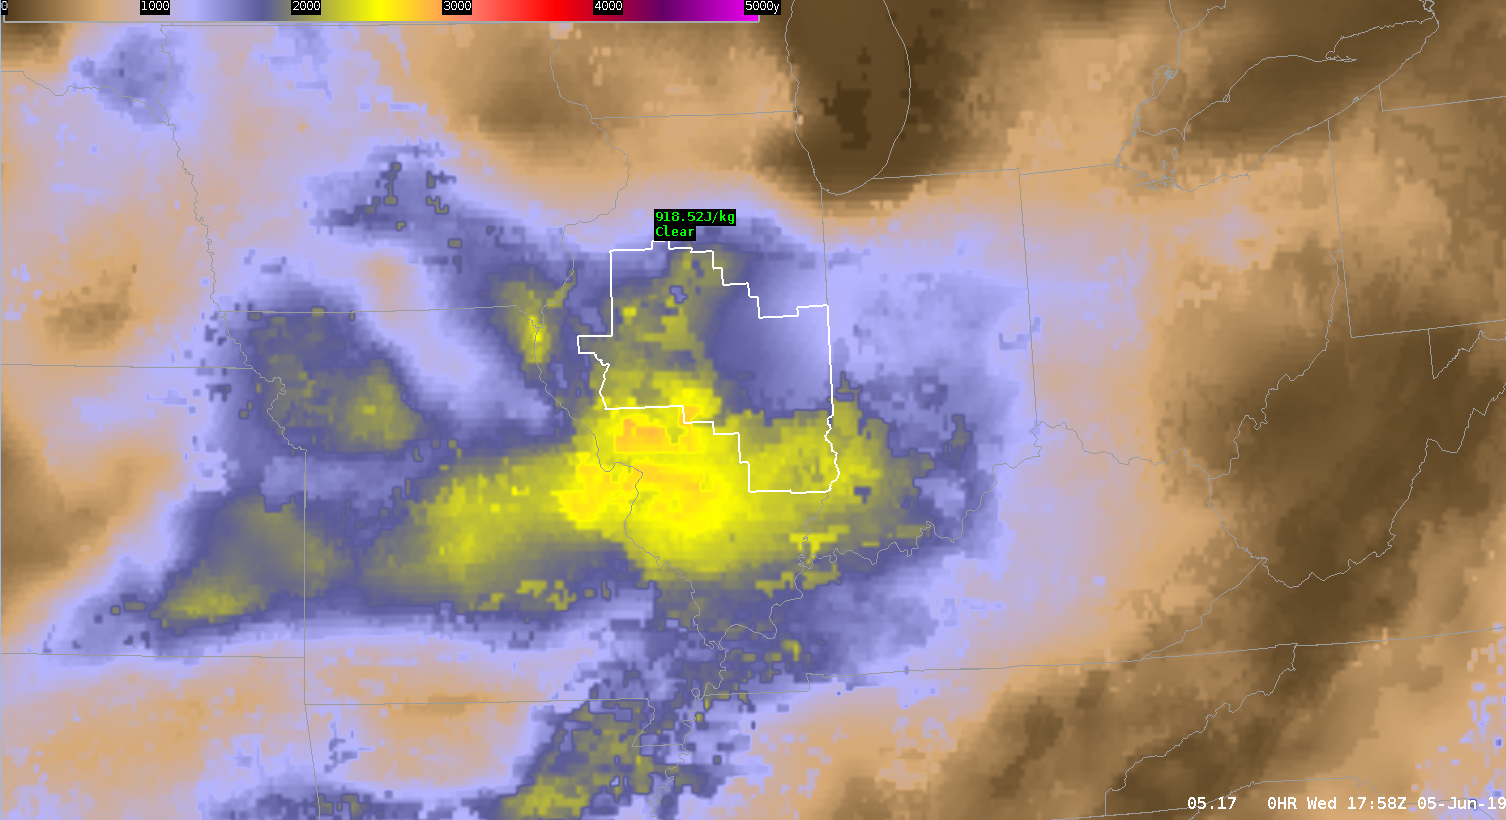
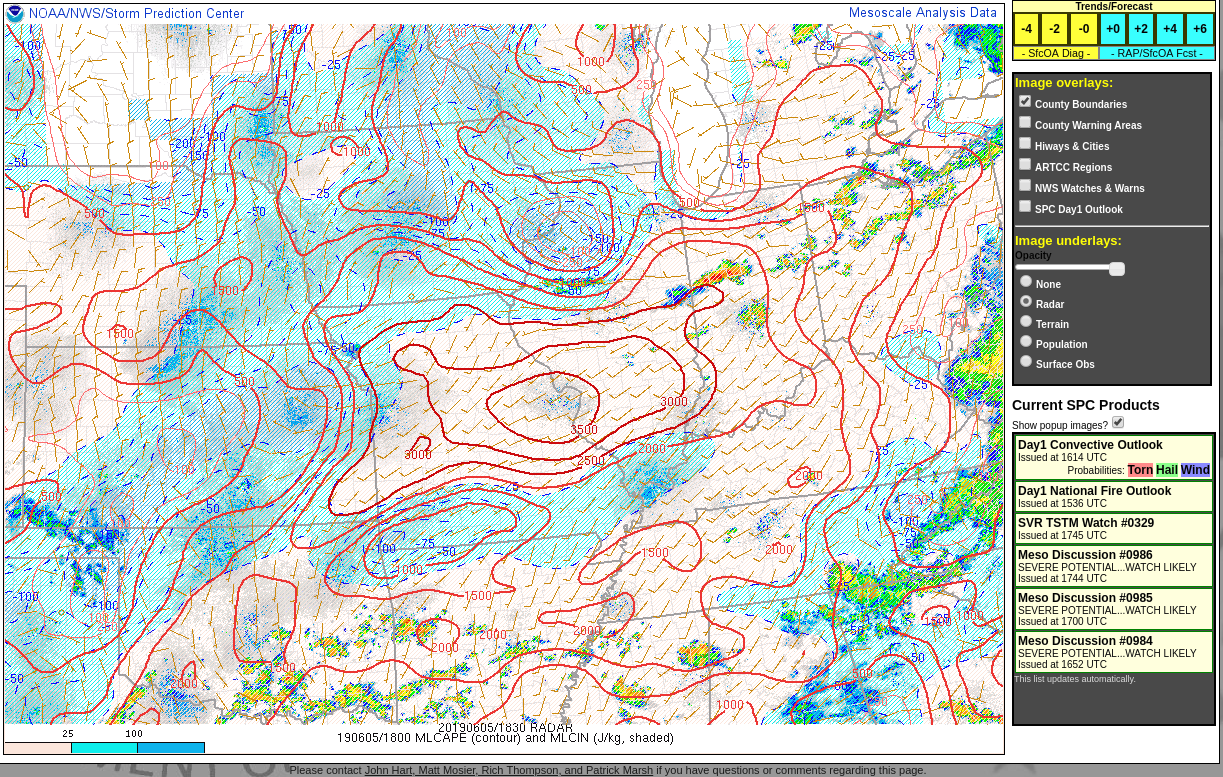
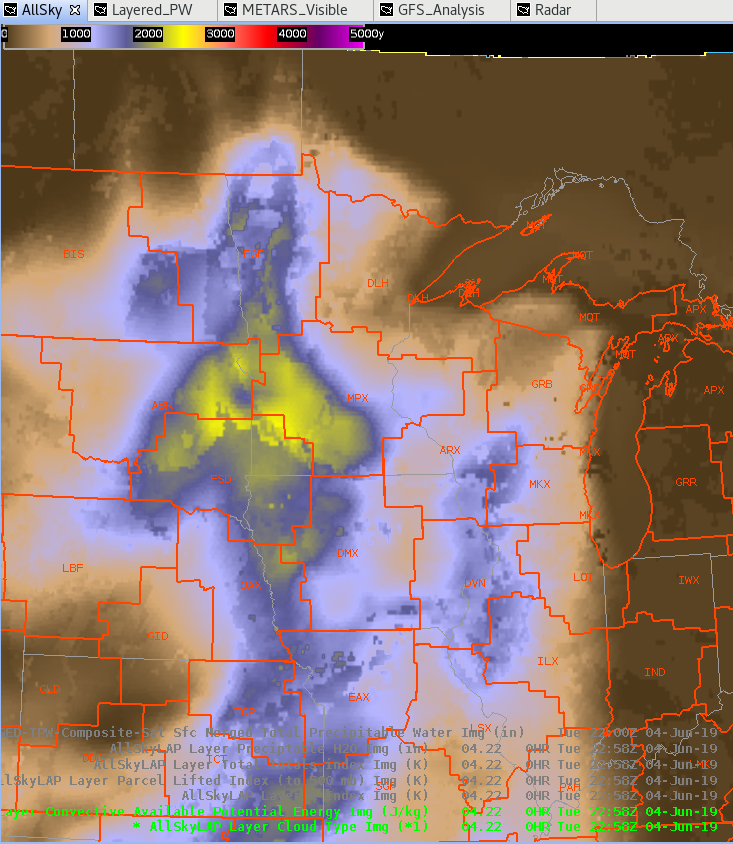
Taking a look at a quick comparison example of when the model fill-in of the All_Sky CAPE product may not be the best solution. In this example, an ongoing MCS was diving south through north central IL earlier this morning before it dissipated rapidly over the central part of the state. The GFS model struggled depicting the rapid de-escalation of said storms, and attempted to stabilize much of the ILX CWA in its wake. Unfortunately, this led to quite the gradient between areas where clouds prevented in-situ satellite observations to be utilized in the All_Sky CAPE product. Taking a look at the SPC Mesoanalysis (RAP) output in image 2 for comparison, the more accurate CAPE values across eastern IL should be closer to the 2500 – 3000 J/KG range while the ALL_Sky CAPE layer (Image 1) is showing 1000 – 1500 J/KG tops. A suggested best practice to overcome this discrepancy is to include the AllSkyLAP Layer Cloud Type Image underneath any AllSkyLAP product so you can easily depict what is sensor derived and/or model output.
—————————————————————————————————Mountain Bone
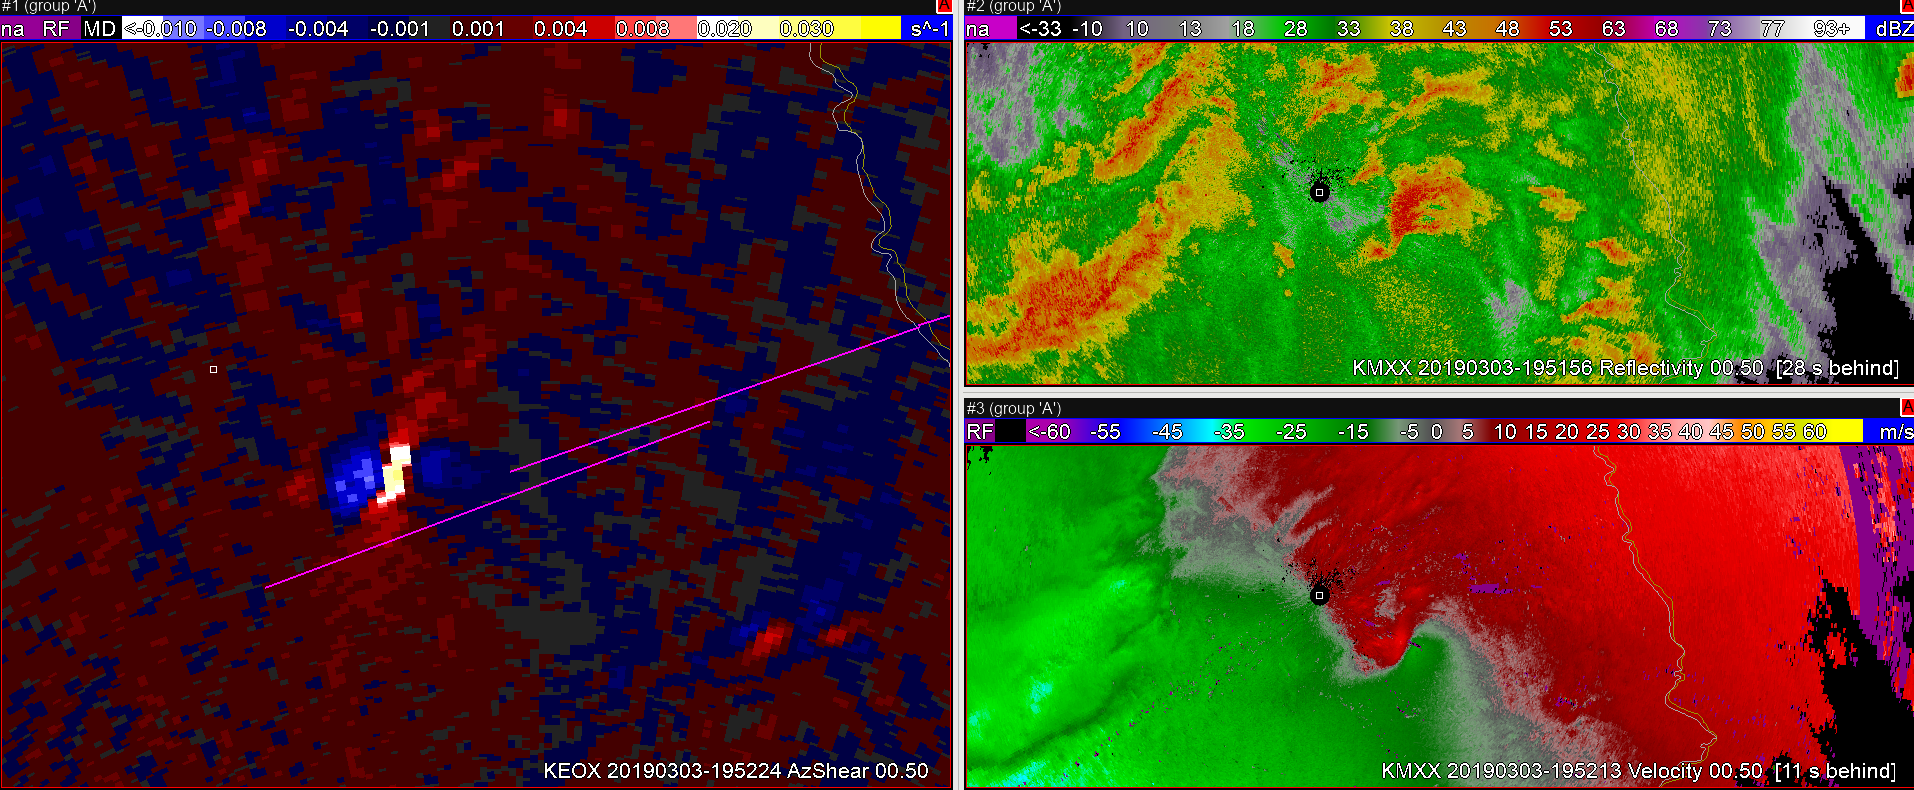
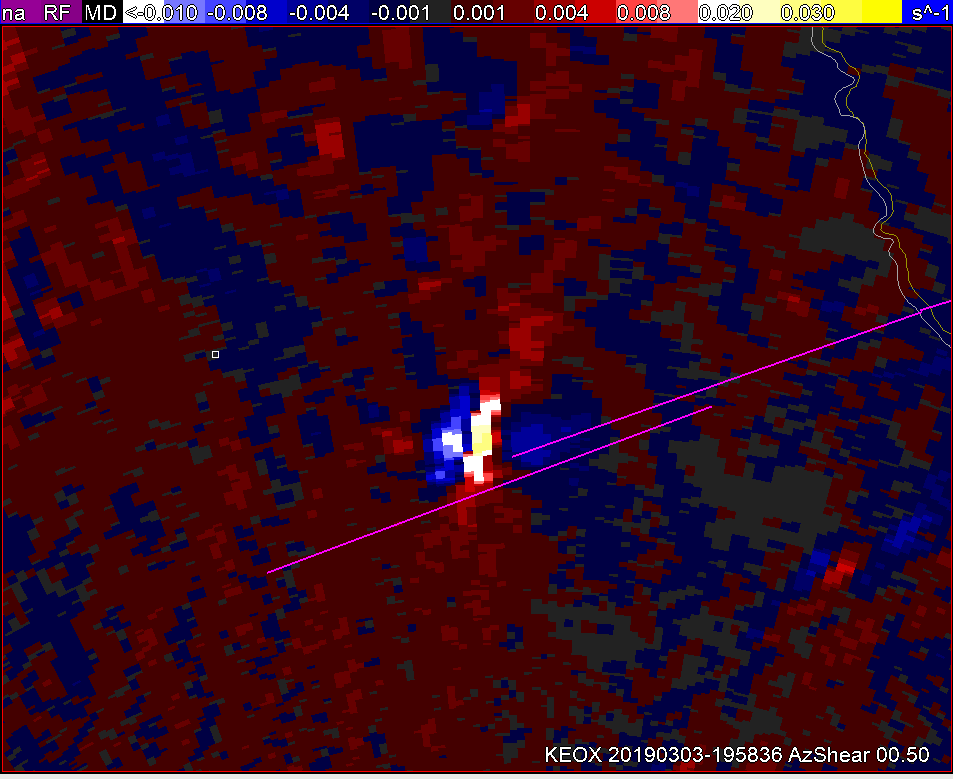
AzShear product for EOX, showing higher elevation rotation, was strong for this cell as it was getting organized. MXX was lower, but the merged shear product picked up on the high value.
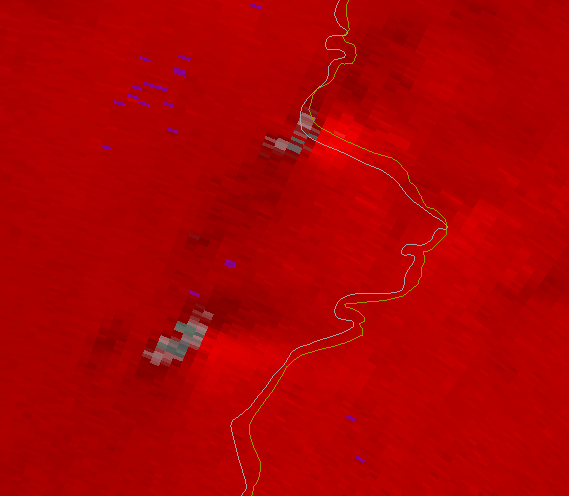
Other Dual Pol factors indicated the supercell was starting to get ready to drop a TOR…with ZDR arc forming on the MXX radar. 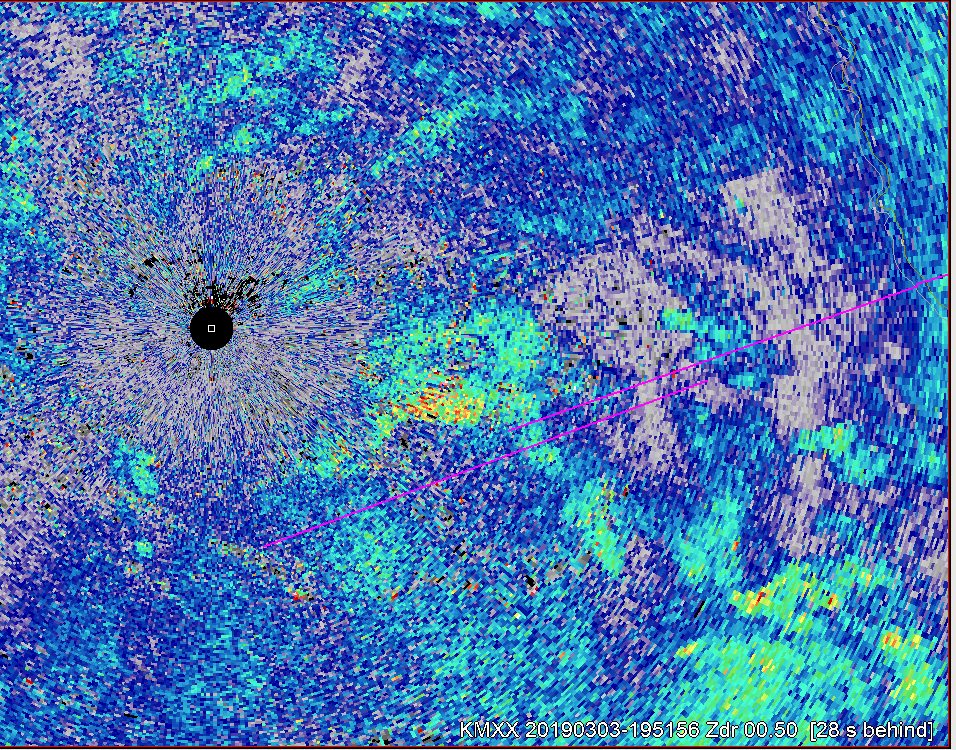
A few minutes later, the MXX AzShear on the base tilt still didn’t show the high values until right at tornado time. 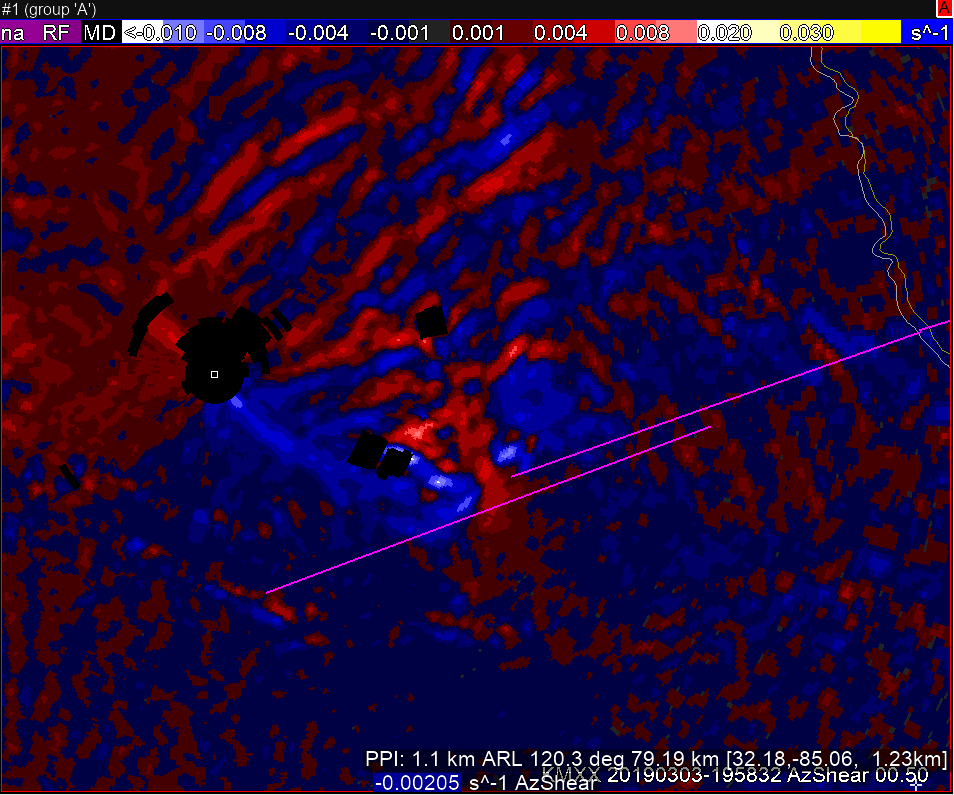
Then at time of touchdown, it showed a better max in the lowest tilt.
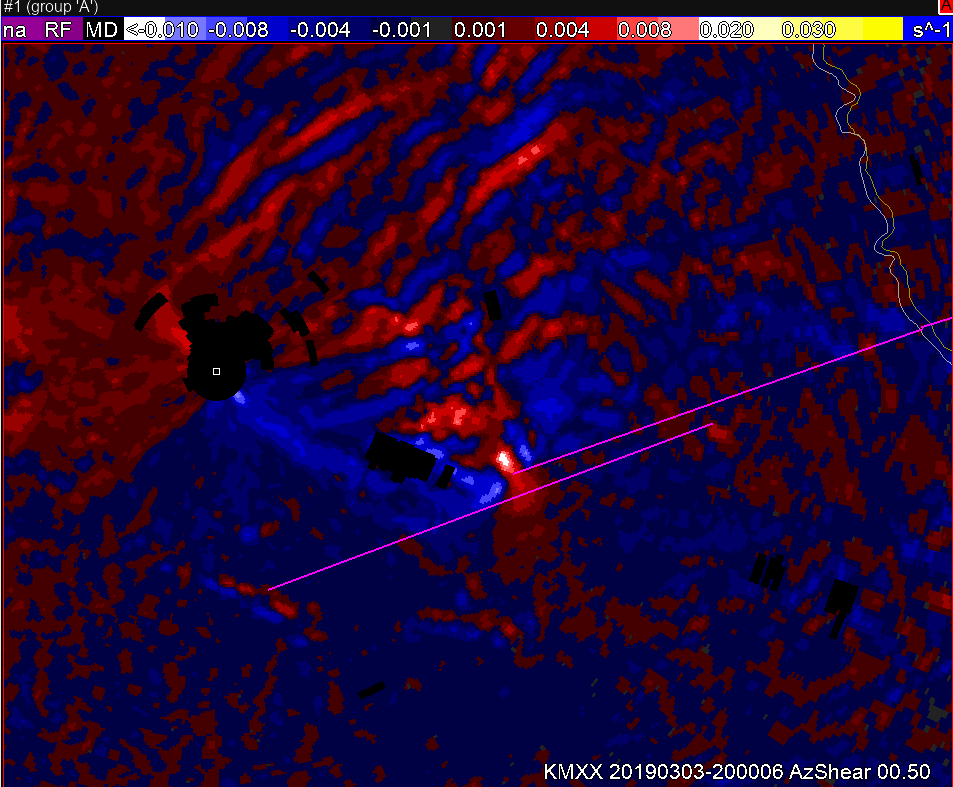
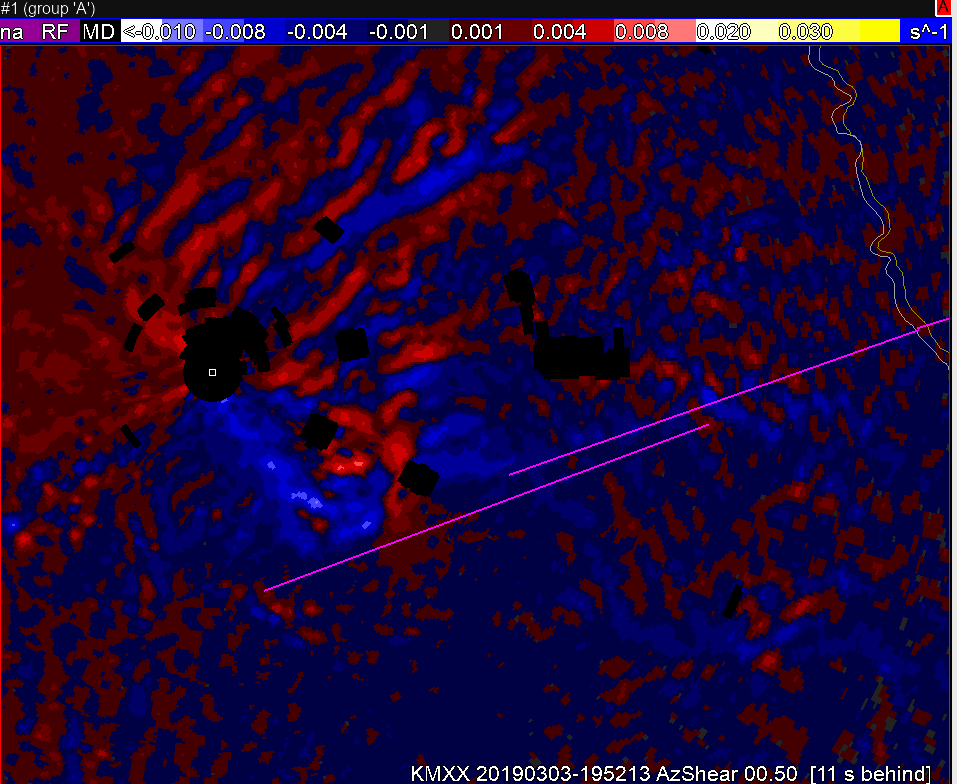
The merged 0-2km Azshear product then cycled down after that max, despite continued higher values from the EOX radar…in fact the trend was getting stronger from that radar, with peak values near 0.03 at touchdown time. Sampling indicated the AzShear on the base tilt was at 1.7-1.8 km AGL at this time, so I would think it still would factor into the 0-2km AzShear product.
Charley
EOX radar depicted two distinct weaker circulations from circulations near the AL/GA border. Both storms had similar presentation on reflectivity and at a broad glance, the relative strength of the circulations were similar. The single radar azimuthal shear depicted that the southern circulation was stronger. One remaining question though is whether the southern circulation was stronger based on proximity to the radar.
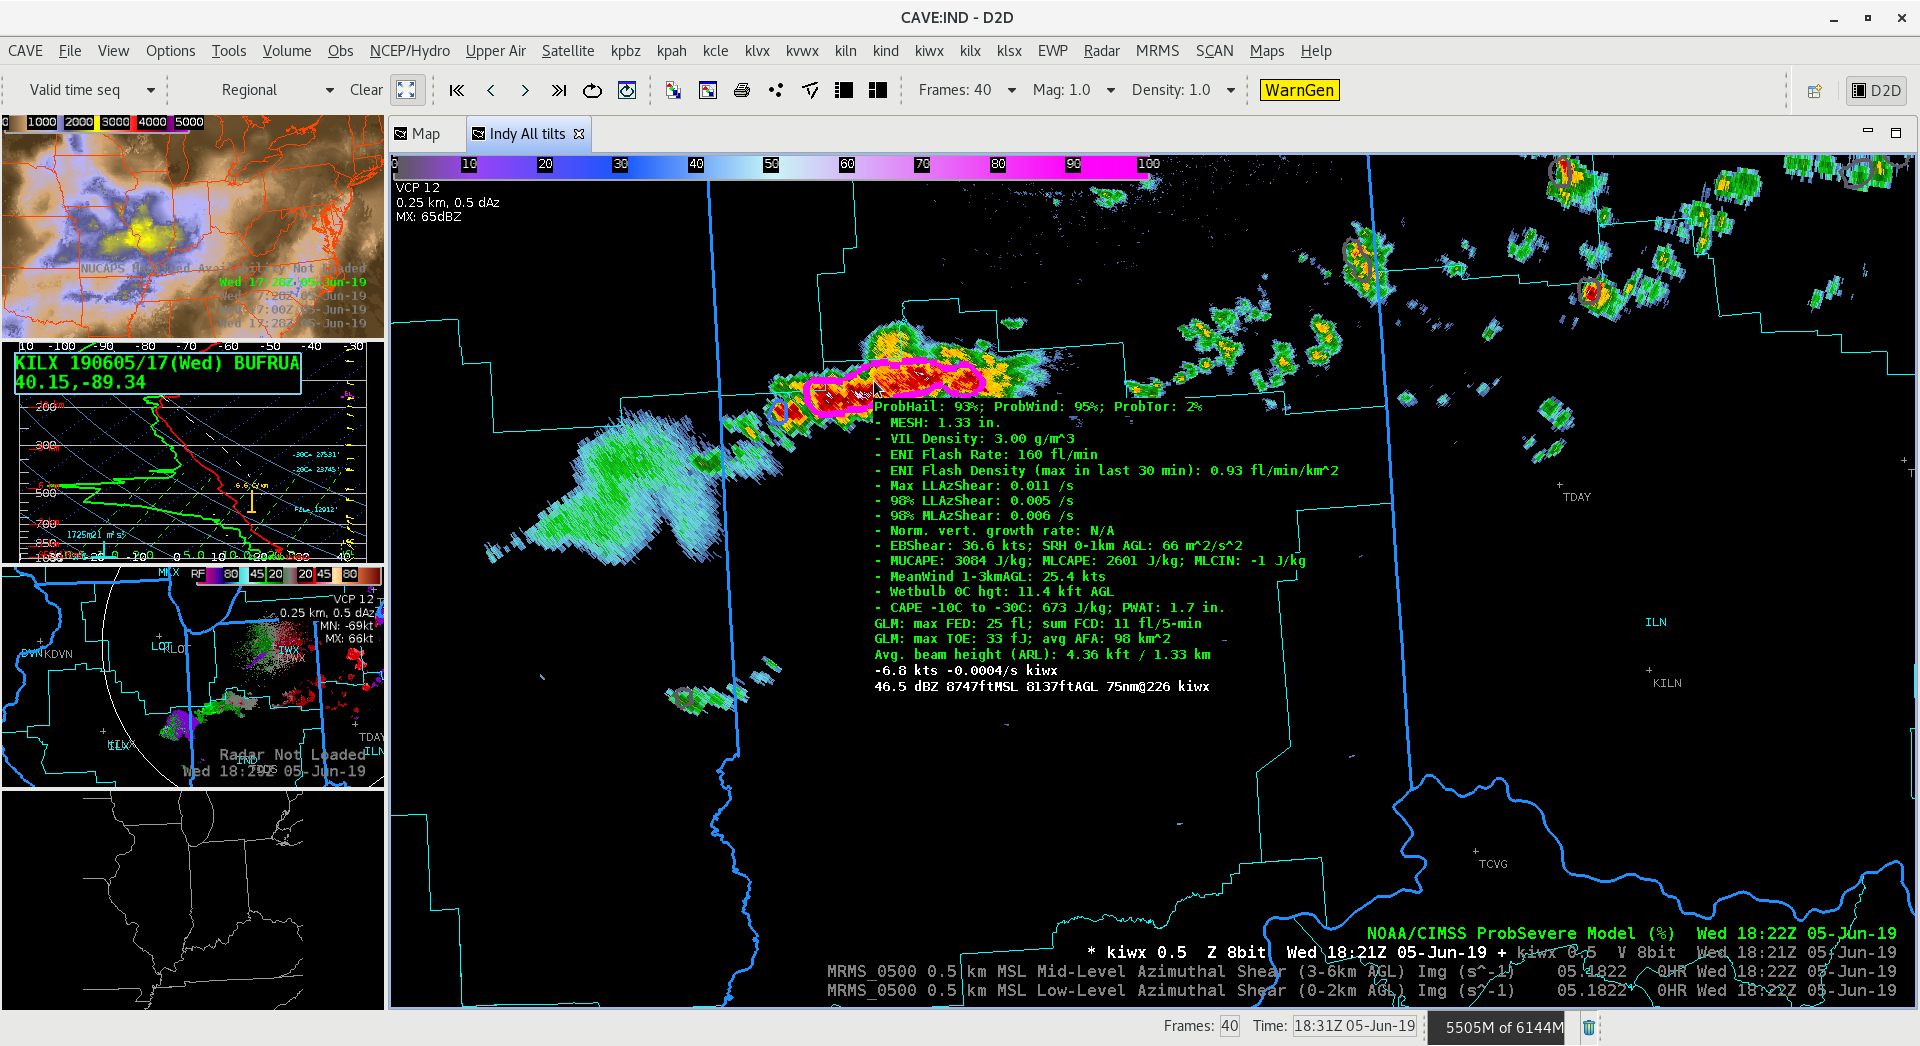
While getting set up on D2D, storms are entering the IND area from the NW. ProbSevere is a great tool for a quick analysis of the primary concerns arising from this line of storms and gives a great starting point for how to further interrogate the system for warning issuance.
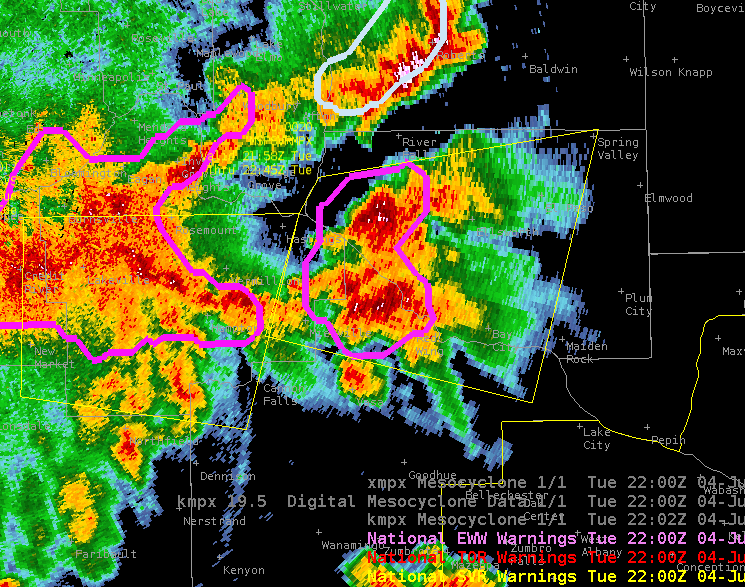
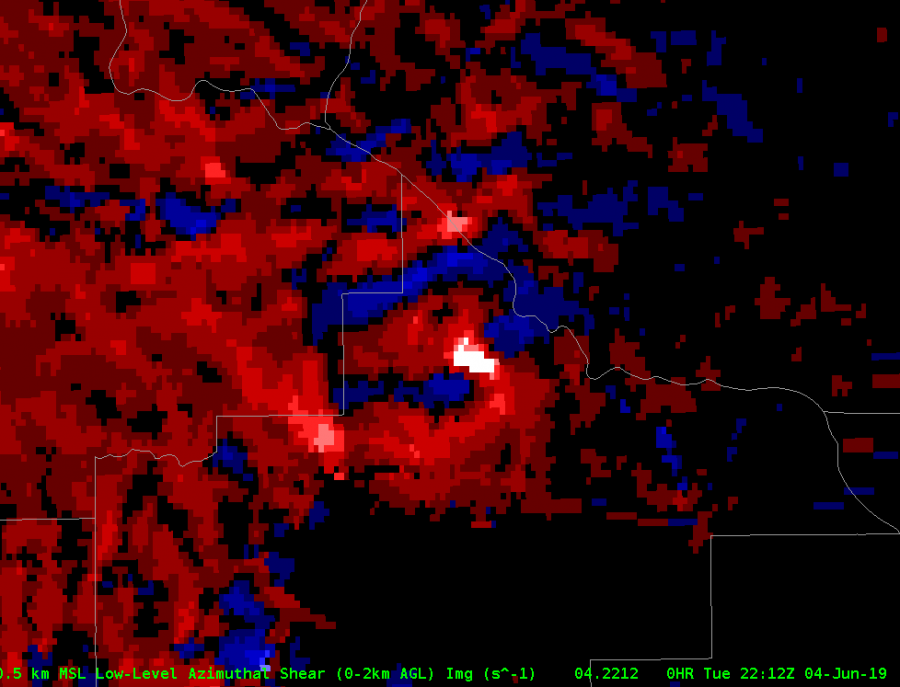
A storm merger was about to occur around 2200z in eastern MN as a northeastward moving reflectivity tag was moving toward the larger likely severe thunderstorm. By 2206z after the merger occurred, the azimuthal shear sharply increased in the 3-6km layer, and radar velocity also showed mid-level rotation (not shown). By 2212z, the azimuthal shear sharply increased in the 0-2km layer, with the low-level velocity (not shown) transitioning to covergent then rotational.
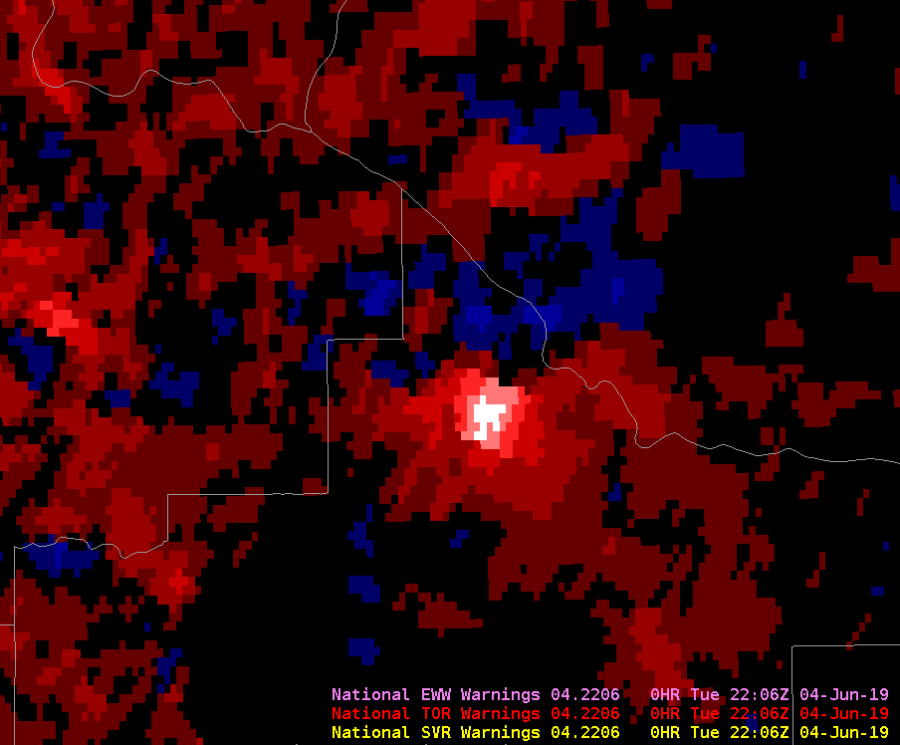
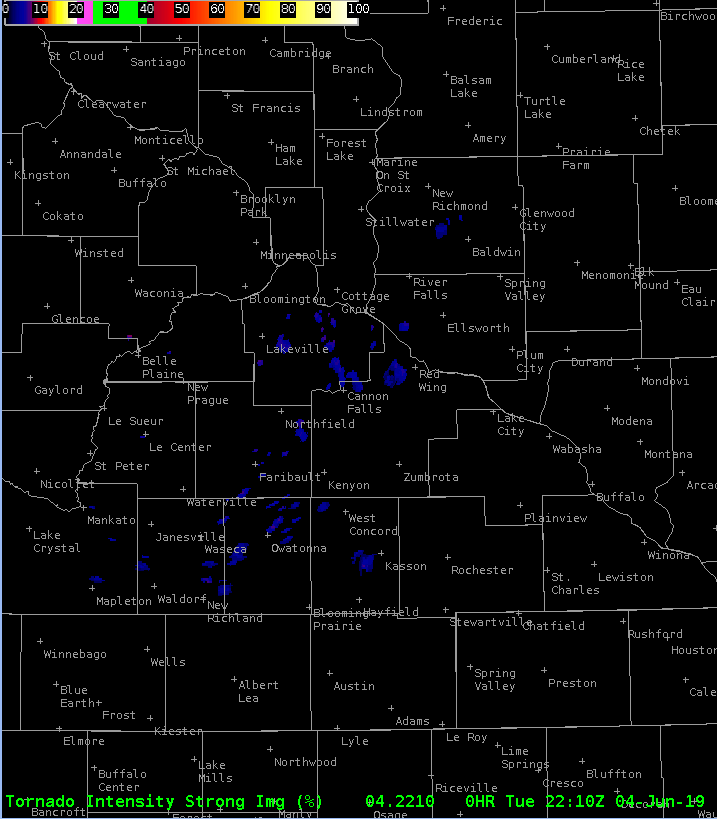
Saw some low percentages in the strong category. Tried to make a color table to pull up those lower values.
Charley
cells persisting in far western CWA has high CAPE on latest AllSky product. However, the line of storms that moved through the middle of the CWA is now in the eastern part and into ARX’s area. Line continues to look severe, with AWOS in northwest ARX gusting to 52 knots, but CAPE not as high.
CHARLEY
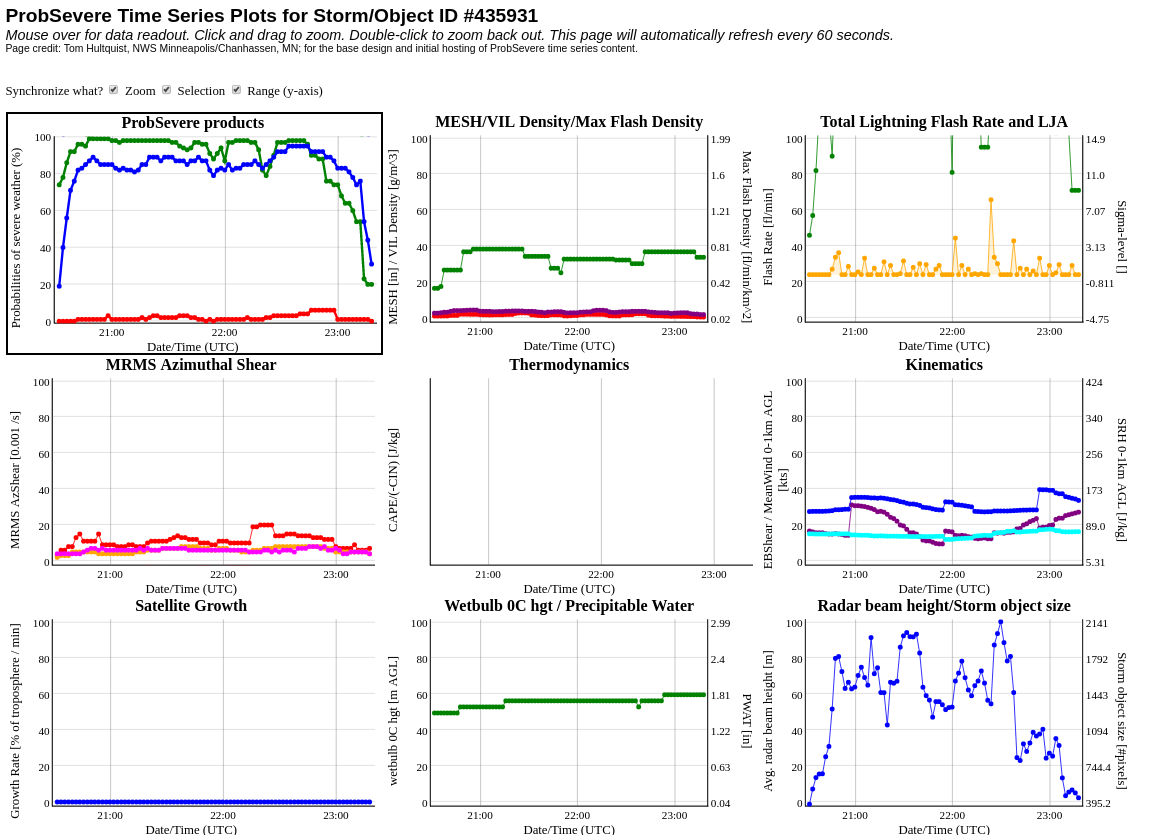
One object ID lasted awhile on the ProbSevere website. ProbTor briefly went up to 6 percent as a cell merged into the line and caused what appeared to be rotation aloft.
Charley