AllSkyLAP CAPE – Trends

Noticed the trend of AllSkyLAP – CAPE was interesting – and bucked the trend of the GFS background.

2157 UTC:  LAP seemed to have a good handle on higher CAPE trends at this timeframe with over 1000 J/kg in a wide area – which seemed to match convective trends.

2227 UTC:  LAP reduced CAPE over much of the area – even in areas that did not see storms.  Skies were generally were generally partly/mostly cloudy – but the trend appeared to reduce values too quickly.

2258 UTC:  LAP CAPE appeared boost again somewhat – but still less than the GFS CAPE.  These sort of “bouncy” CAPE trends will be examined the remainder of the week – to see if this trend continues.


Revisiting the AllSky Products

Went back to do a broader-scale mesoanalysis and noticed right away that storms are initiating right along the southwestern extent of a moisture/instability gradient, and following a SW to NE gradient between two areas of higher PWATs/CAPE, as depicted on the middle image below (reflectivity overlaid on AllSky CAPE). Just focusing on the trend aspect of these products is very useful in determining where storms may continue to develop and roll. I attempted to look at the merged TPW product, but unfortunately, the data I have is almost an hour old by the time of these screenshots, and the lower resolution isn’t as easy to work with in comparison. It’s possible the values of the TPW product may be closer to reality, but gravitating more toward the tendencies of the current state of the atmosphere found in the AllSky products seem to be more useful for this purpose.

~Gritty

Merged AzShear in West Texas – Large Distance from Radars

Looking at the Merged AzShear across West Texas the issue of how many radars are taken into account when calculating different MRMS parameters. You can see the SRM from KMAF, the closest radar to the storms. These storms are rotating in the mid-levels but the radar is looking between 10,000 and 16,000 feet depending on which storm you reference. The Merged AzShear is pegging the storm storms where the circulation is evident, but the question is since KMAF is closest is the AzShear product taking in more than one radar? If it is all the other neighboring radars (KEPZ, KDFX, and KSJT) are all as far or farther away, which means they would be looking even higher in the storm. The image below shows how far the radar are from the ongoing storms.

  • Alexander T.


SJT MNDA

Primary area of interest on this storm is the western-most mesocyclone highlighted by the NMDA. Unfortunately, the NMDA identifies this rotation with several different names, making it difficult to track through time.Sandor Clegane

More Lightning Analysis…

So far, the MFA is following the previous logic of using it as a way to identify vigorous updrafts. Below, the progression in a 15-minute period follows that correlation between the smaller flashes increasing in area indicating a strengthening cell(s). However, I could see its utility degraded in a larger-scale multicell environment with clusters close together, especially as the areas of smaller flashes increases, given the low-resolution of the grid itself. As for Total Optical Energy (TOE, at the bottom), I think there is benefit in using this product as well to monitor trends, but I had to use a different color curve for it to stand out to me more (last animation, below).

~Gritty

2146Z:

2155Z:

2200Z:

TOE Loops:

AllSkyLAP – CAPE vs Radar

Easy display for SA is to plot radar (Z) over the AllSkyLayer CAPE.  In this case – storms are moving off slowly to the NE – in an area of similar CAPE values.  With expected cloud cover, further destabilization is not anticipated.  Thus, would expect storms to remain at current levels – or perhaps slowly intensity.  Would need to be monitored – but “rapid intensification” is not expected.

NUCAPS – PopUp SkewT – Needs Improvement

One way to increase NUCAPS sounding data usage is to improve the ability to display “mouse over” soundings using the PoP-Up SkewT.  See the example below – I was able to mouse over the various points and display the NUCAPS soundings.

However, the PoP Up SkewT display is small, crude, and cannot be enlarged.  If a version of NSharp could be integrated into the PoP Up SkewT (e.g. larger SkewT with thermodynamic variables below) – then forecasters might use it more often.  The current PoP Up SkewT is probably 10 yrs old – and needs improvement.

SJT Mesoscale Update #2

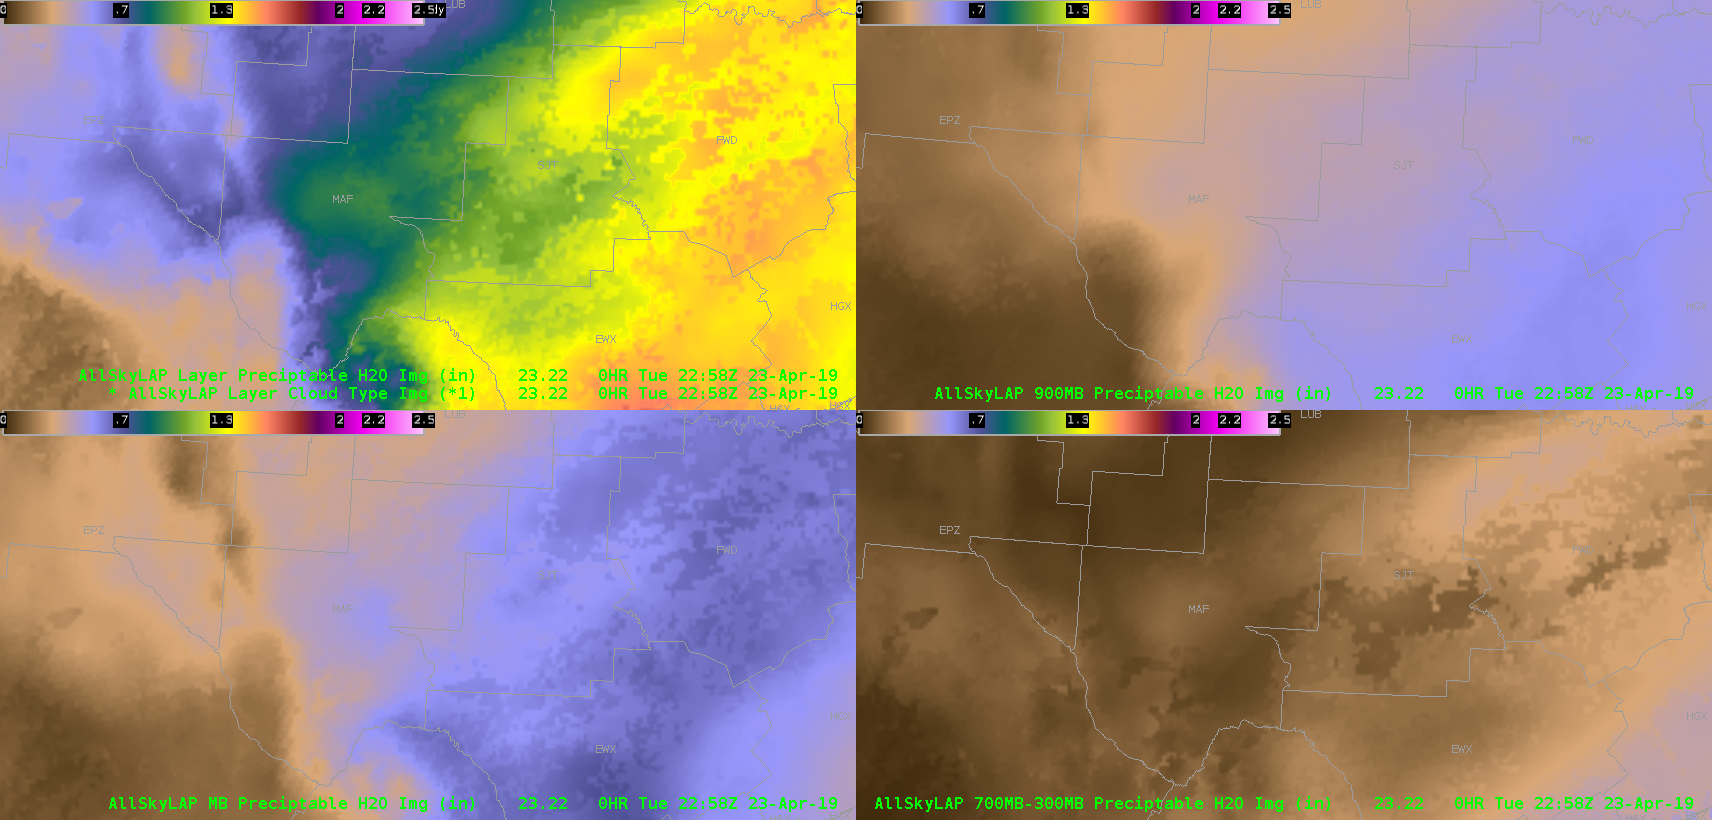
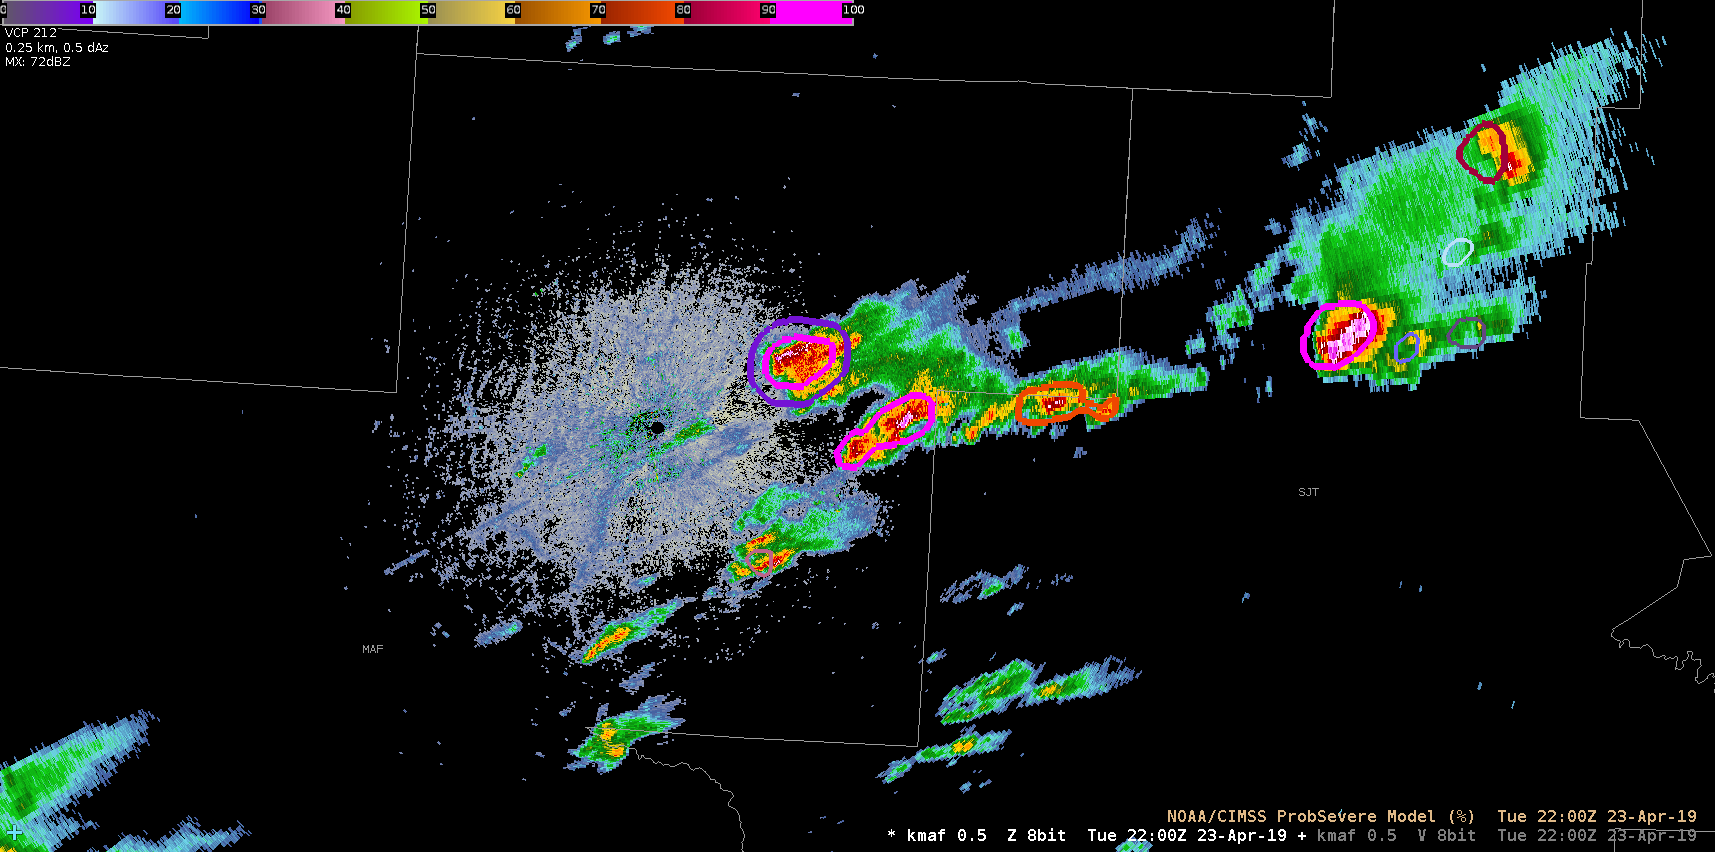
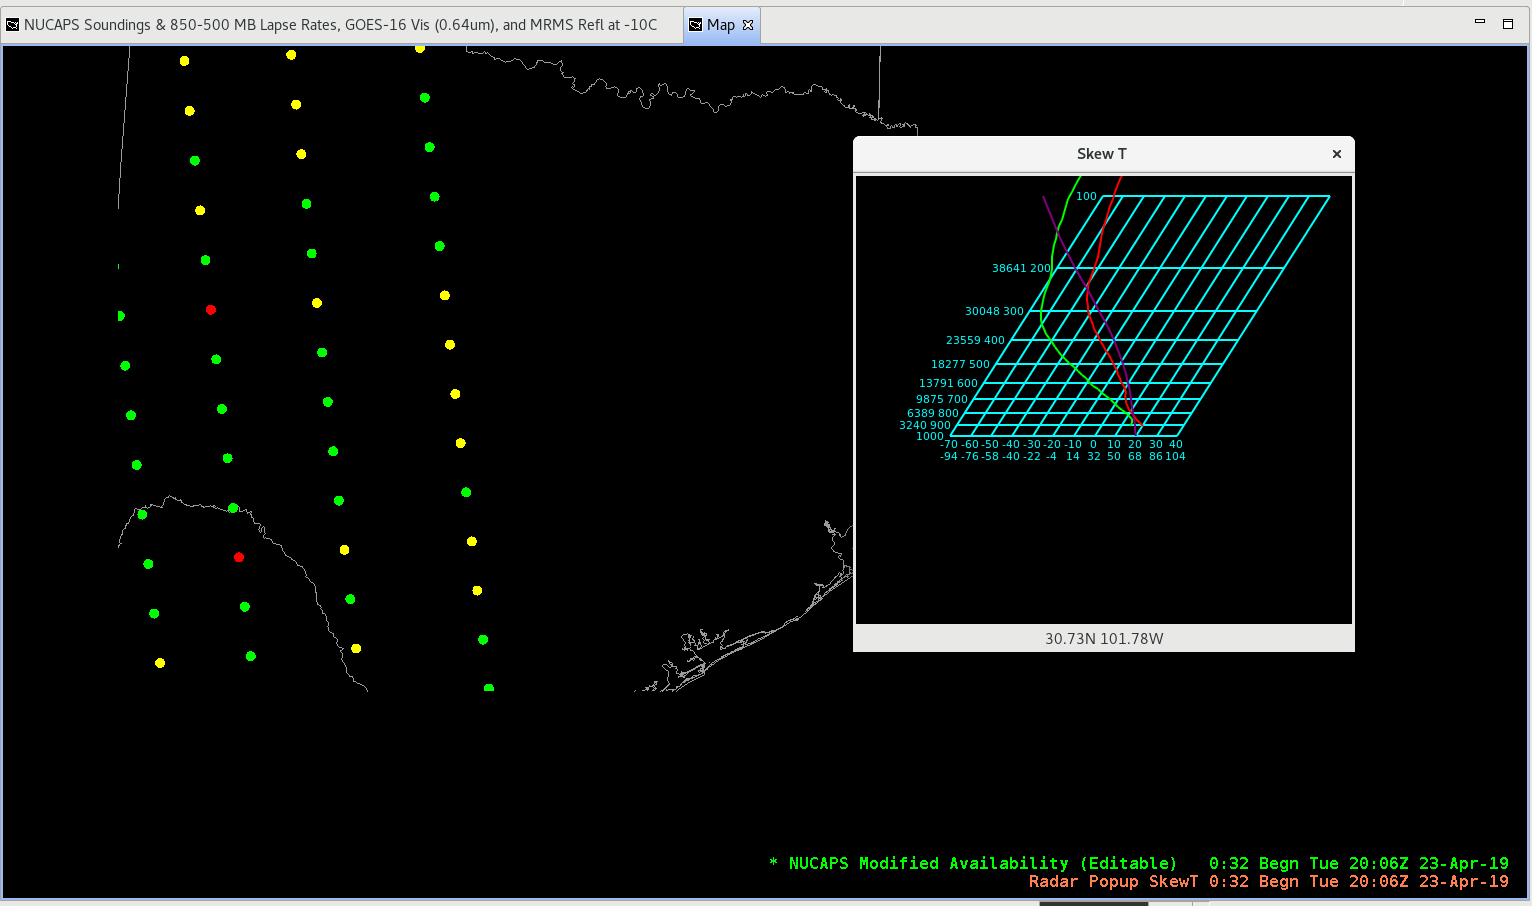
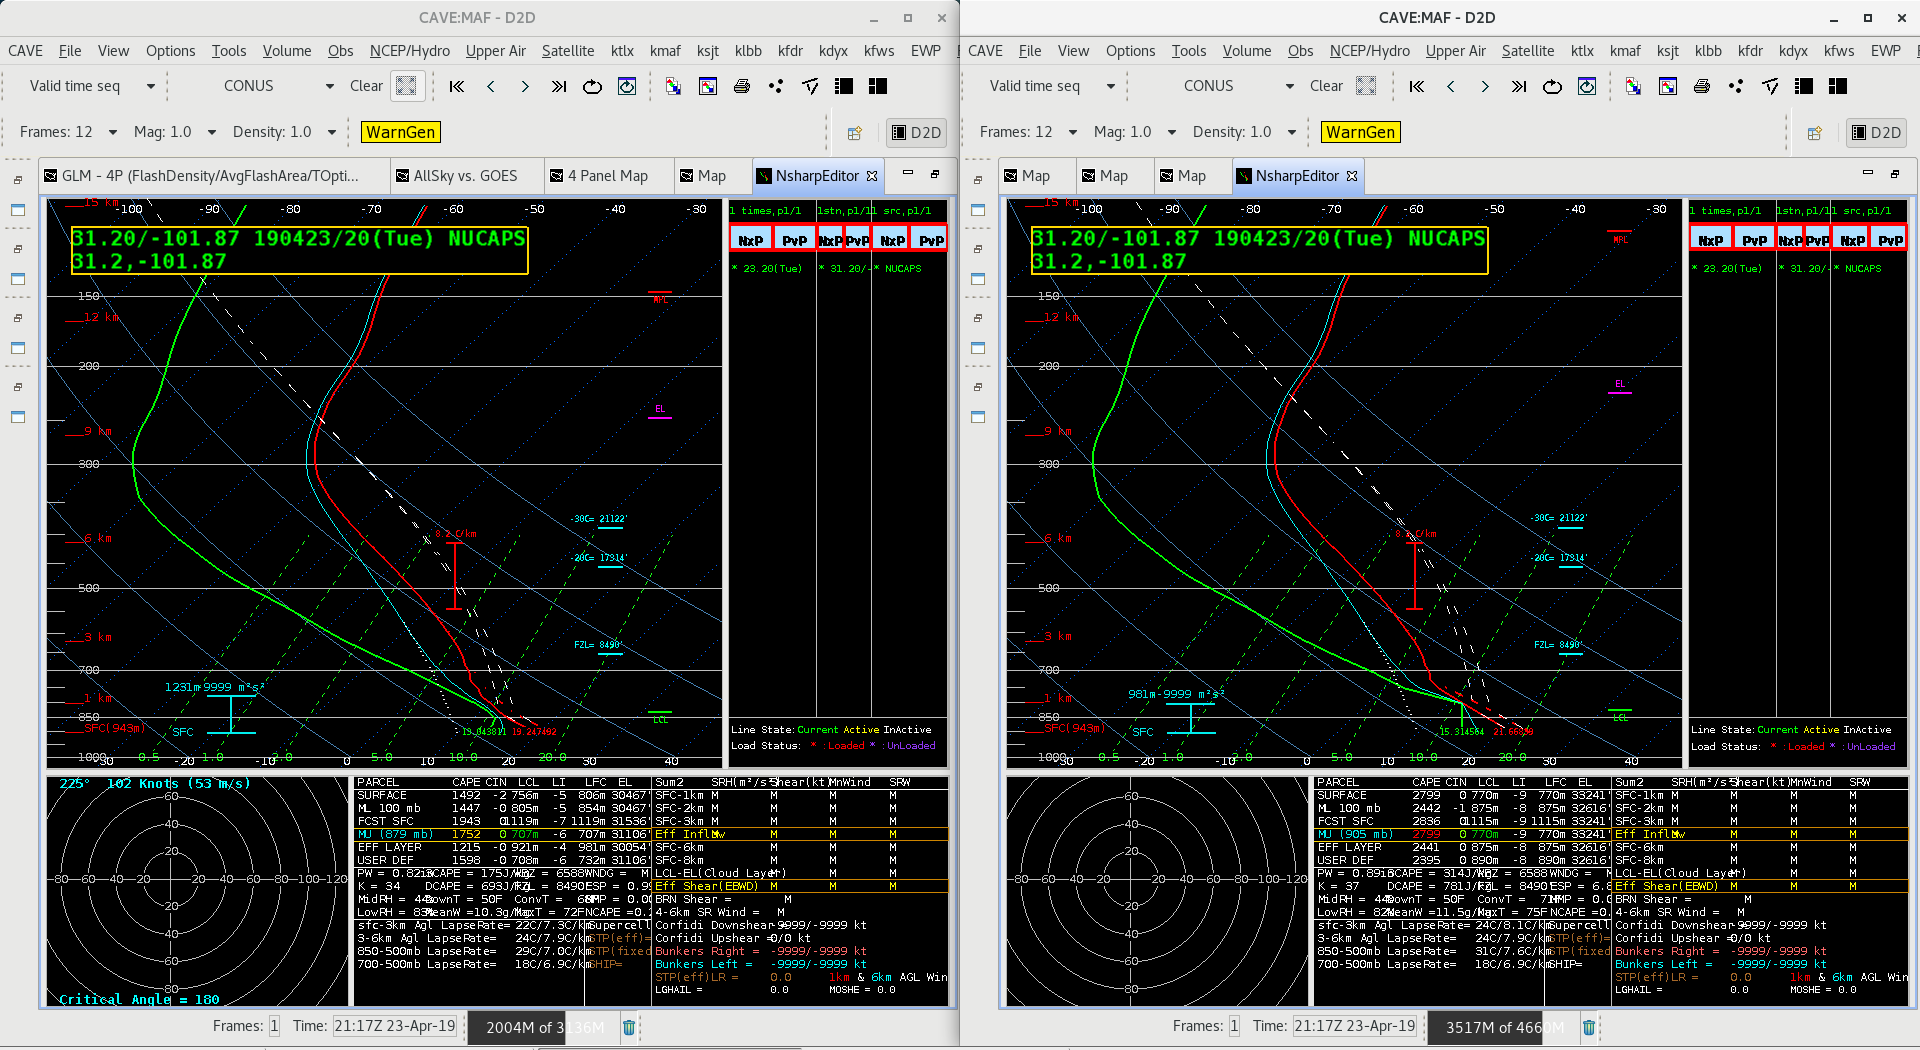
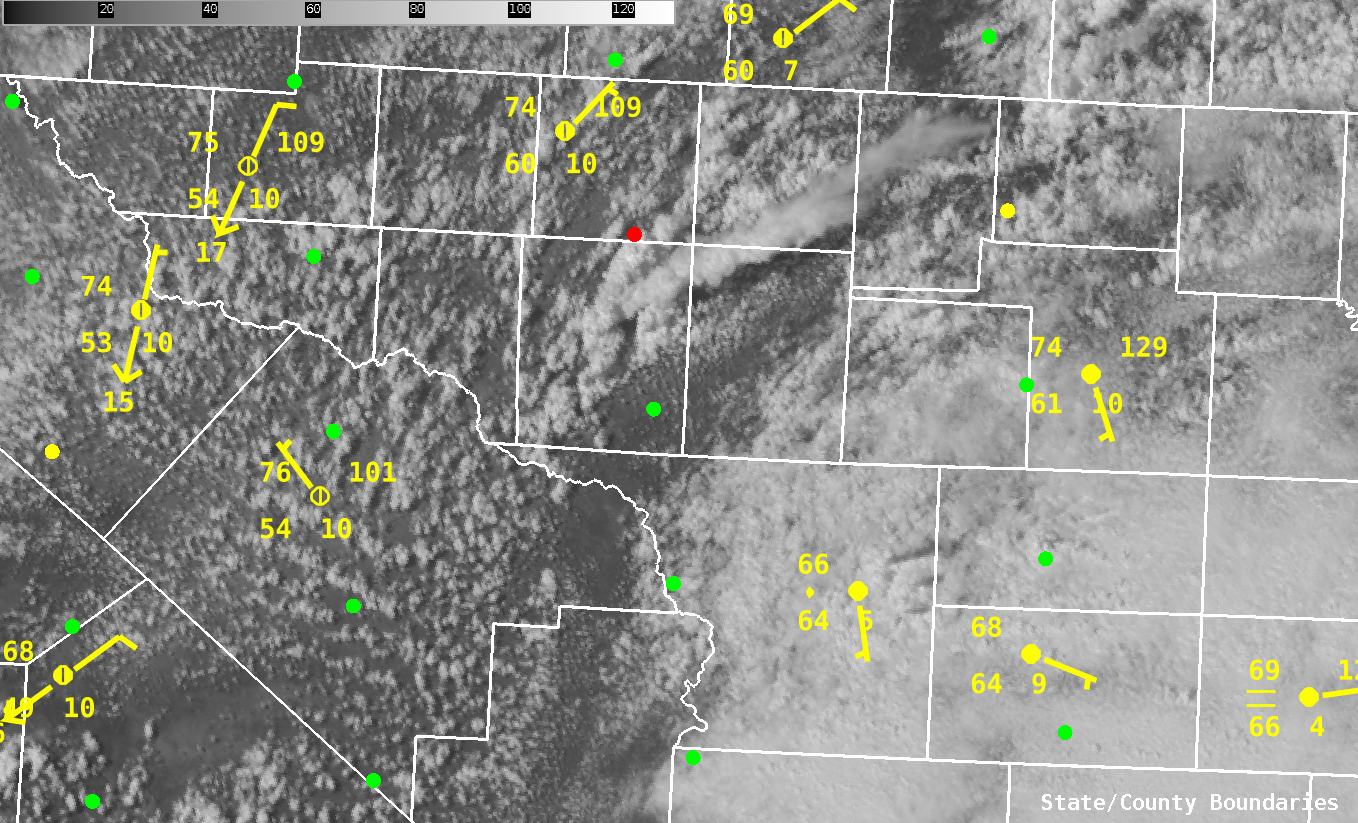
NUCAPS retrievals  became available around 21z, so I decided to do a new mesoscale analysis. I wanted to know about the air in the warm sector that the storms will likely be ingesting. The first retrieval I looked at was the southern-most green dot in the eastern most MUCAPS swipe. The sounding in this retrieval came in with a surface temp about 20 degrees cooler than the observation, so I’m thinking this retrieval is either being contaminated by ongoing convection or actually sampling north of the warm sector. The retrieval just to the south of that had surface temperatures more reasonable, and the associated skew-t is shown below.
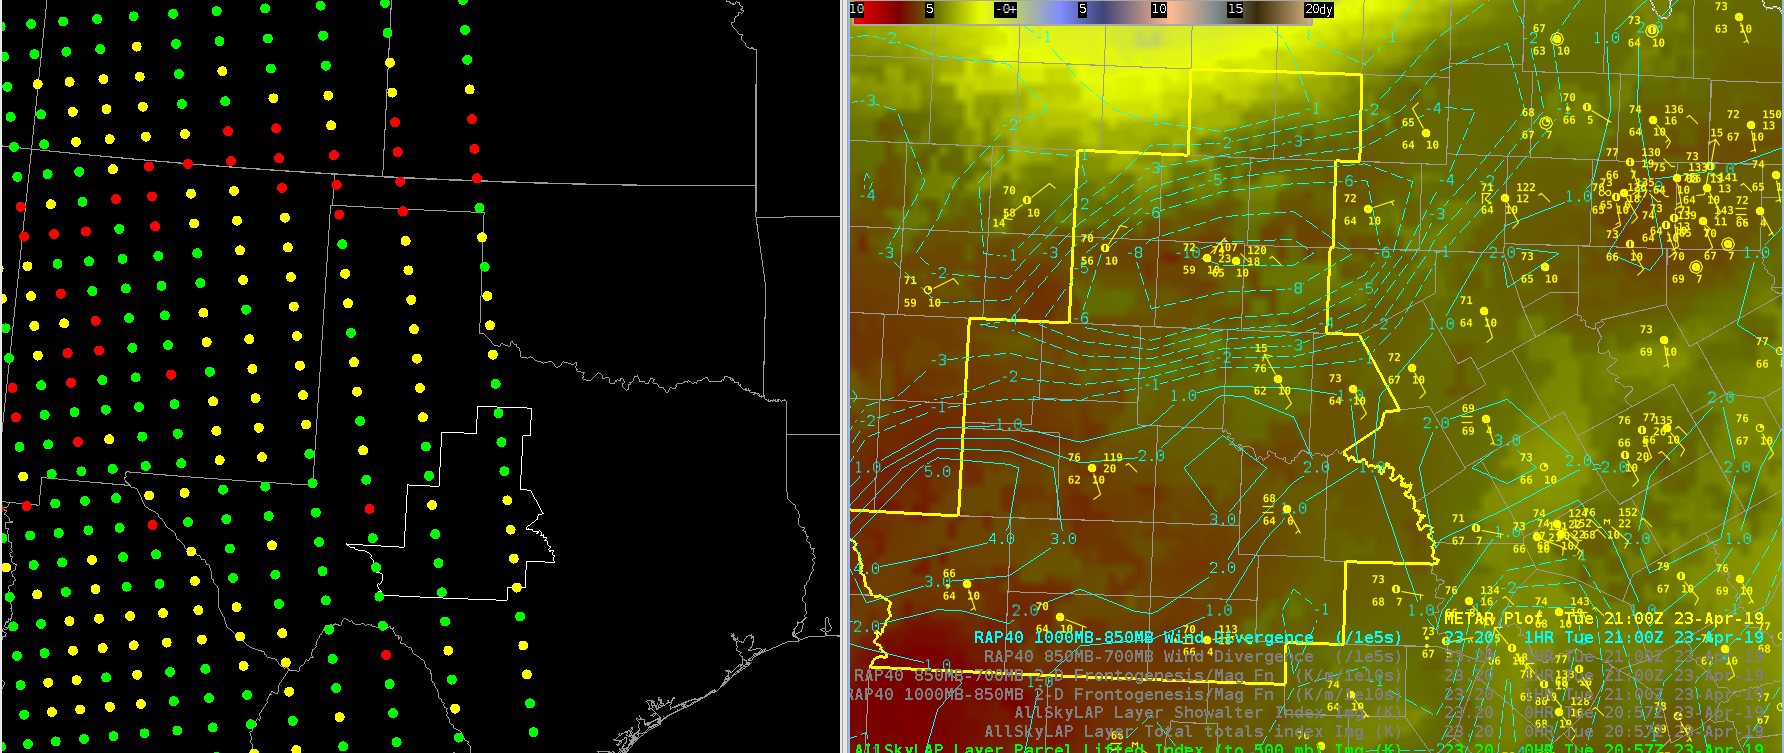
After a quick adjustment to the lowest points on the sounding, this clearly looks like a severe weather sounding. I’m hesitant to rely on CAPE estimates given the dependency on the boundary layer, but indicies more reliant on mid level obs (LI) are still indicative of strong to severe storms. This compares well to all-sky LAPS retrievals (above, right).
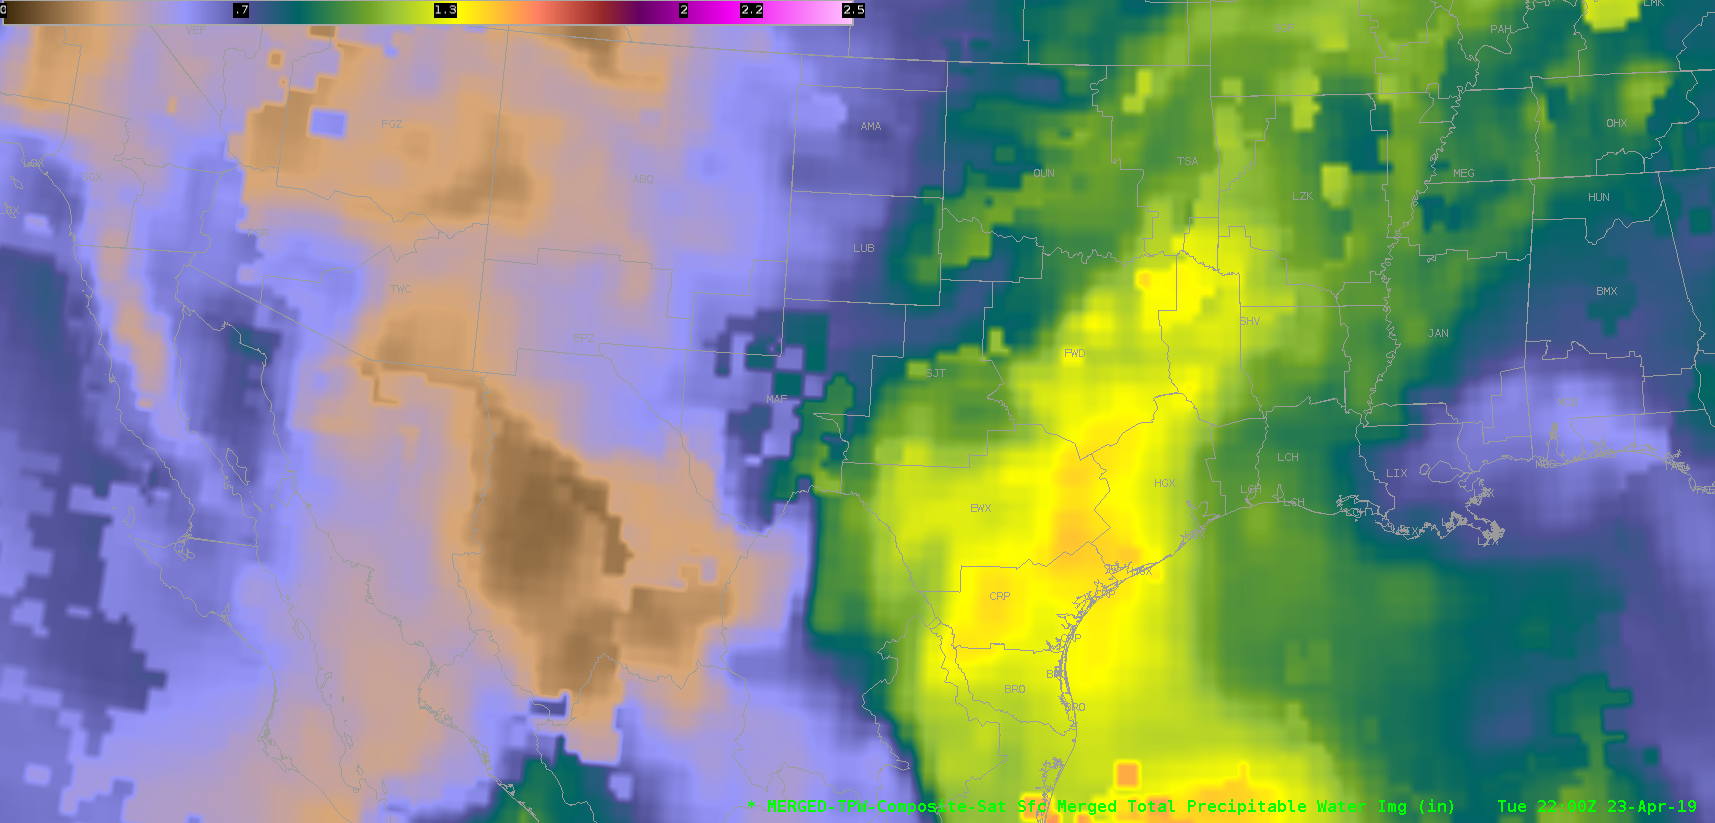
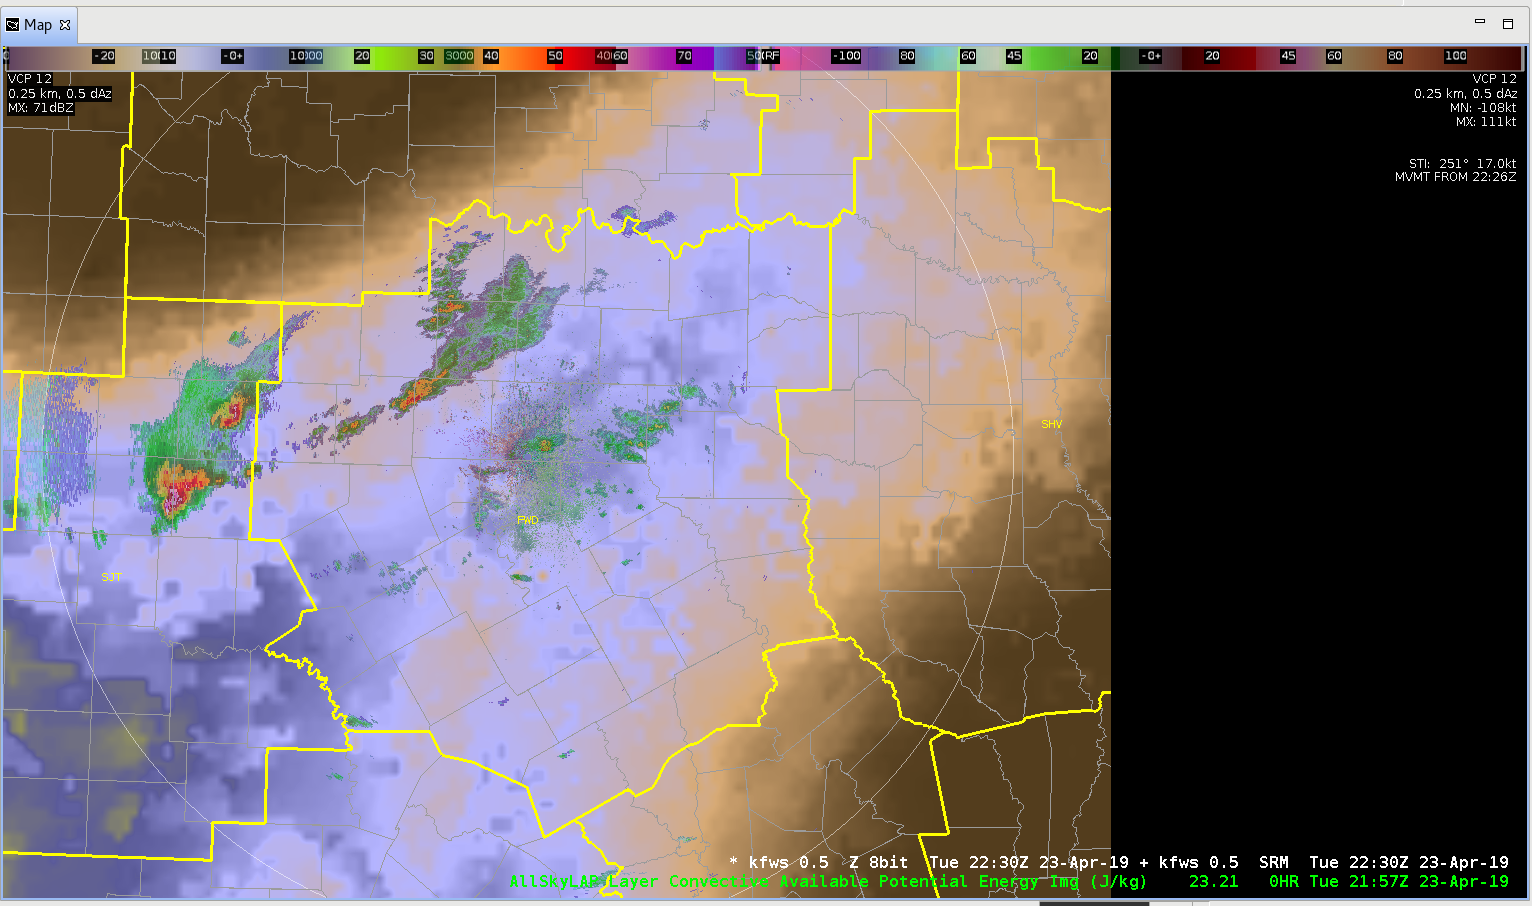
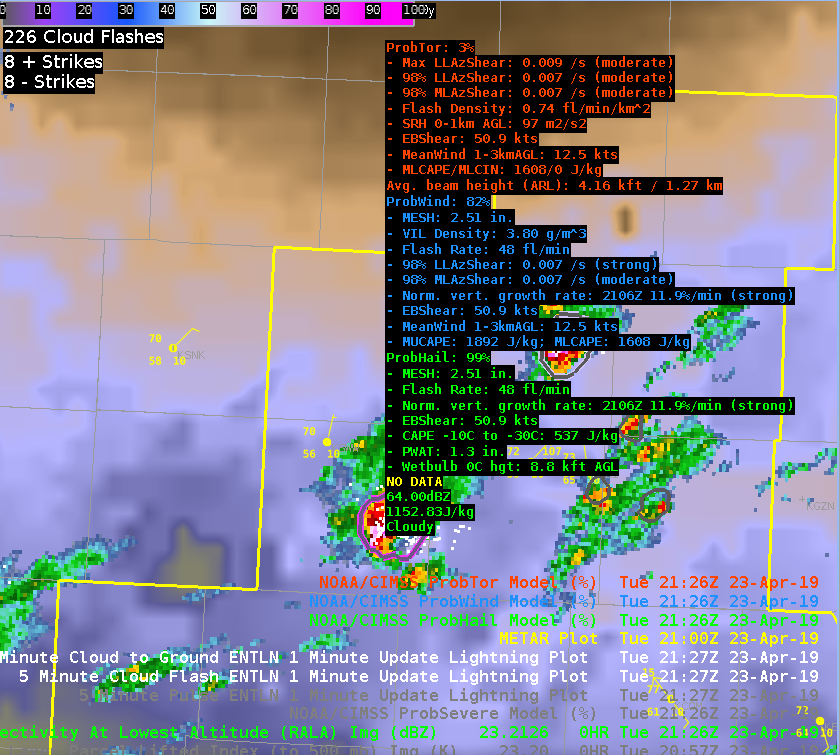
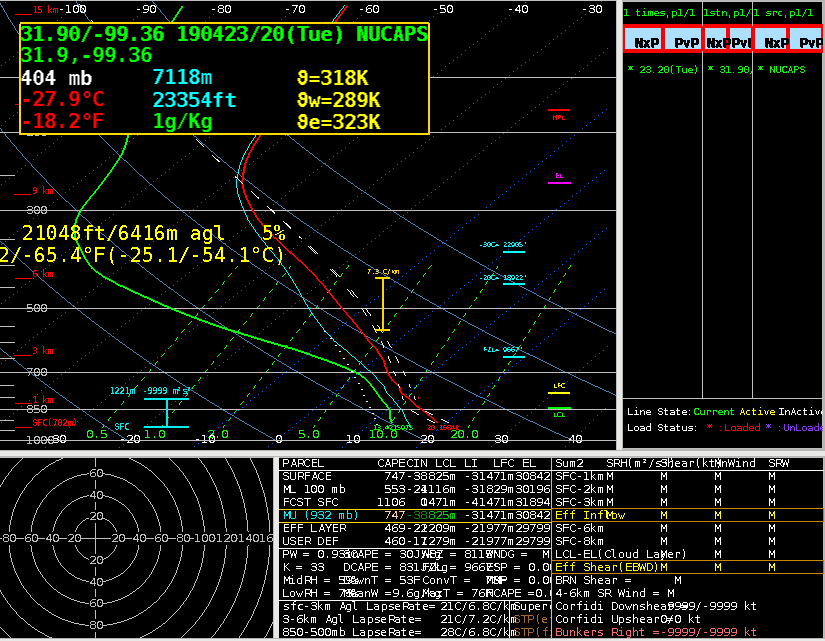
In typical operations in which I do not have access to these products, I would rely on the SPC mesoanalysis (below) to estimate instability. The NUCAPS and LAPS All Sky retrievals do somewhat increase my confidence that the mesoanalysis is close to reality. However, Given my conceptual model of how the atmosphere should be behaving, I was already highly confident that the atmosphere is quite unstable in the warm sector, so the increase in confidence from NUCAPS/LAPS is somewhat limited.
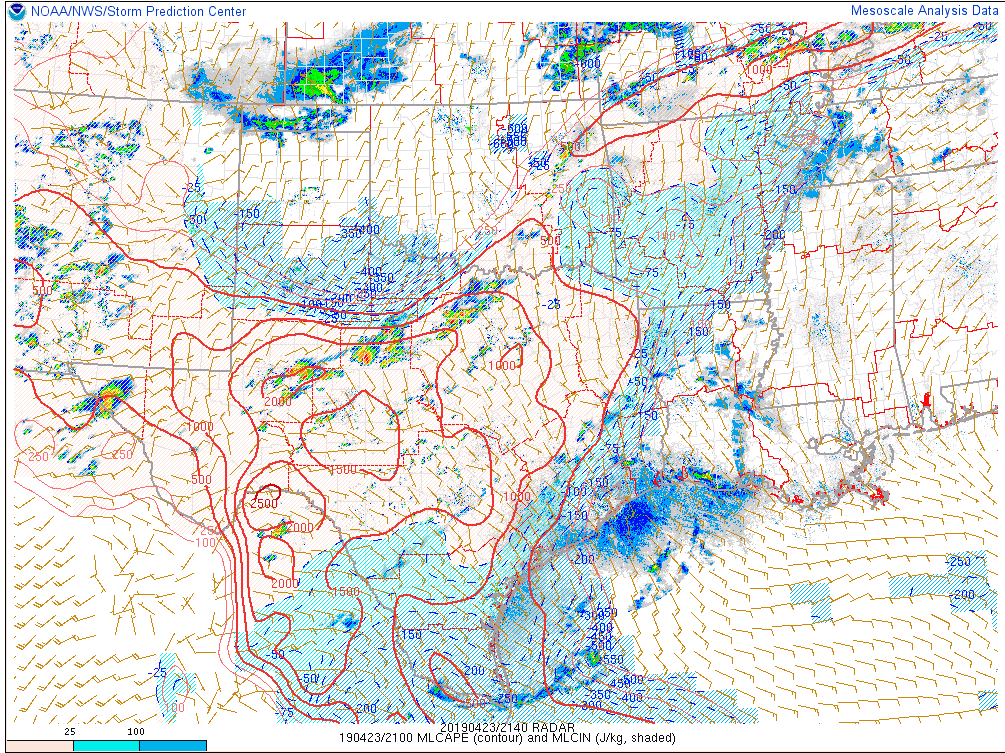
Sandor Clegane

NUCAPS Modified vs. Non-Modified

With an afternoon pass of NOAA 20 there are now NUCAPS soundings over our active area of MAF and SJT. Looking at the non-modified and modified soundings there are several different things to note. On the image below the raw NUCAPS sounding is on the left and the Modified is on the Right. From this view it may be hard to see the differences, but a few are listed below.

  1. Based on the location of the sounding and the surface observations (the location is the green dot just south of the red dot in the image below) the modified sounding DOES DO A GOOD JOB at the surface. The Modified Sounding has T=71 and Td=60. The non-modified sounding shows T=67 and Td=55. Looking at the surface observations below the modified sounding is more reasonable with Td around 60 and temps in the upper 60s and lower 70s.
  2. Just above the surface though there is some questionable signatures. First it appears the modified sounding assumes that there was a cloud deck around 1km (T and Td almost the same). This is questionable as the visible satellite below does show more clear skies around the point. As that point is right along the front there has been mostly clear skies near that point. How it handles these parts of the mixed layer are more questionable.
  3. These differences to make a BIG difference in the severe weather environment. Most notably CAPE. If you look at the surface CAPE it goes from 1492 in the non-modified to 2799 in the modified. That is significant, especially when these supercells are producing hail. There has been a 2.5 inch hail report to the east of this dot location, which does lend itself to pointing towards larger hail.

-Alexander T.