In an otherwise stable environment…

The OT detector caught one spot amidst a long line of moderate rain and thunderstorm activity moving through Tennessee on Wednesday afternoon.

OTdetectorTN

See? There it is! Taking a look at the IR imagery, this overshooting top sticks out like a sore thumb.

GOES-14IRSampling showed that this OT was about 15 degrees colder than the surrounding cloud. In this situation, the signature was very easy to spot on both products. However, this cell did not induce a warning of any kind. Radar imagery did show that this OT matched up with the area of heaviest rainfall in the storm line, maxing out around 55-60 dBZ.

Tags: None

CI product doing well in east-central OH

CI Product at 19Z
CI Product at 19Z

The CI product has performed quite well today across east-central Ohio.  It has consistently been showing 50+ probabilities across east-central Ohio.  Above shows these higher probabilities at 19Z.

CI tool at 20Z
CI tool at 20Z

By 20Z, convection had fired in these areas of higher probabilities.  Additional higher probs remain, which is also where some echoes are beginning to show up on radar within this corridor.  Overall, very good performance today!

Tags: None

Prob Severe Tool Underdone

Prob_SevereIn this case, the prob severe tool seemed very slow to react to this intensifying tool.  I would have warned about 2 to 3 scans before this picture.  In this particular picture, it shows a solid hail core around 25,000 feet AGL which was there for one to two scans prior.  However, the MESH is only indicating 0.71 inch hail, which is quite underdone in my opinion.  This low MESH is driving a low severe probability, 41% in this case.  In this case, the probsevere tool would likely have missed the first reports of severe hail due to a seemingly slow response time in the MESH product, which gave falsely low values in the probsevere tool.

Tags: None

NSSL-WRF simulated imagery vs. rapid-scan GOES

I wanted to see how the two types of simulated imagery compared to each other, and compared to reality. Of course, the best way to look at reality is to use the super rapid scan GOES visible. Here it is at 19Z:

GOESrapidvisOT19ZMay14We also have the OT product on this image. I tried to draw a circle around the OTs of interest with an annotation tool, but with 1-min temporal resolution, I wasn’t able to save my annotated image fast enough. (I tried 3 times with no success). I was surprised that the OTs were only showing up in the convective line from northeast MS to southeast TN. I thought we might see some in the cool-looking bubbly cloud structures in southeast AL as well. (Those clouds had produced FFWs in the area).

The simulated IR imagery below is also from 19Z. The model doesn’t show the area of overshooting tops that we were seeing in reality in northeast MS and southeast TN. However, it picked up very well on the larger, older convective shield in southeastern AL.

SimulatedSat19ZMay14
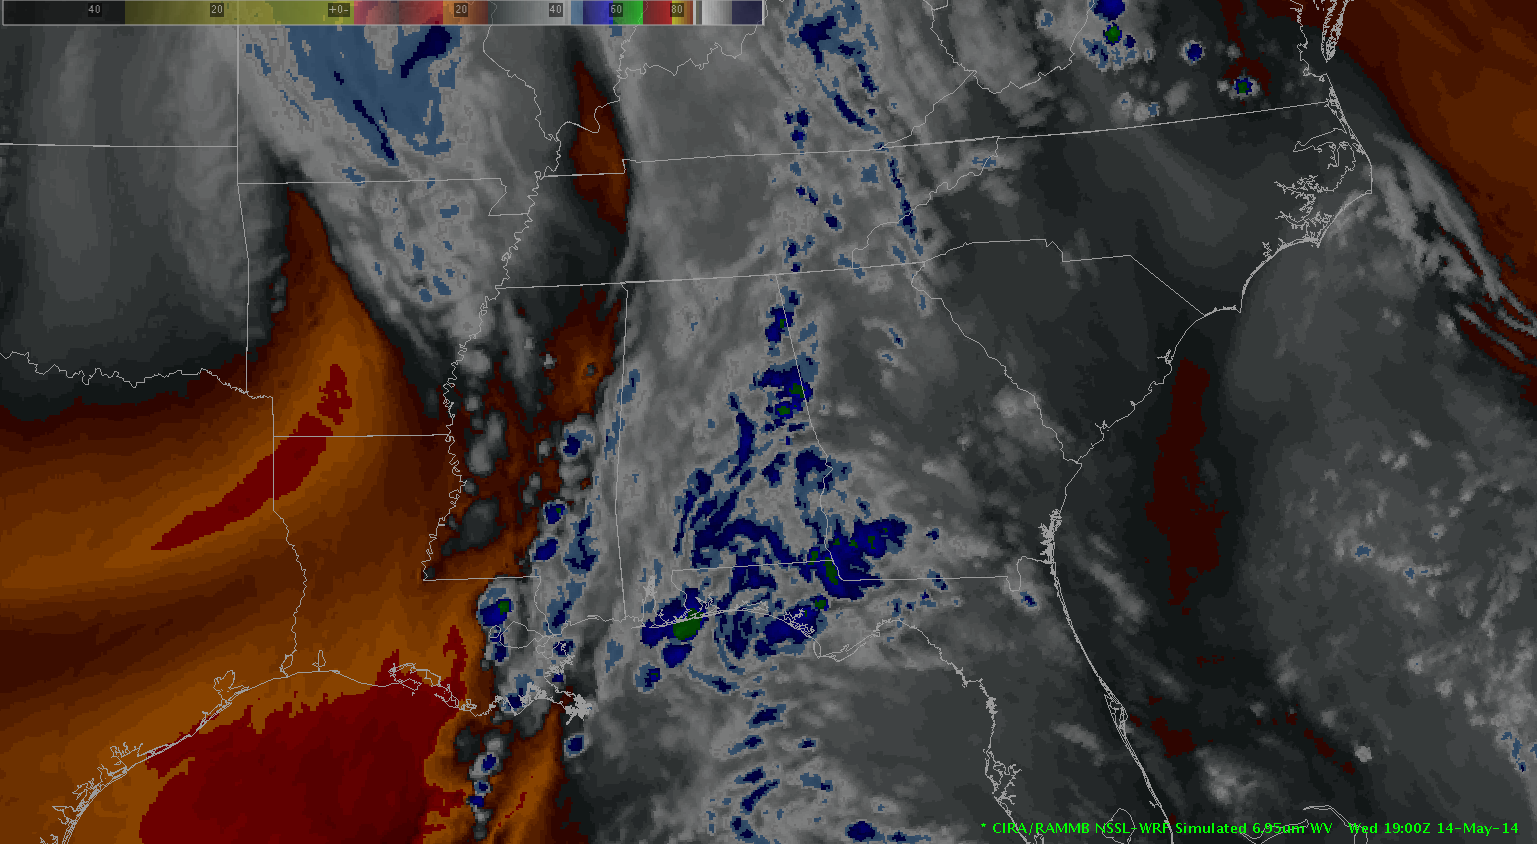
The simulated WV imagery also appears to have missed out on this convection firing at 19Z in that same corridor. It’s also worth noting that further south in Mississippi, the convection appears to be overdone. But this area of convection matches up with an area that was under a FFW due to a high-precip event earlier in the day. SimulatedVW19ZMay14

This case gives the appearance that the NSSL-WRF is doing a better job of simulating cloud cover in areas that have already experienced cloud cover and convection, and is not doing as well in areas where convection has not yet developed at the model’s run time. However, the overall spatial coverage of the cloud cover simulation is fairly accurate, and I believe it would be very useful, especially in the cold weather season, when convection is not so much of an issue.
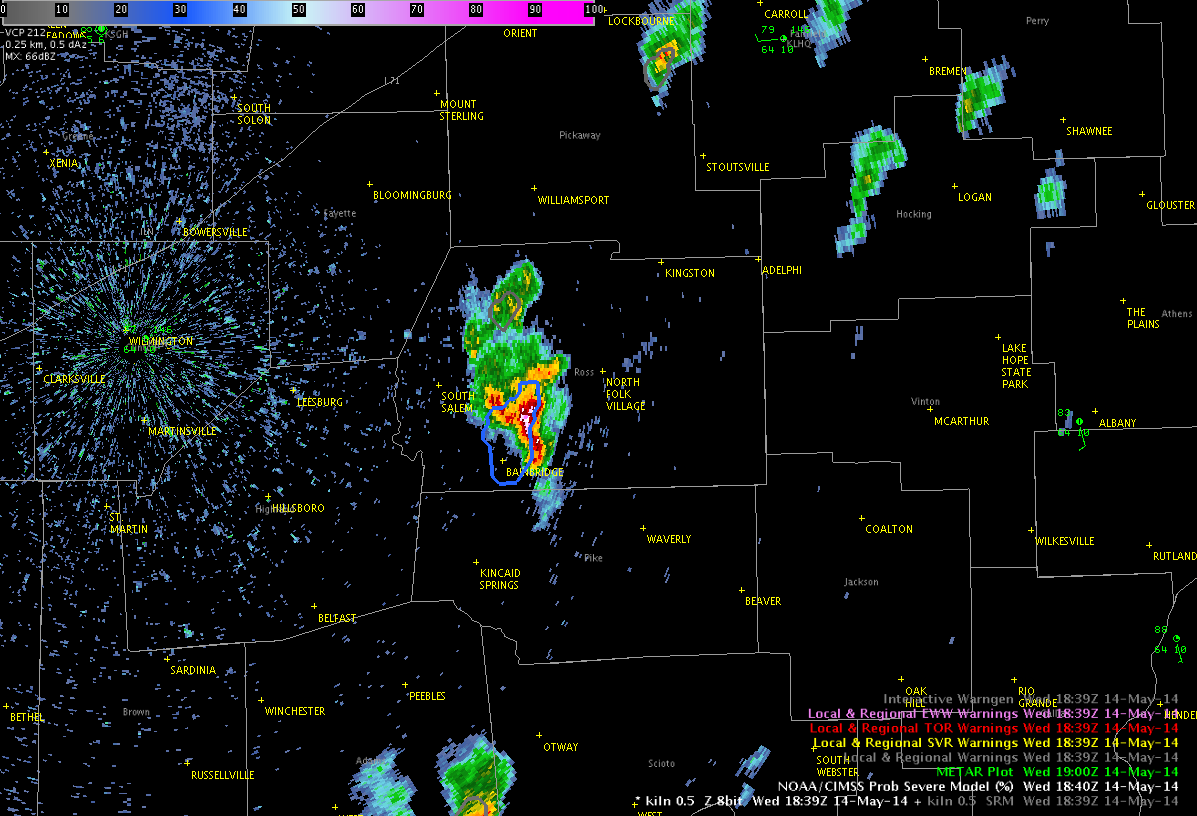
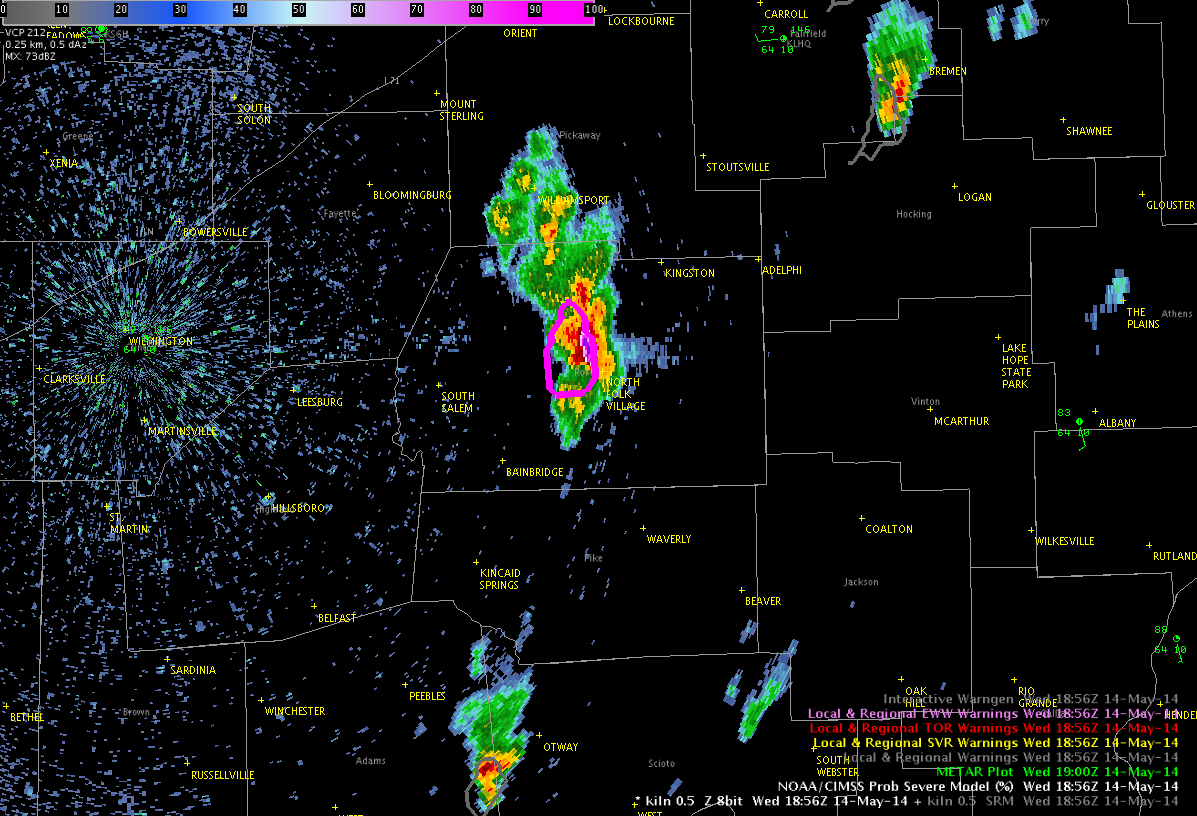
 

Tags: None

Tracking Tool Useful for Seeing Reflectivity/SRM Trends


The image below depicted how the Tracking Meteogram Tool can be valuable showing storm trends over a 2 hour period across Ohio.  You can see how the storm rapidly developed with increasing reflectivity 1800 to 1830 UTC, peaking around 19 UTC, then weakening slowly thereafter.  The tool could be especially useful for depicting SRM/low level rotation progression as well for potentially tornadic storms (in this case, the tornado potential was very low).2005UTC051414TrackingToolMichael Scotten

Tags: None

Tracking Tool Idea

In using the tracking tool, I could see it being quite useful operationally if some things were added.  I would really like to be able to put in a freezing level height (or one derived from a model) and be able to track reflectivity above that level.  This would be a good way to monitor hail cores, better than the current method of just tracking a storm at a particular slice.

-Deitsch

Tags: None

CIMSS Prob Severe Product Increases Warning Confidence in South Central OH

CIMSS Prob Severe Product did a great job illustrating a developing severe storm over South Central Ohio.  The SVR PROB increased from 32% at 1840 UTC, 94% at 1856 UTC, then decreased to 69% at 1920 UTC.  The MESH increased from 0.64 in. at 1840 UTC to 1.78 in. at 1856 UTC, then decreased to 0.95 in. at 1920 UTC.  Normal Vertical Growth Rate rose from 0.87%/min at 1840 UTC to 1.00%/min at 1856 and 1920 UTC.  The Glaciation Rate went from 0.02/min at 1840 UTC, 0.03/min at 1856 UTC, to 0.03/min at 1920 UTC.

The MUCAPE was around 1500 J/kg and ENShear ranged between 38 and 43 kt. The change in colors from blue to red and expansion in width of the outlined area depicting the reflectivity core provides warning forecasters valuable information for making warning decisions.  A Severe Thunderstorm Warning was issued for this storm in the HWT.

1840UTC051414CIMSSProbSevere 1856UTC051414CIMSSProbSevere 1920UTC051414CIMSSProbSevereMichael Scotten

Tags: None

EWP Status for 14 May 2014: 12:30-8:30 pm Shift

The threat for severe weather looks to be a bit higher today across parts of the Ohio Valley as the same storm system continues to propagate eastward. We have two forecasters operating in the Wilmington, OH CWA, while the other two are operating in the Nashville CWA. We hope that the group in the Nashville CWA will be able to utilize PGLM total lightning  and the Lightning Jump Algorithm from the Huntsville Lightning Mapping Array.

Once again, the outlook from the EFP was helpful in determining where the EWP should operate.

wed_efp_outlookUpdate: the group in Nashville has moved to the Pittsburgh CWA as the severe weather threat and even lightning activity has been very marginal in the area. It looks like Pittsburgh could become quite active in the coming hours.

– Bill Line, SPC/HWT Satellite Liaison and Week 2 EWP coordinator

Tags: None

Daily Summary: Week 2, Day 2

Today, operations began in the Detroit and Cleveland CWA’s. After activity moved out of the Detroit CWA, that group moved to Wilmington. Forecasters were able to take advantage of most of the products minus lightning and OUN WRF.

Tomorrow, we will start activities at 12:30 in the Dev Lab for the daily debrief before moving to the HWT for the EFP briefing. Operations will likely take place somewhere in the Ohio Valley region as the trough continues its slow eastward progression.

– Bill Line, GOES-R SPC/HWT Satellite Liaison and Week 2 EWP Coordinator

Tags: None