An official website of the United States government
Here’s how you know
Official websites use .gov A
.gov website belongs to an official government
organization in the United States.
Secure .gov websites use HTTPS A
lock (
) or https:// means you’ve safely connected to
the .gov website. Share sensitive information only on official,
secure websites.
Another warning earlier was successfully made in the south end of the FDW area. The MESH and reflectivity values at the -20C isotherm were used once again, in addition to other standard all-tilts base data. The first image below is the 8.7 degree slice of the all-tilts base data, which showed a relatively high reflectivity ~55 dBZ, which was at about 38 kft AGL at this location.
Image 1. KGRK 8.7 degree slice at approx 2333 UTC 21 May 2013.
The next image shows a >1 inch MESH value north of the town of Calvert in Robertson County and corresponding high reflectivity values ~57 dBZ in the same location at 2338 UTC. Earlier reports indicated severe hail was common near these thresholds, so the decision to warn was made. In the first image, notice the MESH (lower right) and the high dBZ at -20C (lower left).
Image 2. 2338 UTC MRMS imagery: upper left – Merged reflectivity composite, upper right – 50 dBZ echo top, lower right – MESH, lower left – reflectivity at -20C Isothermal level.
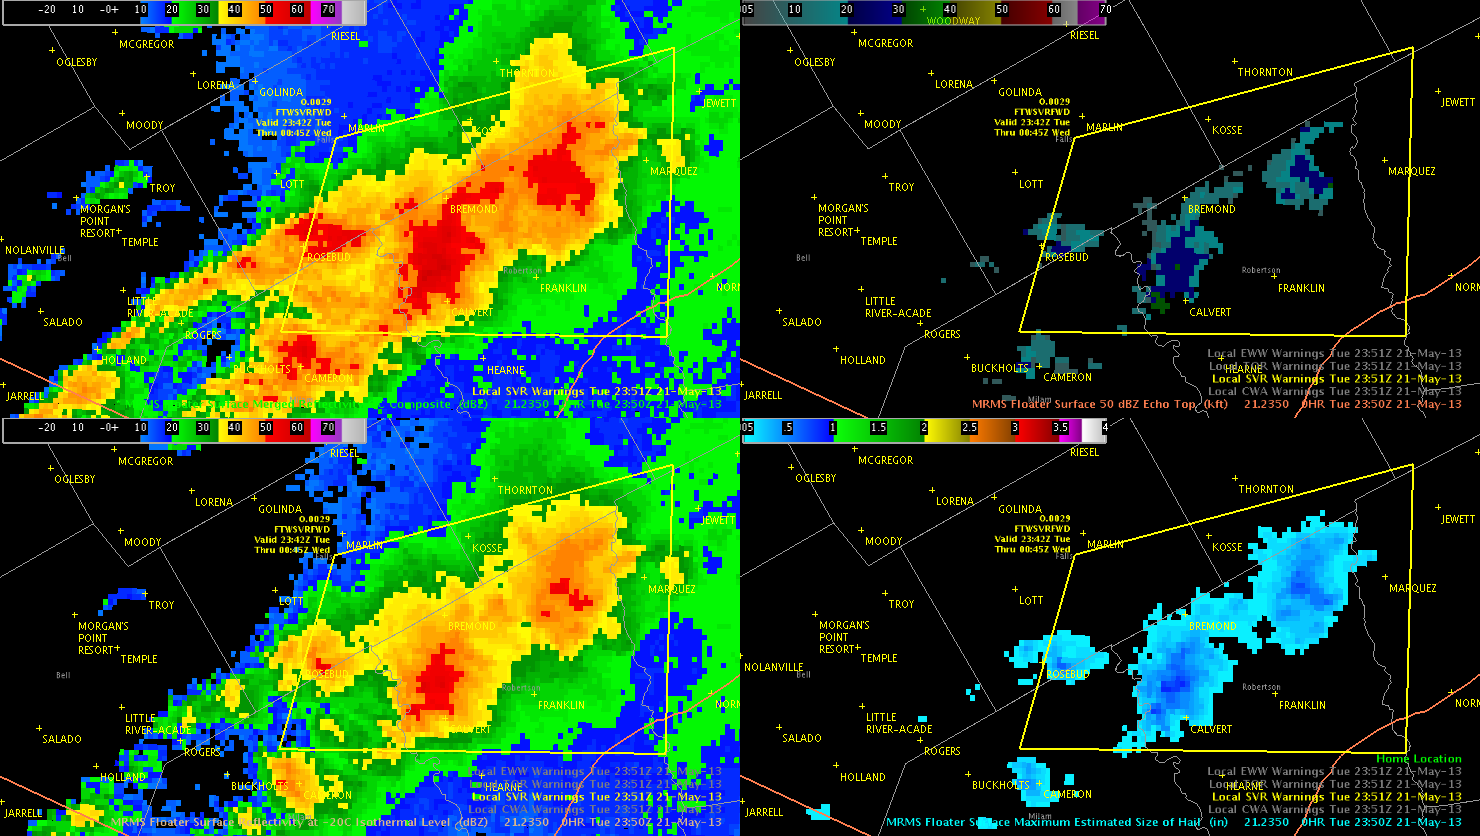
In the next image, the eventual warning box can be seen. This warning was issued shortly after observing the earlier data. Notice that the box was drawn trying to incorporate the areas with reflectivity at the -20C level greater than 55 dBZ. However, notice that the MESH values had decreased a little by the time this image was taken at 2351 UTC.
Image 3. 2351 UTC MRMS imagery: upper left – Merged reflectivity composite, upper right – 50 dBZ echo top, lower right – MESH, lower left – reflectivity at -20C Isothermal level.
This storm did eventually produce severe hail with the a report of 1.75 inch hail in the southeast corner of the warning box at 0041 UTC.
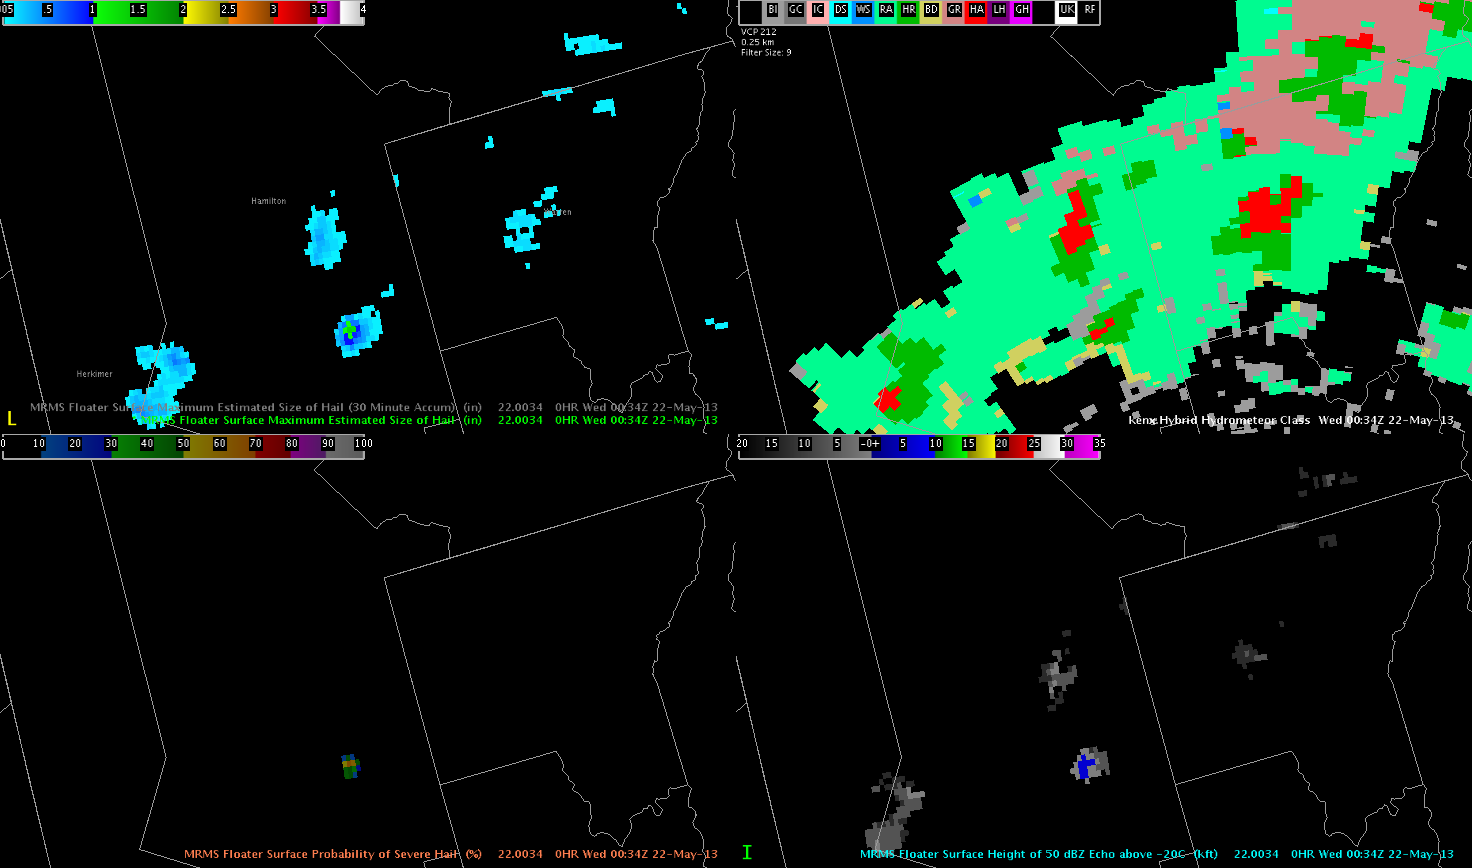
Another example of verification comparing the MESH vs HSDA. There was a report of 1 inch hail in Berkshire County around 0050z. The MESH included 1 inch hail but the HSDA did not indicate large hail, but at least indicated hail.
Just a note that MESH was indicating 1 inch hail consistently for a storm despite the HSDA indicating < 1 inch hail. Verification was severe hail for the one storm in Hamilton County. This storm actually produced ping pong ball sized hail.
Traditional radar analysis indicates little potential for severe hail in the NW portion of BGMs area. This is supported by MRMS data as there is a lack of depth in the 50 dBZ core above the 0C isotherm, and MESH shows sub-severe hail.
The NE TX activity was mostly a “wind bag”, with very little hail or tornado threat any more. So we have opted to complete our shift up in the Empire State. Our new CWAs: Albany, Binghamton.
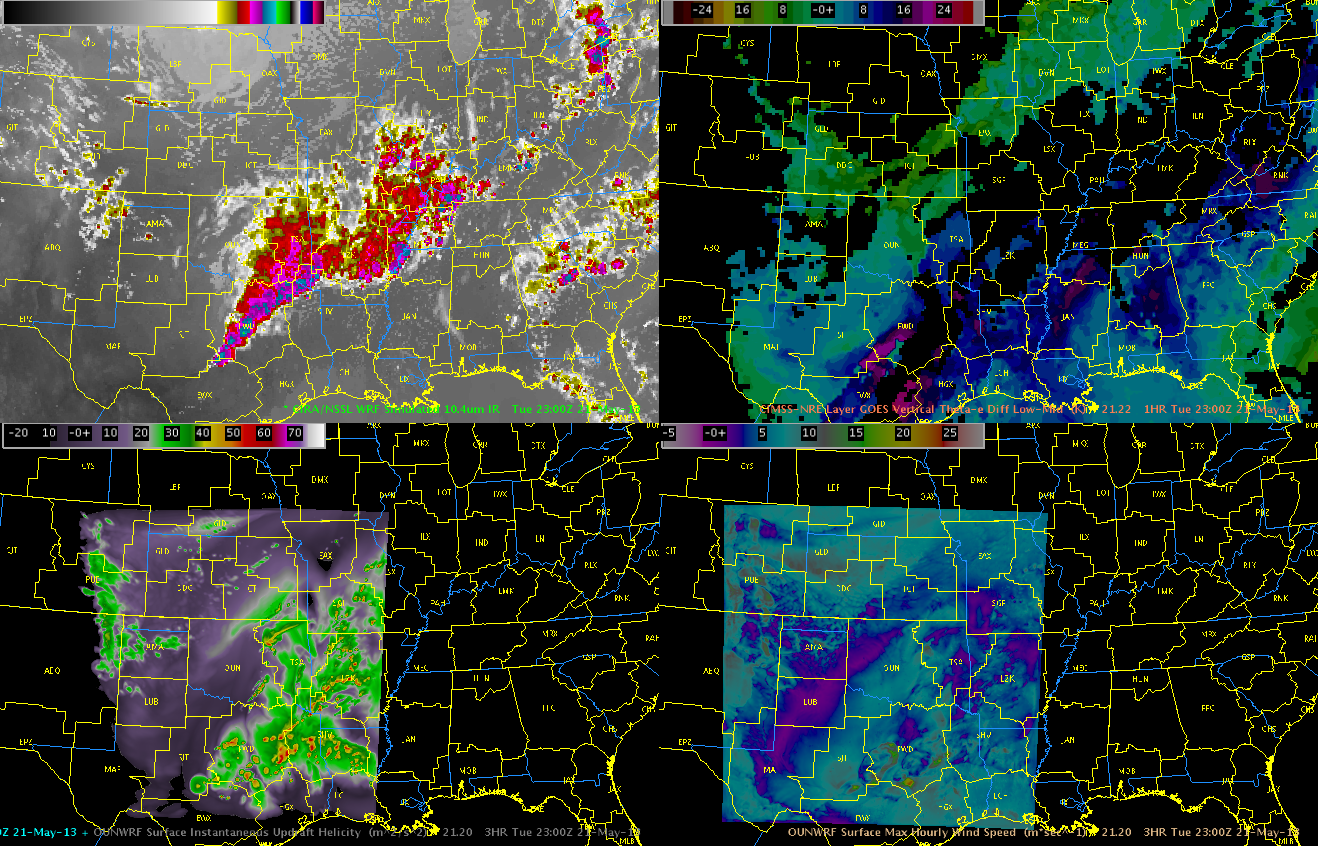
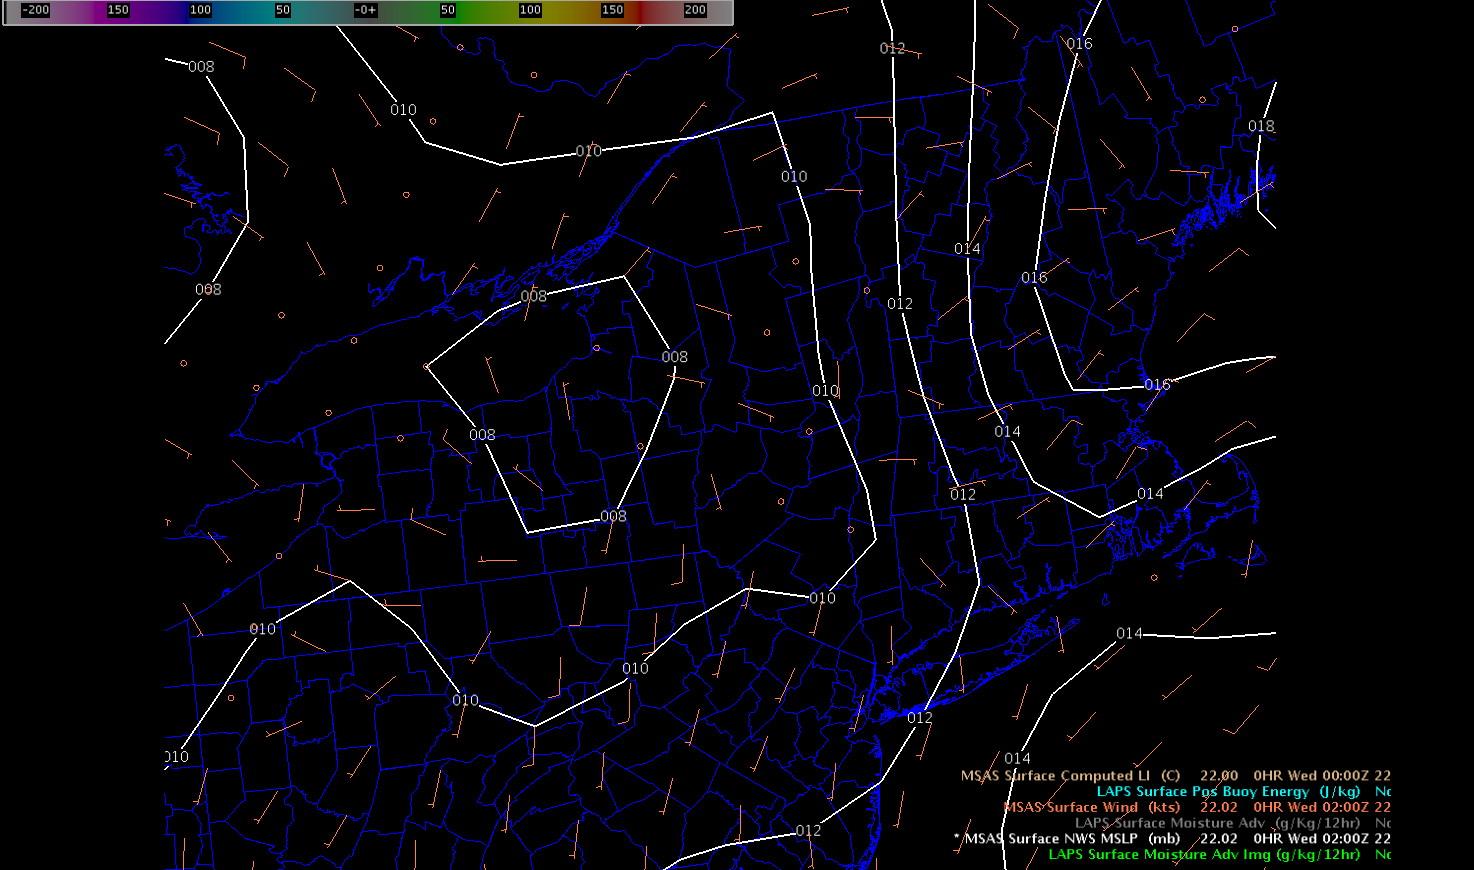
This nearcast shows a very unstable environment through the night, which should sustain the convective bow as it tracks across Louisiana. The instability and environment actually seems to improve based on this Nearcast model. Will see if this verifies.
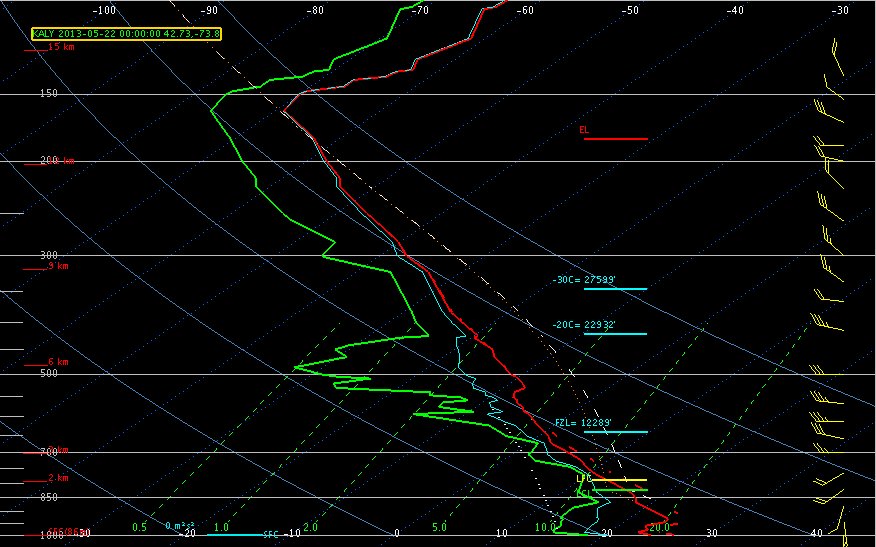
The 00Z ALY sounding did indicate SBCAPE on the order of 1007 J/KG, but CINH was already increasing to around 202 J/KG, so it is likely that most storms will be elevated in nature above a low level inversion and rooted from 850mb on up. Moderate westerly wind shear profiles 25-35 kts are combining with MUCAPE values near 1800 J/KG which enough for storm clusters to continue in advance of a approaching shortwave. Main threat should be large hail, though localized downbursts are possible with any storms that can get rooted more into the boundary layer.
The probability of severe hail and HDCA algorithms all underestimated hail size quite a bit when ping pong (1.5″ diameter) hail fell in Hamilton Co NY. The MESH was the only parameter that recorded near 1.5″ diameter half potential.
About 20 mins later, another ping pong hail report came in from Hamilton Co and the MESH again outshined the HDSA algorithm which only showed only regular hail(HA).
Storms should maintain for the next several hours, before waning with boundary layer cooling continue to increase and instability aloft weakening somewhat.
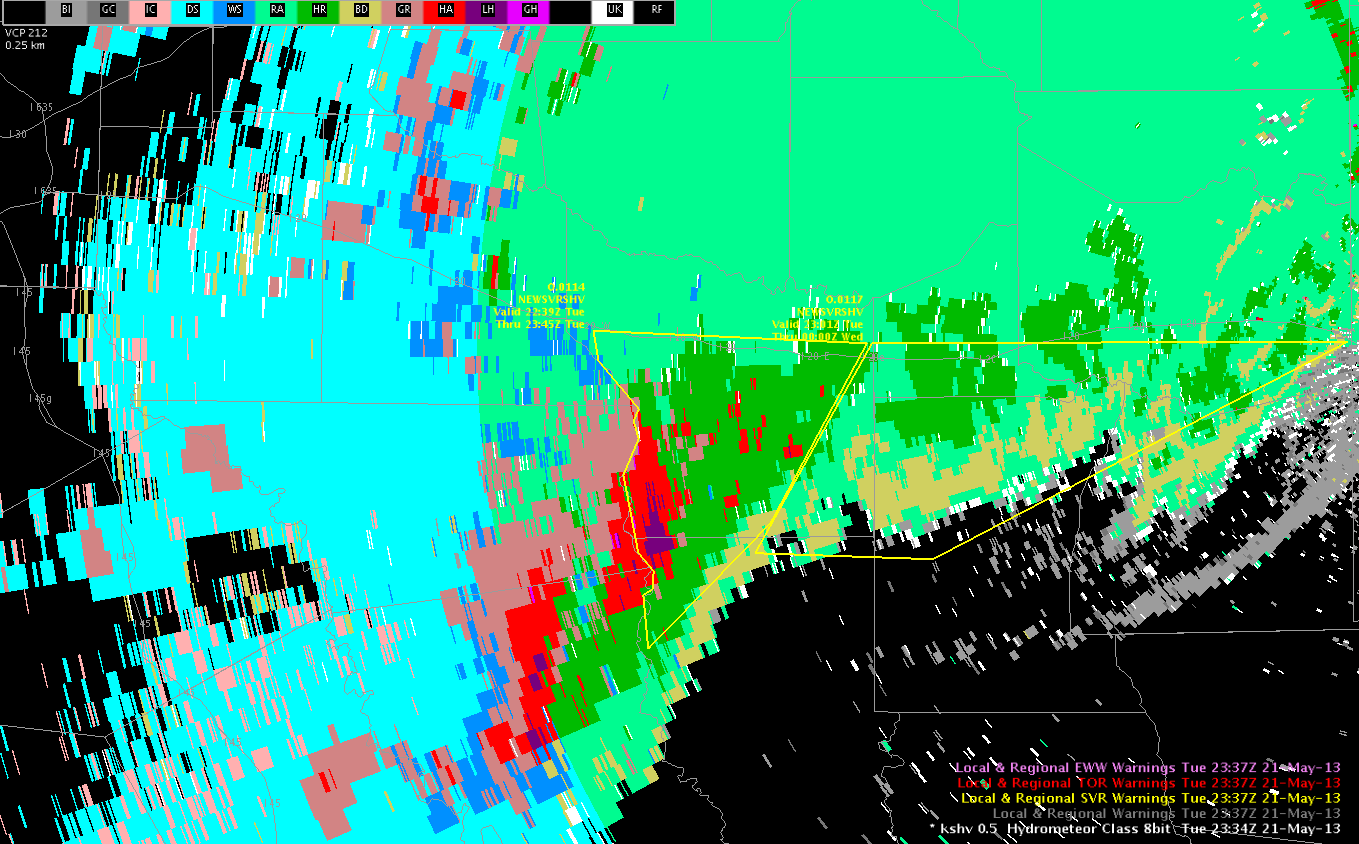
Large hail signature on Smith/Cherokee county line added confidence in reissuing warnings for Smith and Cherokee counties as new storms approach the area from DFW CWA, at the edge of our radar coverage.
MESH product has had some correlation with wind reports as well as hail reports in determining warning locations in the western portion of the Shreveport CWA.
This afternoon, my colleague and I on the “warning desk” for the FWD CWA got to use some of the MRMS data to diagnose the potential for severe hail. To start, I will say that the products helped with situational awareness, and for efficient determination of what cells needed the most focus, when a long line of cells extended SW to NE across the CWA. Quickly, our attention became focused on a cell that was about to push into southern portions of the CWA in the Salado-Killeen-Ft Hood area. In this first image valid at 2030 UTC notice the cell was producing >1.0 inch hail per the MRMS MESH product (lower right). MRMS Reflectivity at -20C was ~55dBZ, also lending support for the presence of severe hail.
Image 1. MRMS products valid 2030 UTC. Upper left – Merged Reflectivity QC Composite (dBZ), upper right – 50 dBZ Echo Top (kft), lower right – Maximum Estimated Size of Hail (in), lower left – Reflectivity at -20C Isotherm Level.
This storm was considered to be too far outside the CWA boundary at this point and was moving slowly enough, that a warning was not issued at this time. However, it caught our attention as the process was made more efficient by the MRMS suite of products. The next image valid at 2042 UTC indicated that the storm had undergone some temporary weakening, as MESH values fell below one inch (lower right). Nevertheless, reflectivity values at -20C remained >50 dBZ.
Figure 2. MRMS products valid at 2042 UTC. Upper left – Merged Reflectivity QC Composite (dBZ), upper right – 50 dBZ Echo Top (kft), lower right – Maximum Estimated Size of Hail (in), lower left – Reflectivity at -20C Isotherm Level.
Next, at 2050 UTC, MRMS products indicated that the storm was undergoing some temporary strengthening once again. Given the cyclic nature of this storm and the reflectivity signature noted in the reflectivity composite, the first warning for the FDW CWA was issued at 2053 UTC. In this warning, we included the potential for quarter size hail, which was near the highest suggested by the MESH data and other techniques such as Donovan-Jungbluth.
Image 3. MRMS products valid 2053 UTC. Upper left – Merged Reflectivity QC Composite (dBZ), upper right – 50 dBZ Echo Top (kft), lower right – Maximum Estimated Size of Hail (in), lower left – Reflectivity at -20C Isotherm Level.
We got our first report of severe (quarter size) hail at approx. 2120 UTC. The next image is the MRMS products valid at 2118 UTC. Notice at this time that the storm had strengthened and MESH values (lower right) were near 1.5 inches.
Figure 4. MRMS products valid 2118 UTC. Upper left – Merged Reflectivity QC Composite (dBZ), upper right – 50 dBZ Echo Top (kft), lower right – Maximum Estimated Size of Hail (in), lower left – Reflectivity at -20C Isotherm Level.
A little later, the warning forecaster had to make a decision about warning continuation. The MESH showed that the secondary storm that had developed on the western flank of the initial storm had larger hail sizes. Given other factors, when looking at all-tilts and taking into account the Donovan-Jungbluth technique and corroborating reports, another warning was issued. This one however included the quickly-developing storm to the west (warning not shown).
Figure 5. MRMS products valid 2136 UTC. Upper left – Merged Reflectivity QC Composite (dBZ), upper right – 50 dBZ Echo Top (kft), lower right – Maximum Estimated Size of Hail (in), lower left – Reflectivity at -20C Isotherm Level.
So, why is this imagery potentially useful? Well, the 2-minute temporal resolution is advantageous, potentially buying lead time. Also, it helps with the overall SA and the efficiency of the warning process. See the image below to see the extent of the convection ongoing at the time.
Image 6. KGRK 0.5 degree reflectivity image valid 2149 UTC.
With multiple deep cells in the area, products like the MESH, and -20 C Reflectivity can be very helpful for determining the cells on which to focus. This has the potential of making the warning process more efficient.
Another thing I would like to point out is the potential for radar failure. I worked the April 27th severe weather event in northern Alabama, where we lost our primary radar and a secondary radar. I was using neighboring radars which were equi-distant to the remaining convection late on that day. A MRMS suite of products would have been very beneficial to the alternative of having to look at data from three other radars. That’s one more thing I’d like to point out about these products.