


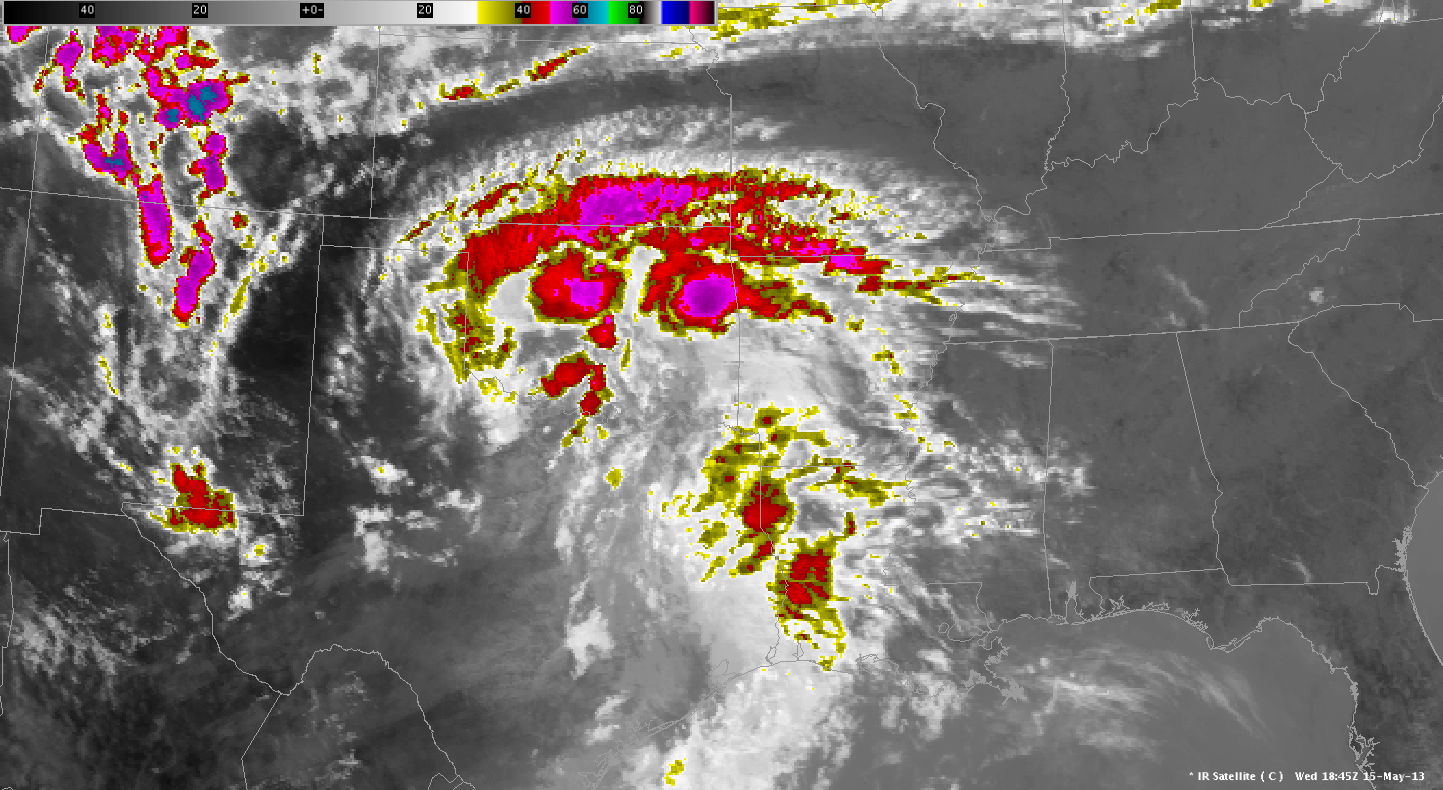
 The images at 19 and 20 UTC respectively depicted an area of drier air, most likely associated with a short wave on the back side of a mid/upper low over southwest Oklahoma. This wave seems to be enhancing cloud top cooling and convection generation over west Texas, near Lubbock. We will keep a close eye on this feature to see if this wave will allow for explosive convection 22-01UTC near a dryline from near Childress to San Angelo with very unstable (2000-3000 J/kg) air near and east of the dryline. Michael Scotten
Month: May 2013
Why are storms struggling early? LAPS to the rescue again…
The cells that have formed in the western portion of the FWD CWA have so far been fairly pedestrian. Initially, this was puzzling, as there appeared to be several favorable factors for more vigorous activity. My partner here pulled up my favorite product, the LAPS CAPE analysis, and he may have found the answer. The storms are forming along an instability gradient (the blue/green interface towards the bottom of the image), and moving eastward into an area that was worked over by morning convection (lighter blue colors). So, they waddle along and weaken in the more hostile environment. Mystery solved, at least partially! Still expecting more exciting weather soon as a watch just went up.
CL

Mesoscale Discussion 21 UTC 05/15/13 Central/North Texas and Southern Oklahoma
Thunderstorm coverage is expected to increase 21-02z across north and central Texas as daytime heating should erode capping. Think isolated to scattered supercells will develop near or just east of the dryline where best instability (2000-3000 J/kg) and increasing shear (0-6 km 30-55 kt). Very large hail would be the main hazard with supercells, thought damaging winds and perhaps a tornado or two may occur as well. Highest storm coverage will most likely be across western north Texas and Oklahoma where capping is weakest closer to the mid/upper low. The best chance for supercells with the biggest hail is expected over northwest Texas where best instability and shear are forecast. Across Oklahoma, weak capping and limited heating from ongoing convection are expected to limit the overall severe potential, though a stray damaging wind or hail report remain possible, mainly through 02z. With low LCLs and locally enhanced 0-1 km SRH values 150 to 200 m2/s2, short lived weak tornadoes are possible, mainly over central and eastern Oklahoma through 01z. Additional severe storms may develop farther south near or east of the dryline, across central and south Texas though stronger capping is expected to reduce the number of storms. The supercells may evolve into mini squall lines/MCS clusters 01-03z as they move southeast and are expected to slowly weaken. However, damaging wind and large hail may the main hazards with any MCS.
Slow moving low atop Oklahoma
An healthy looking low pressure area has moved towards SW OK with lots of convection already ongoing.
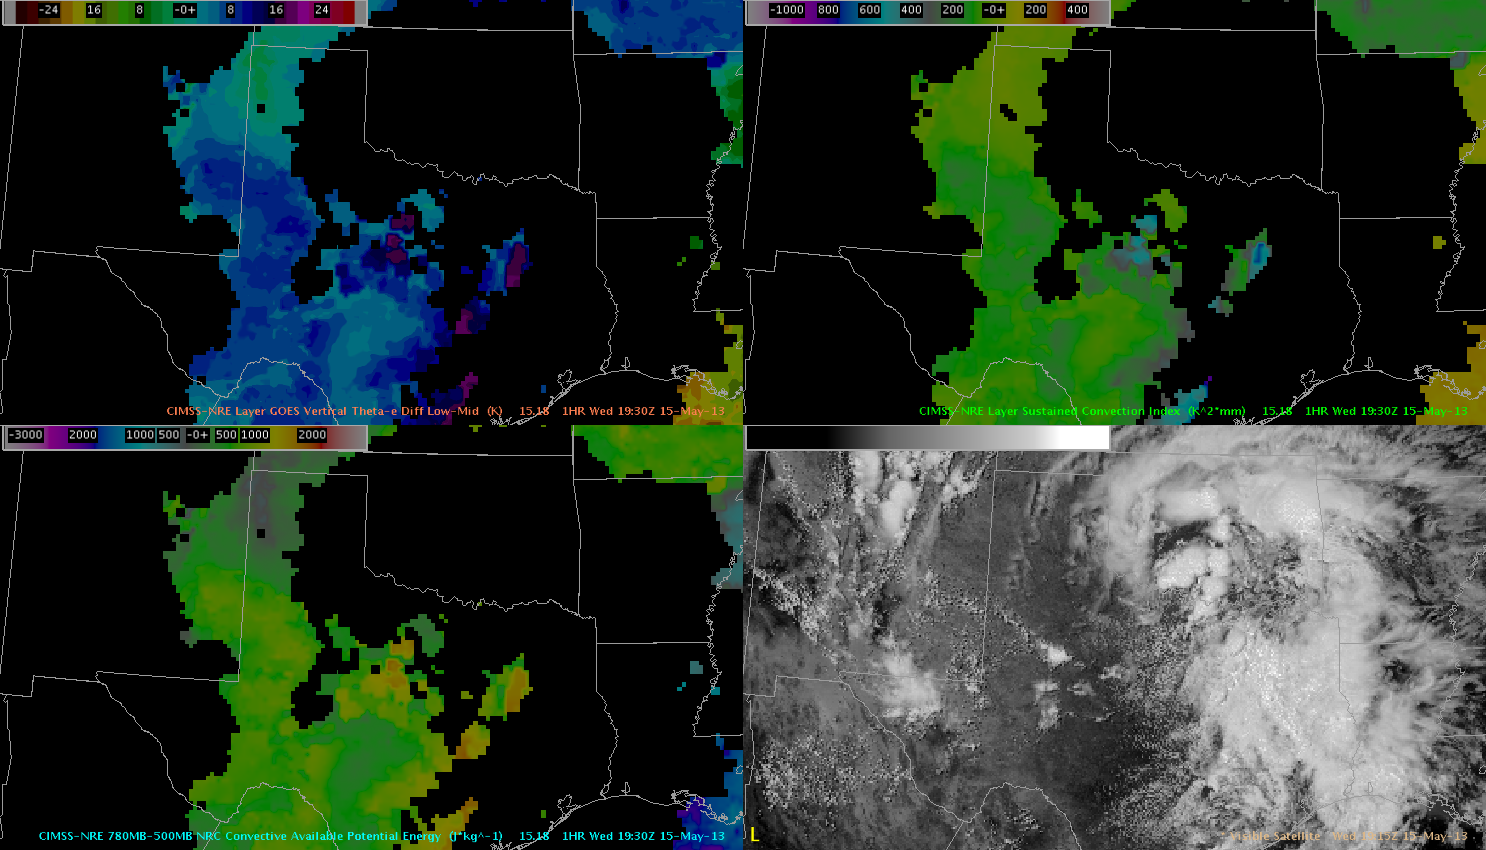 upper left: GOES Vertical Theta-e Diff low-mid, upper right: Sustained Convection Index, lower left: CAPE and lower right: VIS
The main swath of unstable air is visualized nicely with that product, showing a tongue of very unstable air expanding from the far W-Gulf coast towards S-Oklahoma. The ‘sustained convection index’ highlights that area, where strong and longer lived updrafts might evolve betimes (and given agitate Cu field development, it won’t take that long for that). NRE CAPE field has 1500 J/kg just south of OK and with ongoing diabatic heating, we expect a further increase during the following hours. So, using the NRE product the focus for strong/sustained convection clearly shifts in the Dallas/Fort Worth area and south.
Also using the theta-e diff low-mid product, conditions for at least isolated to scattered initiation towards the Lubbock area seems to be plausible, given westward expanding plume of unstable air and interaction with others mesoscale features at the surface. In fact, there currently evolves an east-west aligned theta-e tongue just south of Lubbock, which overlaps nicely with evolving showers and thunderstorms. Helge
14 May 2013: Day 2, Week 2, Summary
Our second day of operations was a little more interesting. We started off the day with two mesoscale desks: one over the western great lakes and another over south texas. A nowcast and warning desk also set up over the Midland, TX CWA to begin the day. As the day progressed we moved one of the forecasters off the great lakes mesoscale coverage to the san angelo CWA to monitor storms as the progressed into the CWA. The MAF team was able to issue some warnings on storms for severe hail with verification of few reports coming in a bit later via spotter network.
-Kristin Calhoun, Week 2 Coordinator
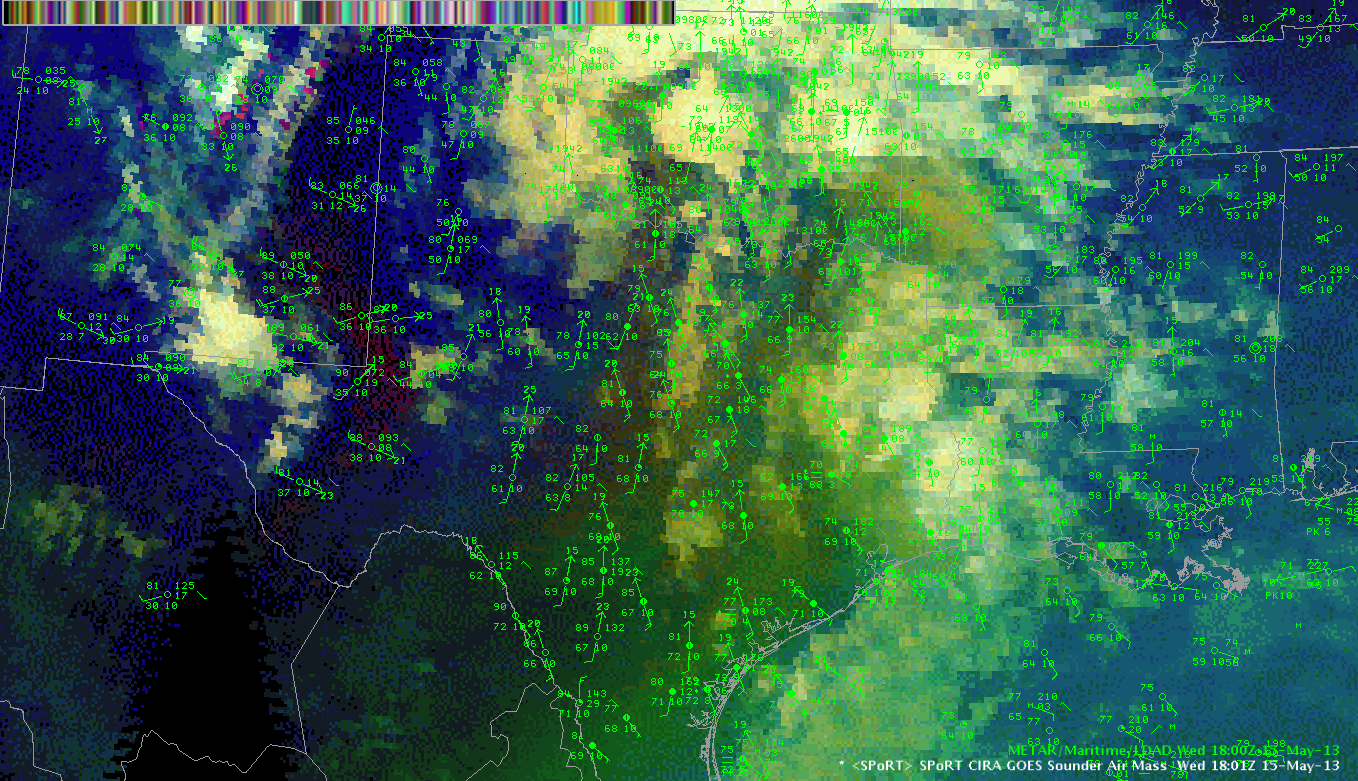
We are setting up in the Dallas/Fort Worth CWA today, and expect some busy weather in a few hours. So, I’ve been scanning the various products to get a general overview. The SPoRT GOES RGB product is good to get a general sense of the airmass structure. Decided to do a second post on it today to start off.
In the image below, the greenish yellow colors represent the more humid subtropical airmass, while the blue to red color is the drier, more continental airmass. You can see the approximate position of the dryline at the interface of these colors. Of course, the sounder is sampling the upper mid levels here (400-500mb) and doesn’t exactly correspond to the surface dryline…you can see this in the overlaid obs. Still, this is a product that can give you a quick idea of the general airmass setup.
CL
15May2013 EWP 1900Z Comparison of IR / WRF Sim IR
As part of the Nowcast / Warning desk for FWD, it’ll be interesting to watch initiation along the northern portions of the tightening dryline this afternoon.
When comparing the simulated IR with the actual IR at 19Z, it appears the simulated is underdoing cloud-cover on the backside of the upper low (across NW TX / W OK). It then initiates convection across NW TX around 21-23Z. The possibility exists that across the northern portion of this region, around the Red River or so, heating might be overdone on the model, resulting in initiation too early / too widespread. It will be interesting to see how initiation occurs along the dryline today.
Picca
19Z Actual IR
19Z Sim IR
23Z Sim IR
CTC Algorithm Struggles in Broad Regions of Ice Cloud
The CTC algorithm missed a developing storm that went on to become a robust storm and prompted an experimental severe thunderstorm warning. The storm in question is highlighted below within the red hatching at 2114Z when visually it was very apparent the storm was rapidly intensifying.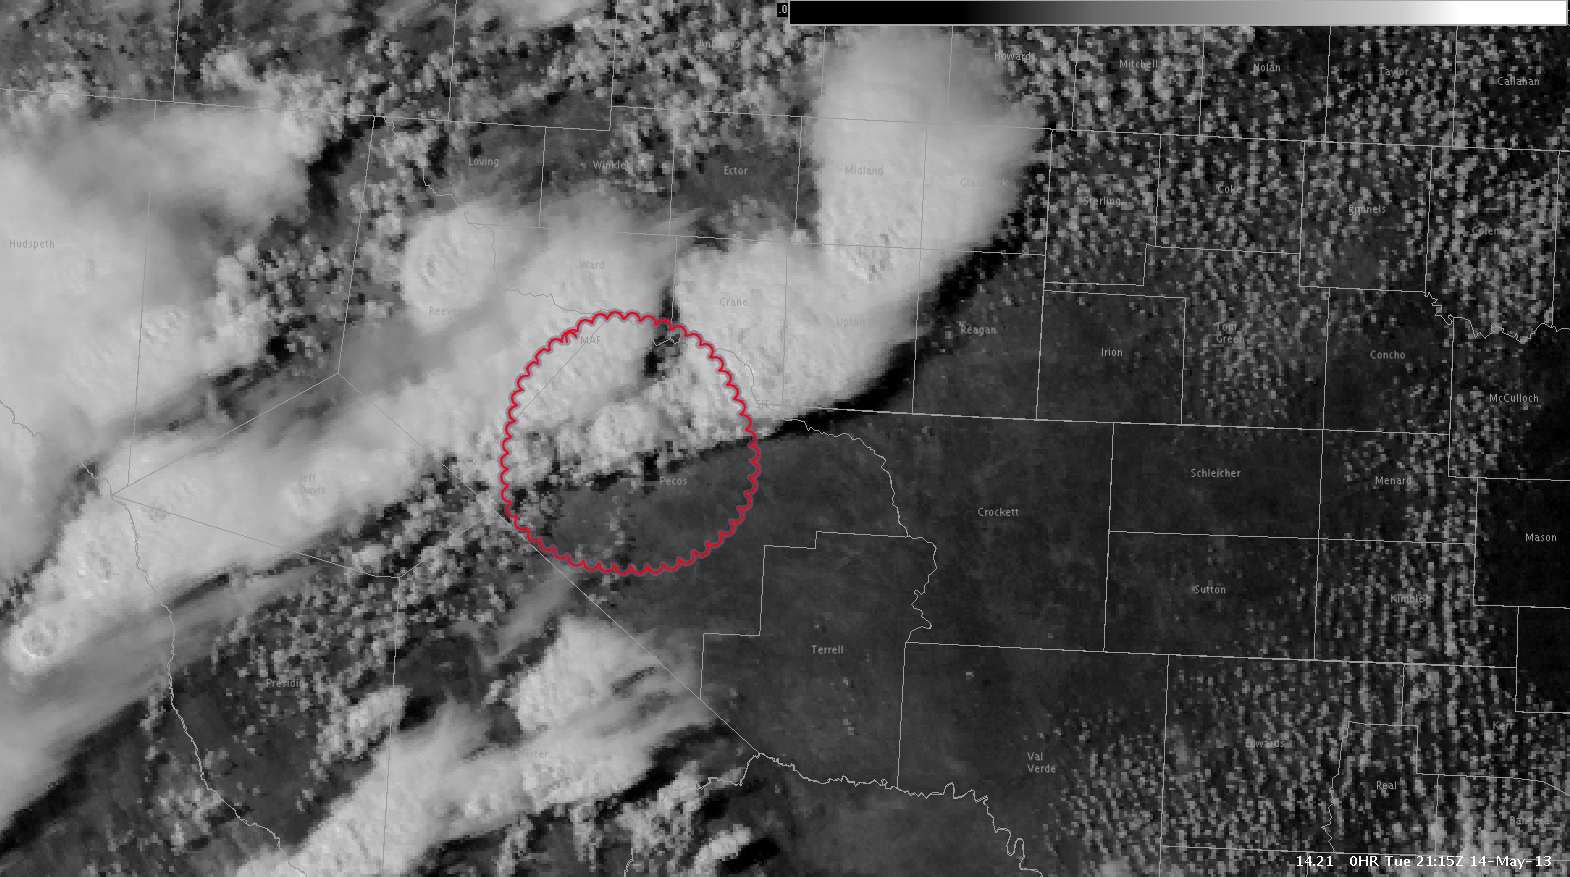
The algorithm “missed” this developing storm mainly due to the algorithm defining the cloud type in the vicinity of the developing storm as thick ice and cirrus at 2032Z and 2045Z. This storm was likely within the thick ice and cirrus definition…and therefore was included in the ice cloud exclusion zone and not given a CTC rate.

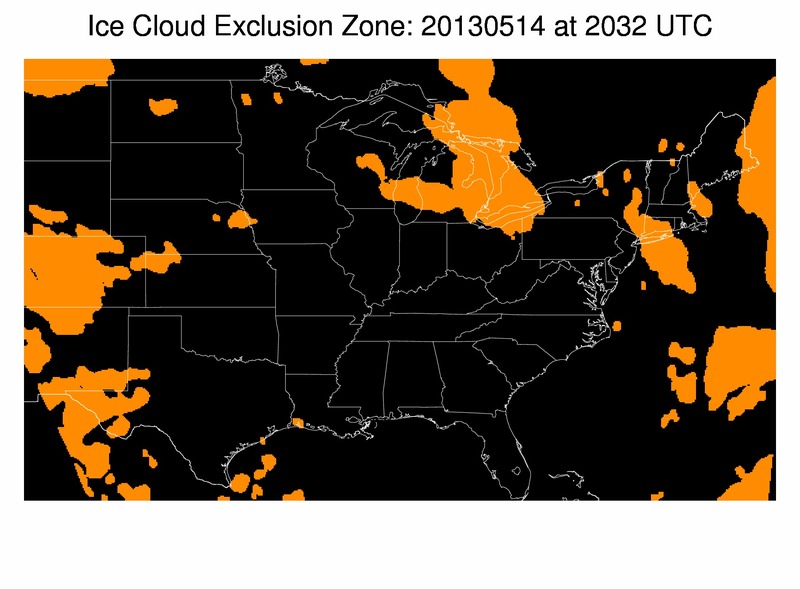

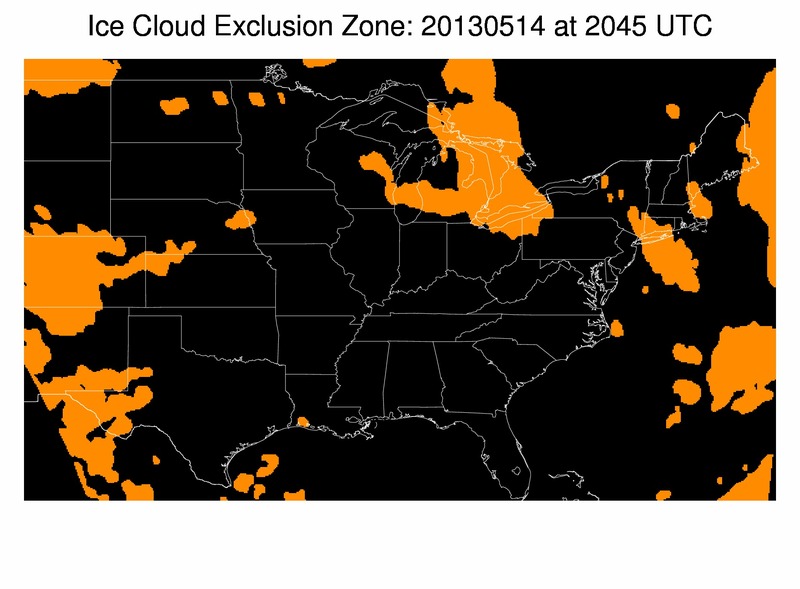
This example merely illustrates that not all developing storms will be captured by the algorithm even if visually it looks to be clearly intensifying. This is especially the case in a situation where multiple storms are in one area.
RJM
Tue May 14th, Mesoscale Analysis (Northern)
Two areas seem to be possible for convection near and west of the Great Lakes. The first is across northern Iowa as an outflow boundary and sfc trough are providing strong sfc convergence in an area of higher sfc dew points in the 50s. Limited instability and shear in this area would limit organization of storms. Main threat here would be dry/wet microbursts as hail/rain cores descend into deep dry layer below cloud base. Stronger shear is present in the second area of concern, ahead of northern stream shortwave trough in northeast Minnesota and Upper Peninsula of Michigan. CTC rates of -15C/15 min noted along a sfc front/convergence zone just north of the Canadian border at 1945 UTC and this area extends south into northern Minnesota.
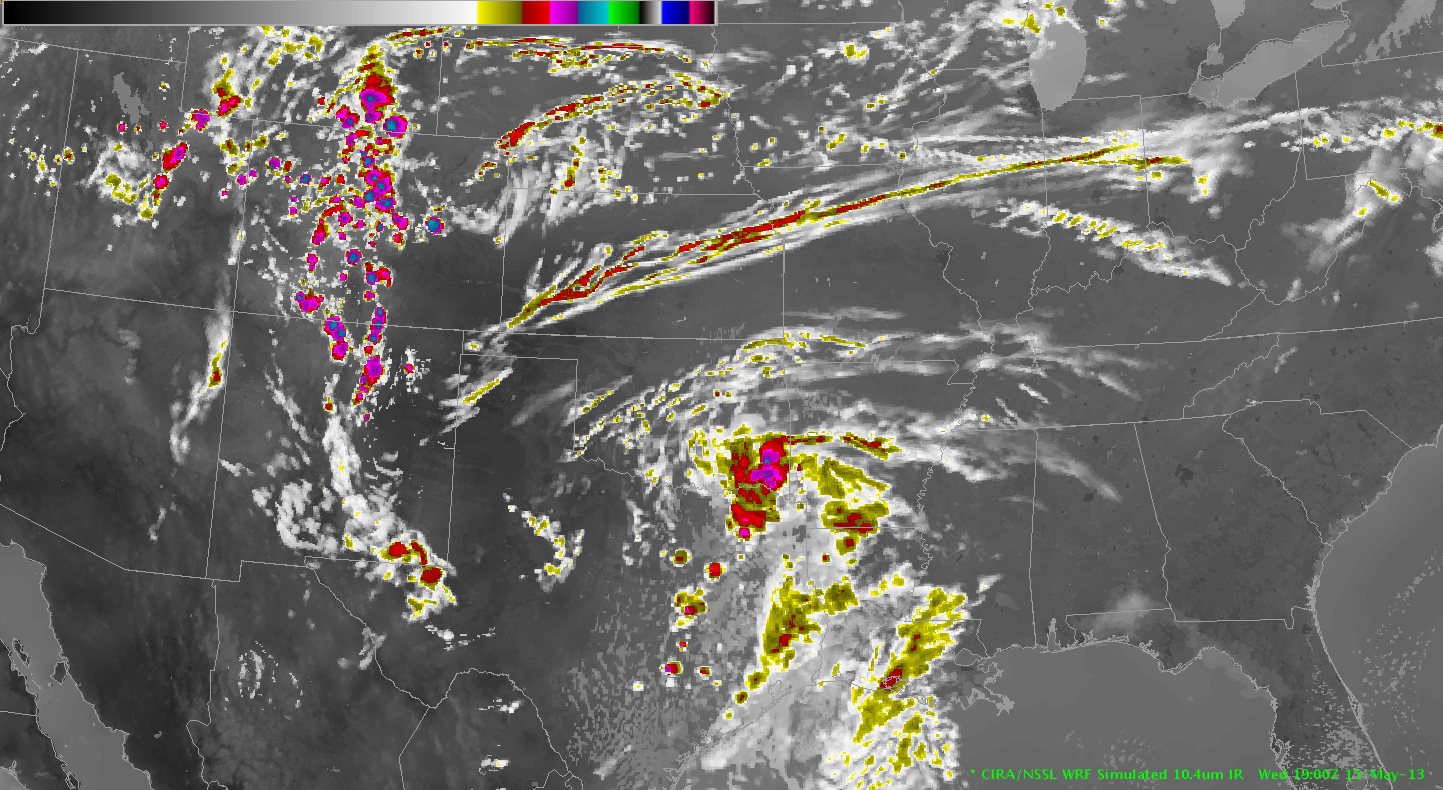
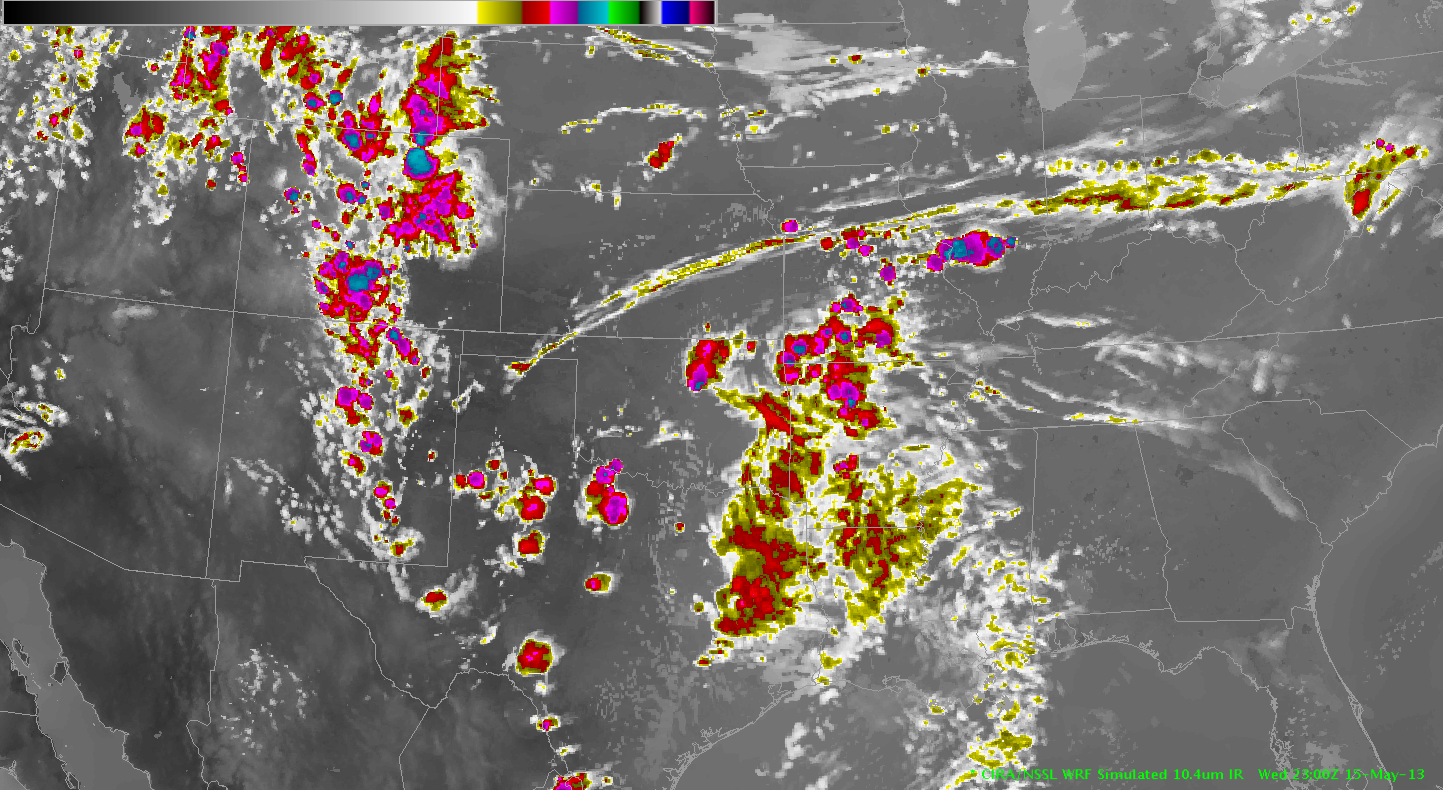
The CIRA Simulated IR satellite shows storms initiating in both of these areas by 01 UTC. (see image). This was the general area stroms did form although the simulation was about an hour or two slower than reality (see IR satellite image from 2345 UTC).


Top image is the CIRA/NSSL WRF simulation 10.4um IR for 01Z Wed MAY 14th, showing some convective initiation across the Upper Peninsula of Michigan and some bigger storms across northern Iowa and eastern Nebraska. Bottom image is the actual 2345 UTC IR satellite image.
As of 20 UTC, the GOES-R CI Sfc convective initiation shows the highest percentages (around 77%) in southern MN and western WI. By 21 UTC the highest percentages (up to 90%) were across Nebraska. CTC cooling rates were 5-15C/15minutes in these stronger updrafts, which were small and isolated, stretching from CO to WI. The line of higher convective initiation decreased as the storms initiated, then were followed by individual storm cloud-cooling tops identified by the CTC. See following images.

GOES-R Sfc convective initiation at 2015 UTC.

10km Radar Coded Message at 2119 UTC showing the line of showers and thunderstorms.

CIMSS Cloud top cooling – Instantaneous image at 2130 UTC. Max values around -15C/15 minutes, that spiked up to -40C/15 min by 22Z UTC from NE Iowa to SE Minnesota. Severe microburst winds hit Mason City, Iowa around 2150 UTC. The storm showed a CTC cooling rate of -25C/15 min at 2132 UTC. The algorithm gave a value of -70C/15 min for one storm, which was probably a misinterpretation caused by anvil blowoff from a previous updraft.
– Ostuno