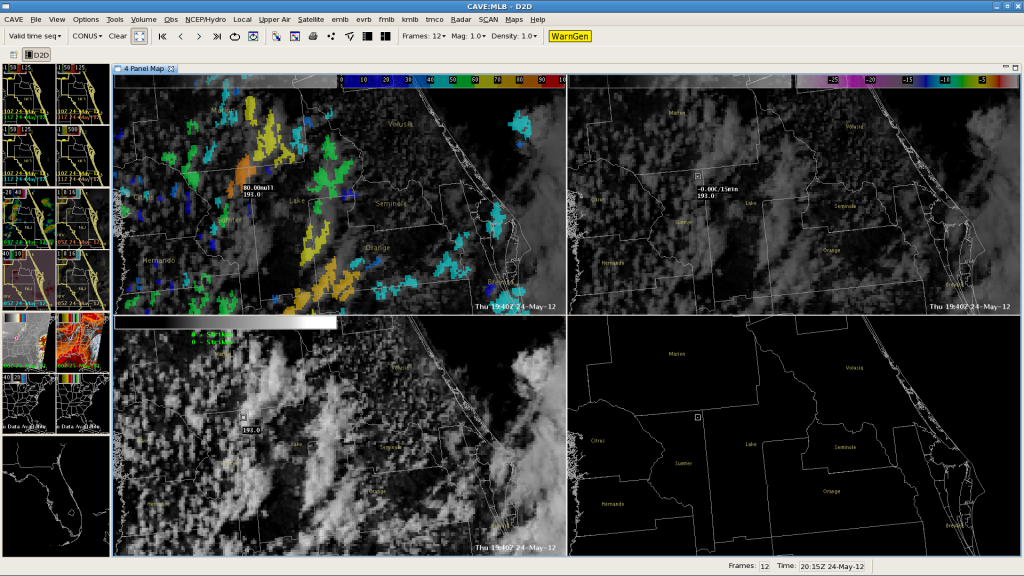
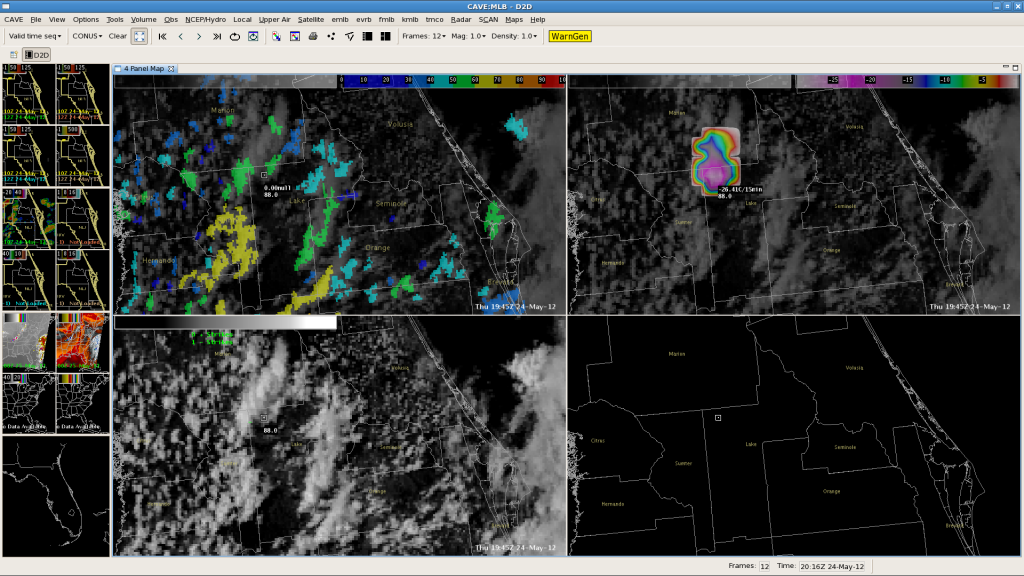
Here is an example of how UAH Convective Initiation (CI) and CIMSS Cloud Top Cooling (CTC) can be used to anticipate convective development. Here in the first image at 1940Z, let’s look at the CI product in the top left panel:

Focus on the Lake/Marion/Sumter County line. There is a maximum in CI there of 80, indicating likely convective development. If we look at the CTC in the same area on the next image (top right panel), we see a developing max CTC over -20C/15min, which is a strong indicator of a developing severe thunderstorm.

Although this did not ultimately become a severe thunderstorm, we did observe a few lightning strikes shortly after this time. This progression from strong CI signal to strong CTC can be a good indicator of a developing thunderstorm.–Gordon Strassberg for WFO MLB
