NMDA

It can be a bit hard to see from the color scale, but take a look at the bottom left screen. The NMDA is shown there. One thing that I have noticed about it is it was able to better track the Mesocylone compared with the normal one. However, I have not gotten to test this extensively yet.

Notice in the time-step below that the NMDA is the able to hold onto the mesocyclone when the normal one cannot.

South Beach

CPTI Usefulness

Here’s a look at some attempts to use the CPTI for storm carrying a theoretical tornado warning. I have a fair number of thoughts on the product. In terms of a primary application. I think it would be best suited to the first update/continuation on a tornado warning. Basically allowing you to chose what types of language to use…if the CPTI is picking up on a very high intensity circulation than you are going to want to ramp up the intensity of the wording within a warning. This could be used to communicate how dangerous a storm is. Especially since the damage associated with a 80mph circulation will be drastically different from a 170+ mph circulation.

Now for areas that I would improve/and or change. The CPTI might be better off using a category scale/range of values. Intuitively, I would expect probabilities to increase if the storm is more intense. I.E. if the circulation is 155mph then I might expect the 80mph CPTI to be close to say 80% while the 155 mph CPTI is something like 50%. If the tornado intensifies maybe the 80mph CPTI would increase to something like 95% while the 155 mph CPTI increases to a value such as 75%. Currently, there are a lot of very similar values as the image below shows 80, 95, 110, and 125 mph all have pretty much the same value within 3% of one another. I would want there to be a much larger variance in these values, so that I  could easily gauge , how intense the tornado is. I think CPTI has a  great potential, but I would change it so that it was more of an probability of exceedence  scale and could be used as a quick product to determine intensity wording in products.

South Beach


Contours-a-plenty in ProbSvr

ProbSevere double contours were plentiful at this time showing the utility that certain “big” days may need to be modified to increase the threshold for the second contour. This was the default 3%.  Only a couple of the circulations were worth investigating in reality.

— S Coulomb

Merged AzShear w/ non severe storm

The AzShear product showed a consistent, distinct circulation associated with the updraft core within a multi-cell cluster moving through the western part of SGF’s area. The velocity couplet was anticyclonic in nature.  The feature was stronger in the 3-6 km AGL layer than at the surface.

— S Coulomb

Az Shear – the goods and bads

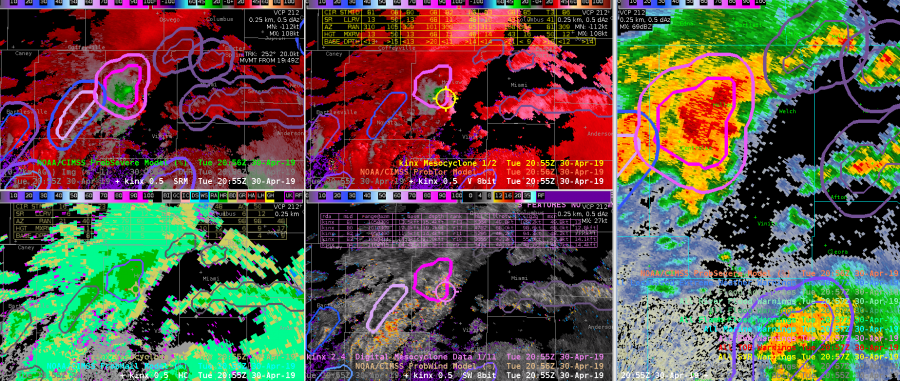
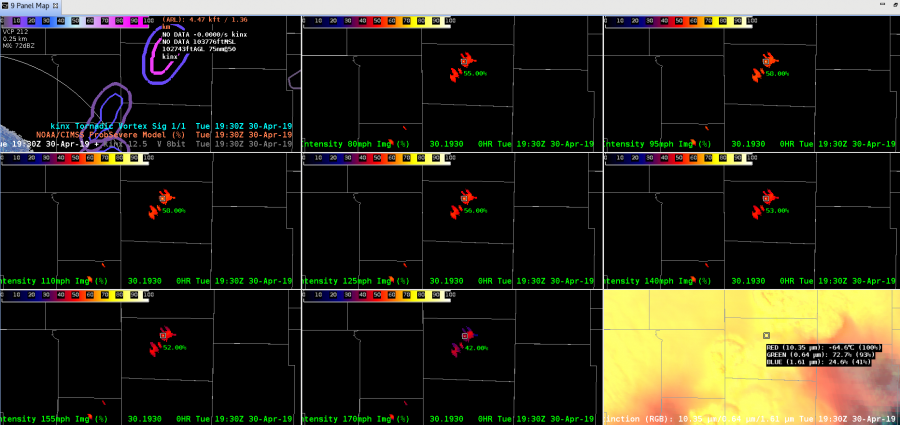
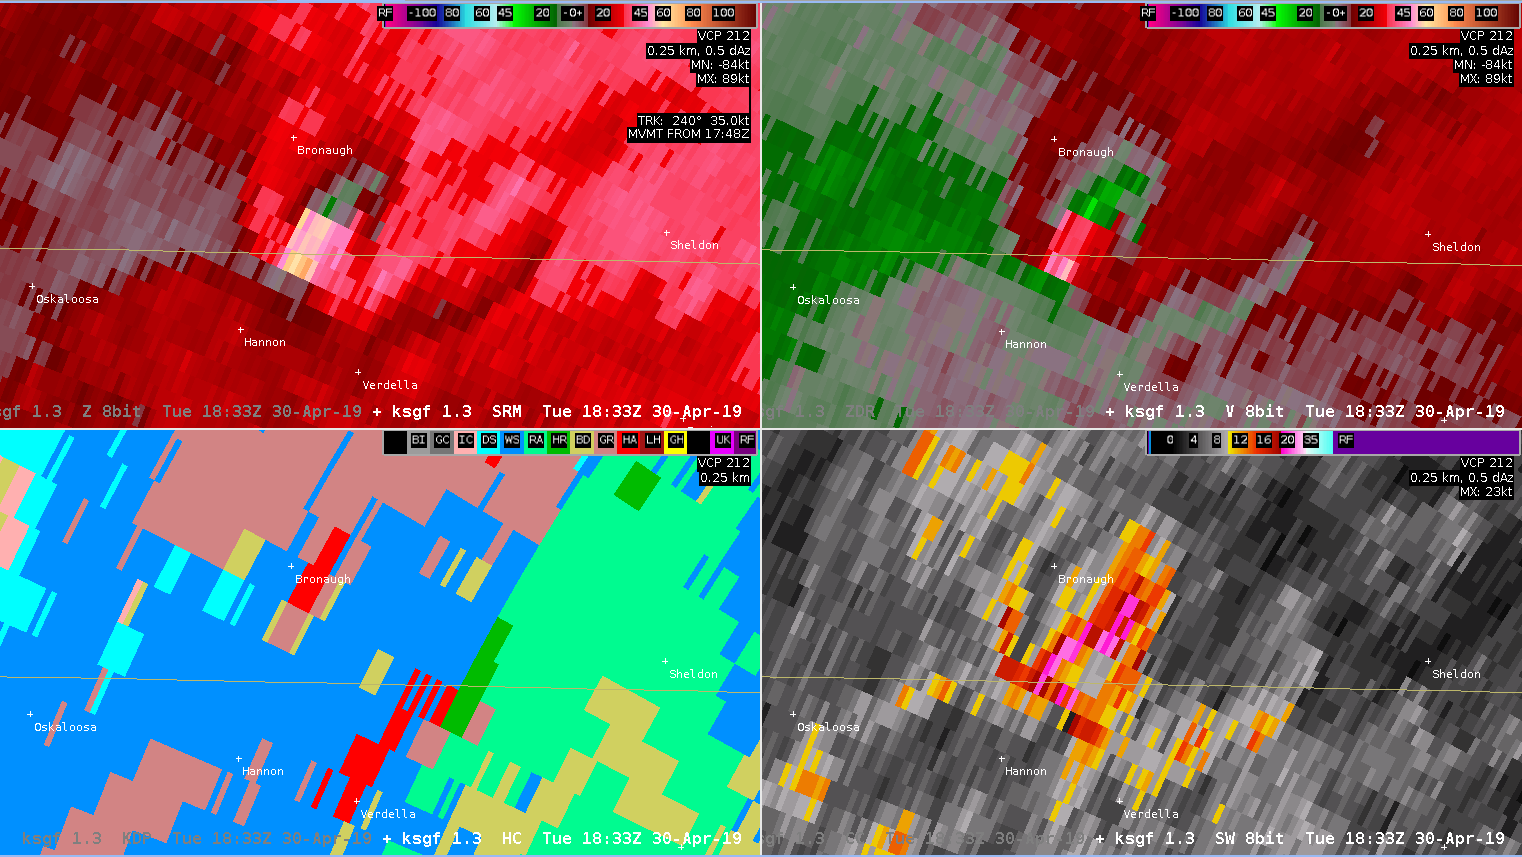
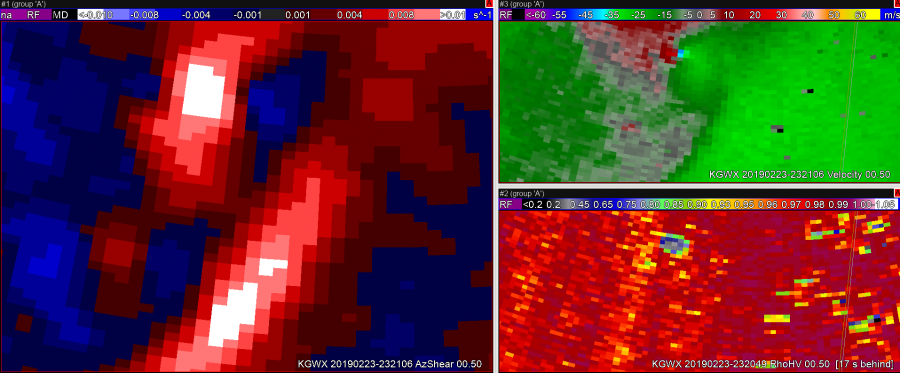
Photo above shows a double maximum in AzShear. One of these is clearly colocated with a TOR on ground via CC. However, velocity shows two very different situations, possible strong tornado on ground versus convergence along the RFD gust front. If you were just looking at the AzShear product, both of these areas would be cause for concern, when in fact the impacts are extremely different. Would be nice to be able to differentiate between extreme high values of AzShear near a tornado versus more broad convergence on any wind shift area.


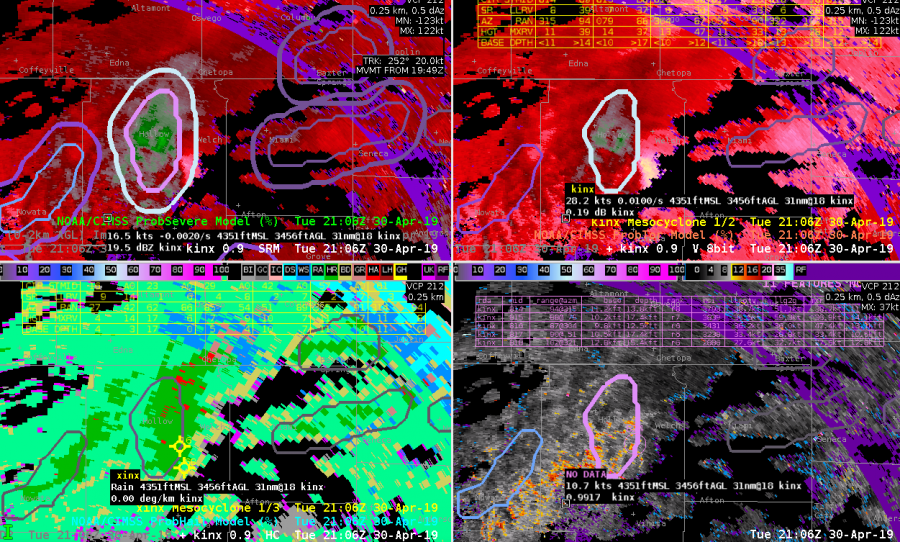
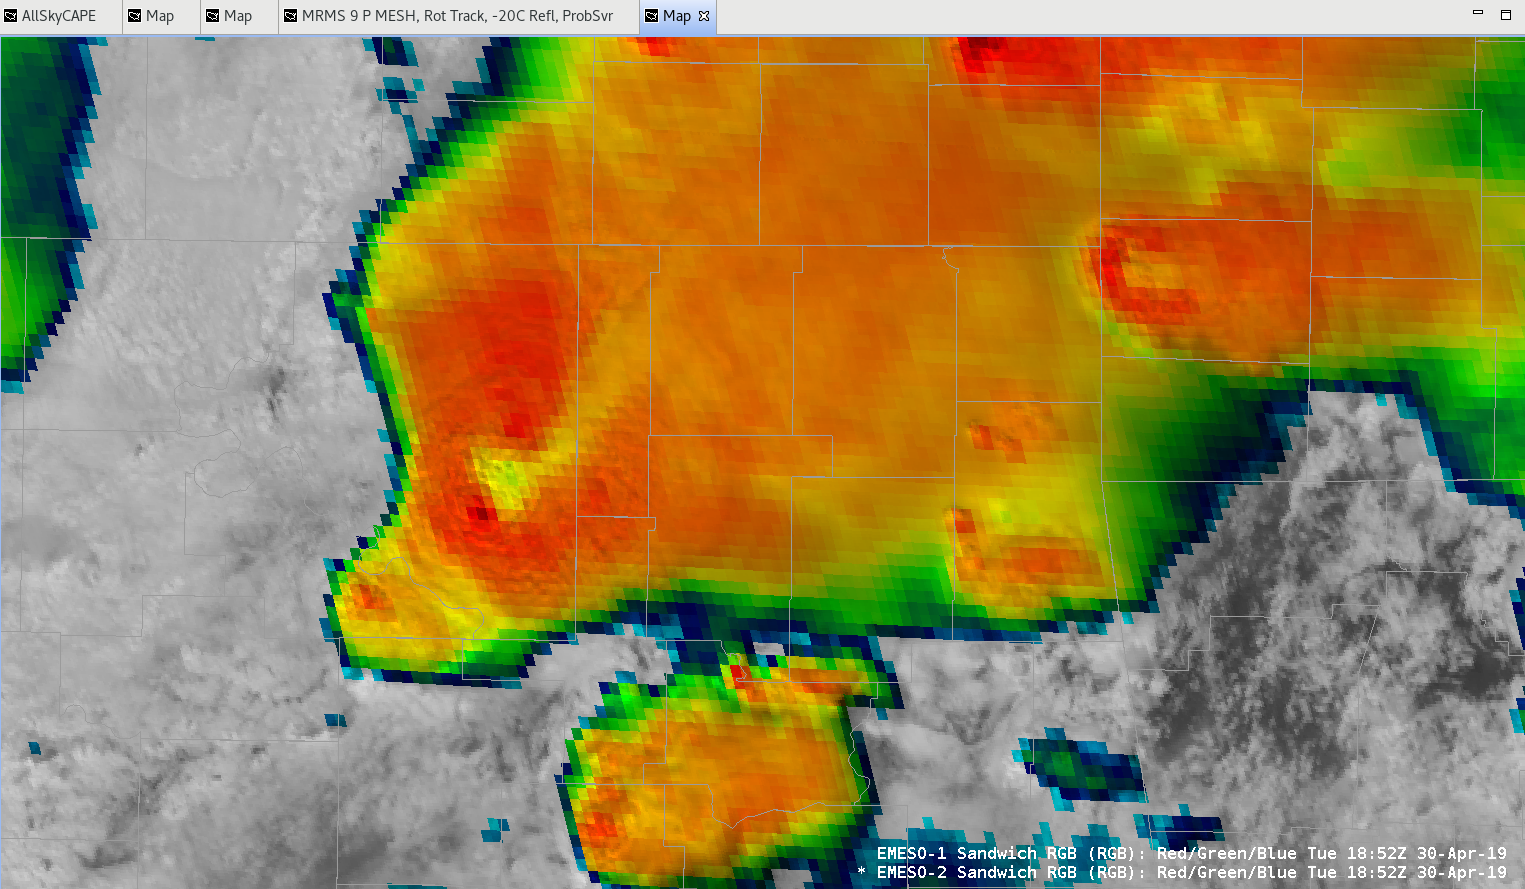
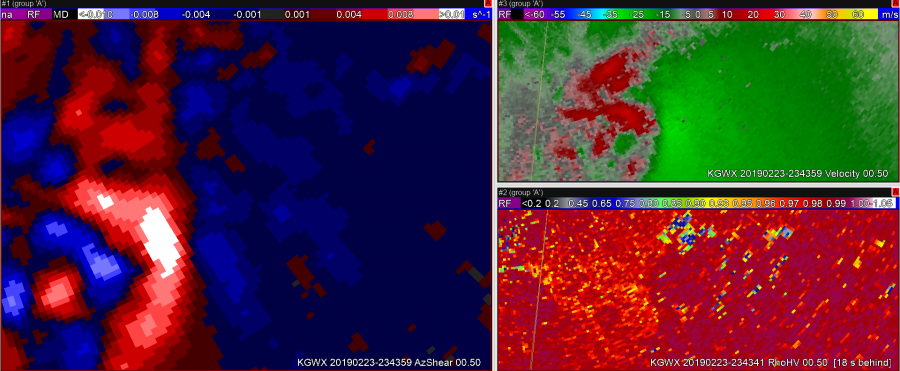
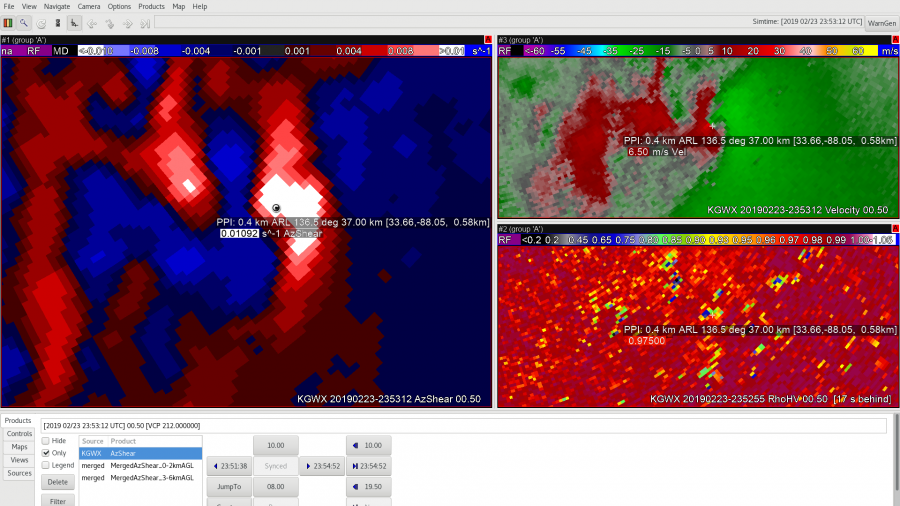
This next image shows a region where the AzShear maximum is too broad. This may simply be a color table issue, but clearly there is an area within the white region where a tornado is on the ground, and other regions within that max where only general convergence is occurring.


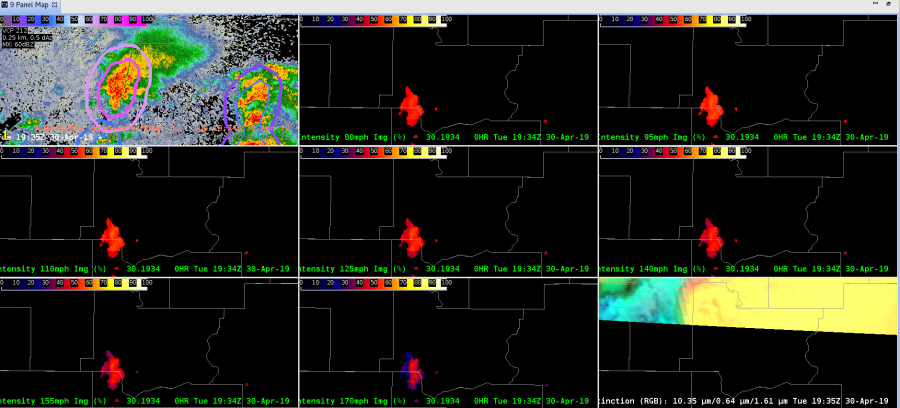
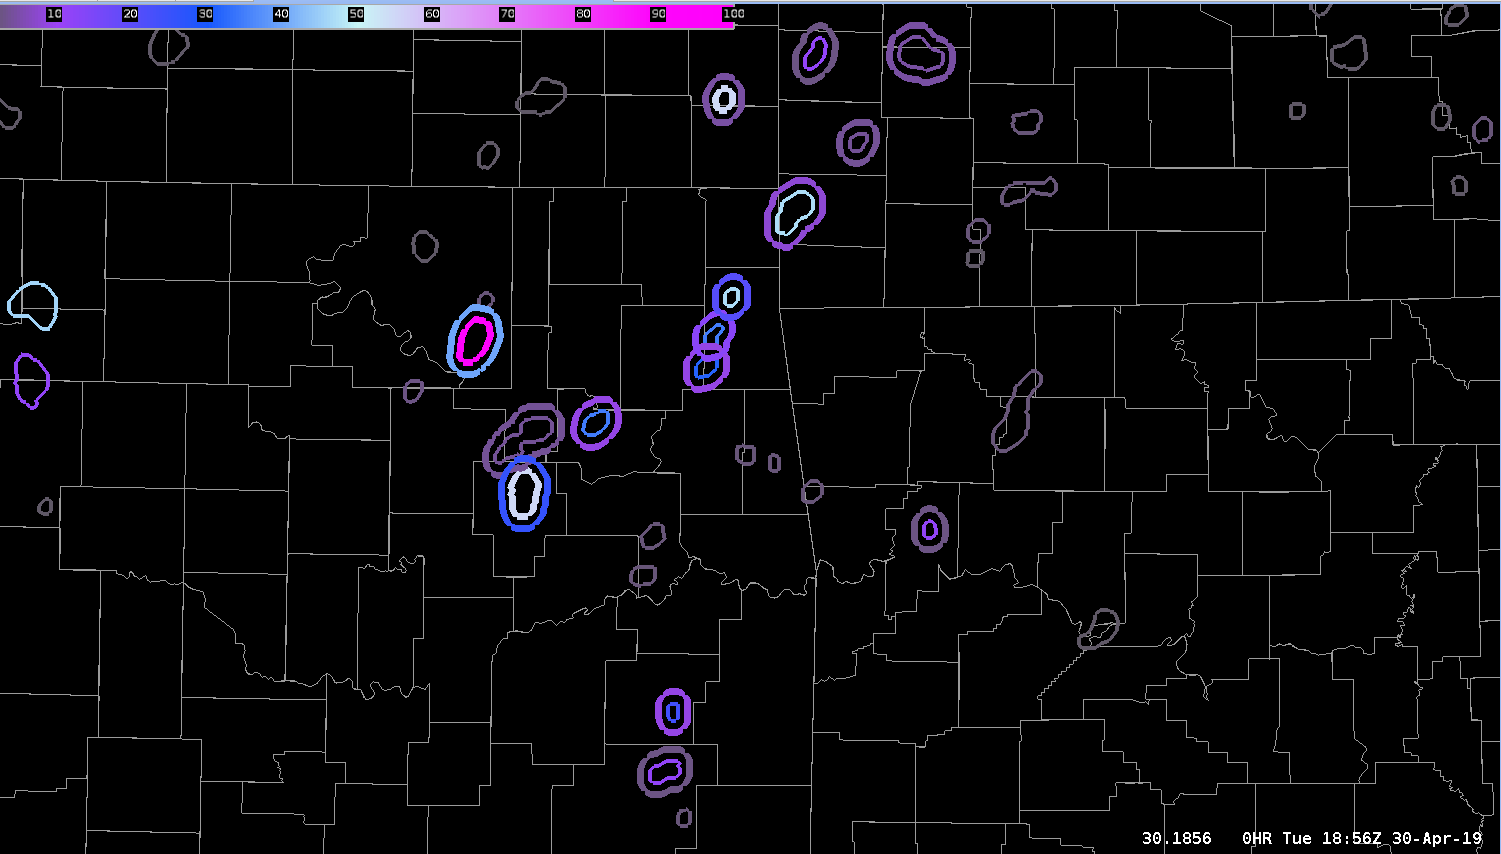
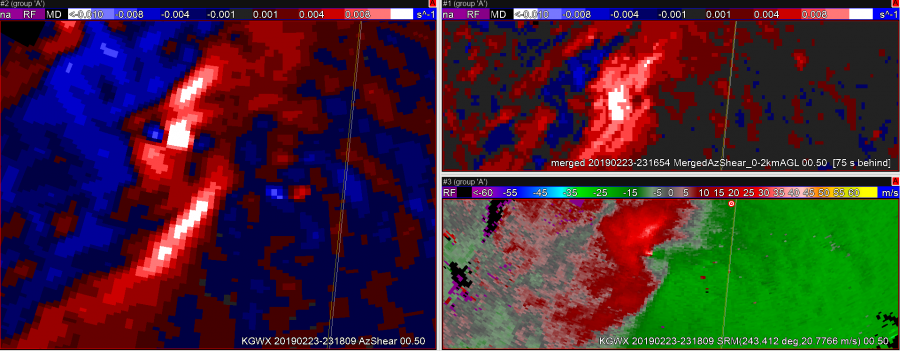
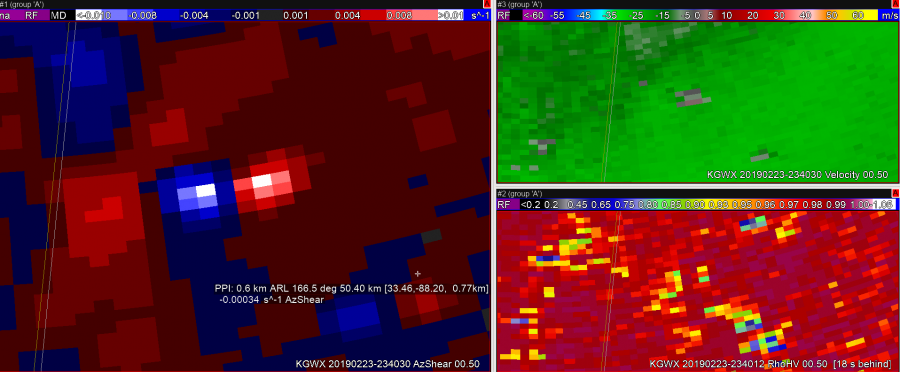
This image shows a location where some ground clutter is producing a false positive and negative AzShear couplet. Mathematically it makes sense to see this here given the V data, however to an untrained eye or someone just solely depending on AzShear you could be led astray.


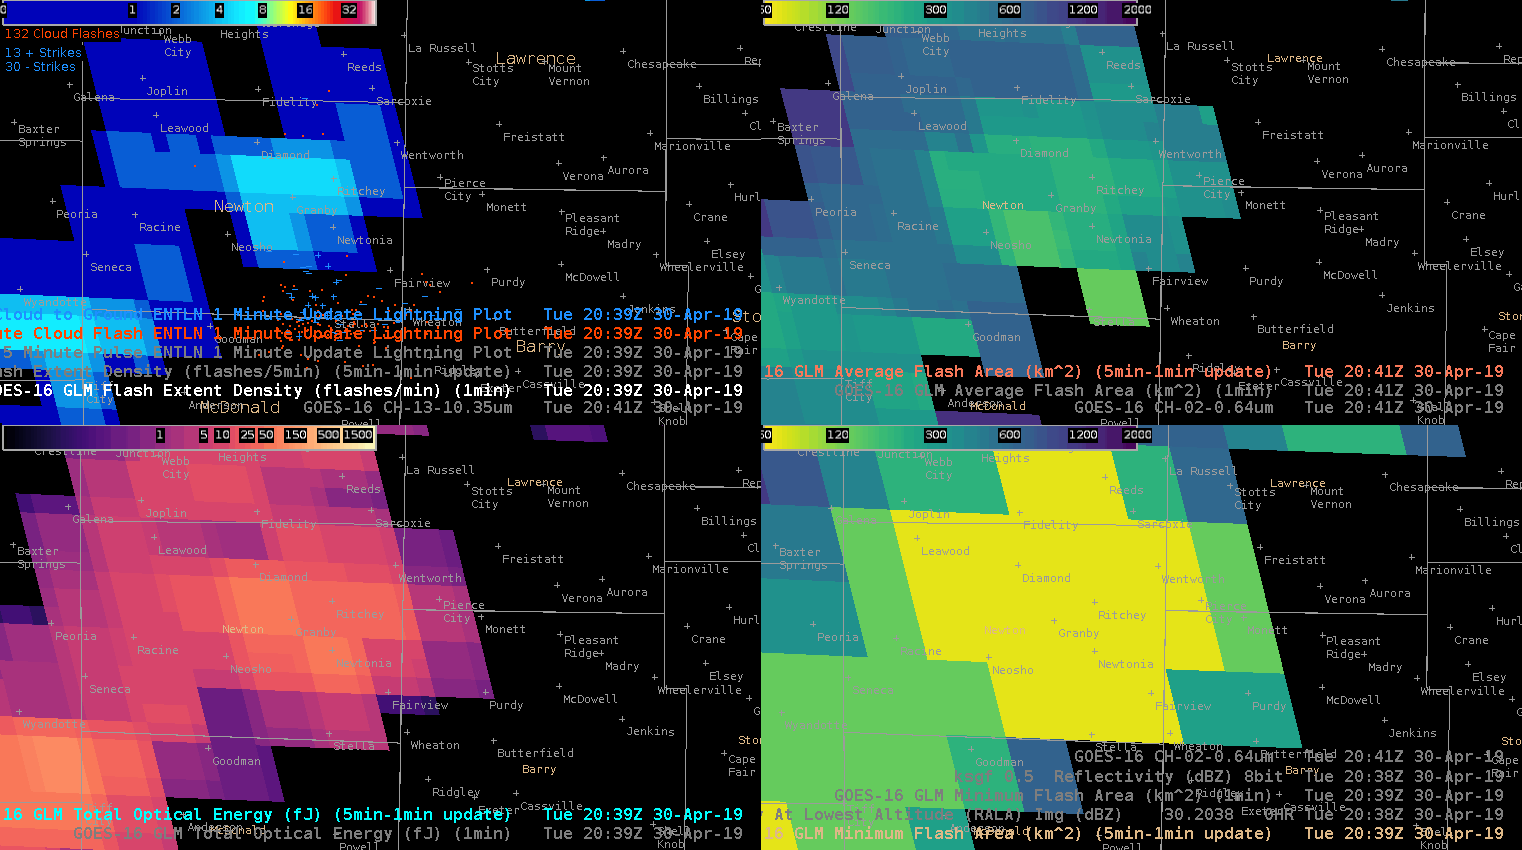
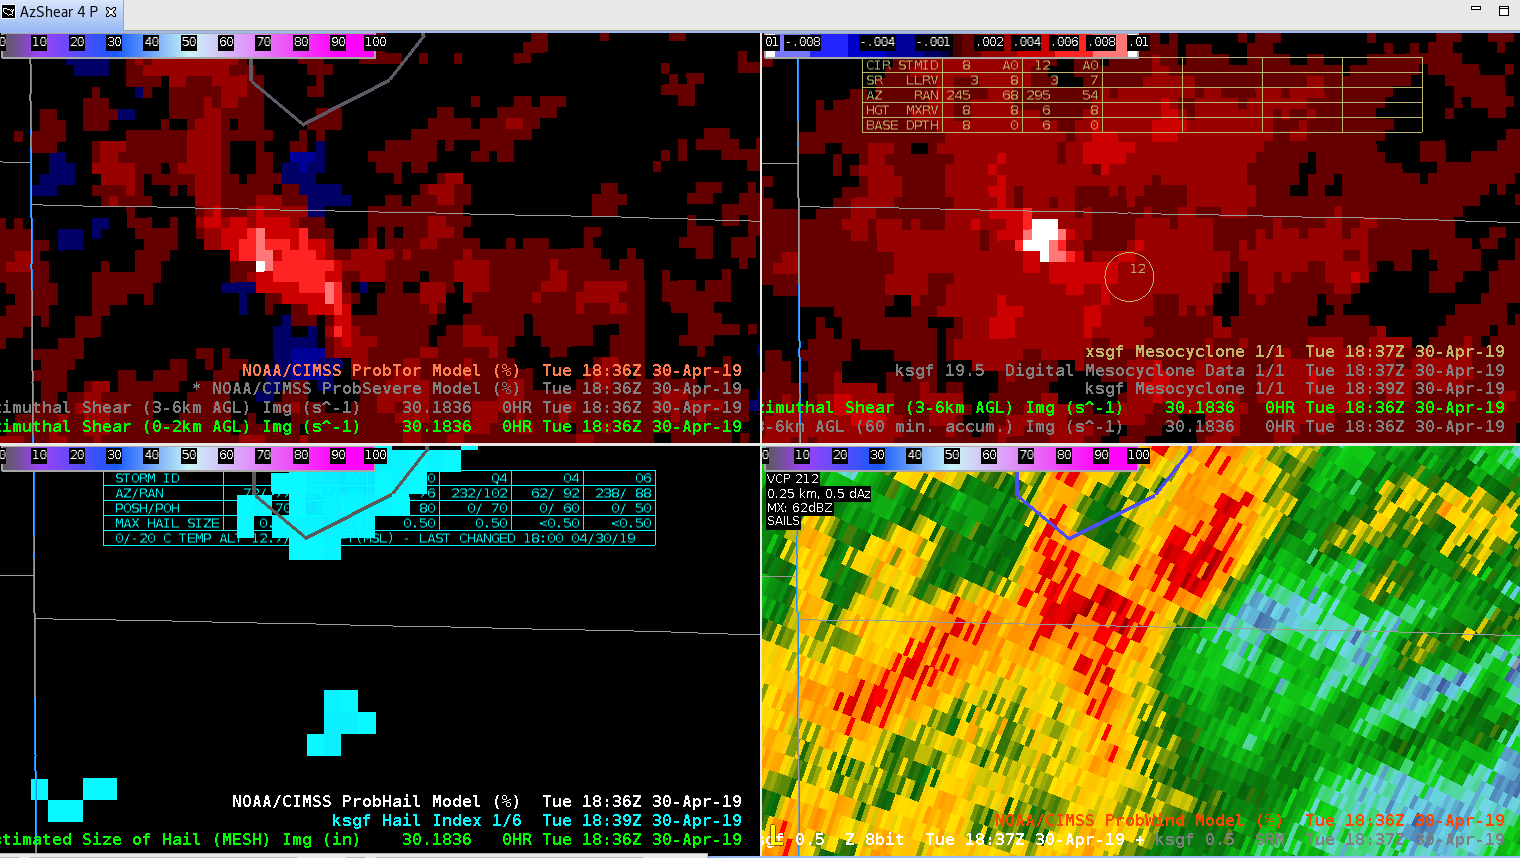
A positive of AzShear is that it can highlight areas of potential concern down the road. The above frame was just one of several frames showing strong convergence and high AzShear values preceding a second tornado from the main cell 10 minutes later. This could be particularly helpful in QLCS storm modes where convergence and shear increases in a broad sense along the main line prior to tornadogenesis. Also in this particular case, the V data was not entirely conclusive that convergence was increasing. AzShear was very conclusive here.


Dusty Davis

AZShear case 2/23/19

First impression of the single radar AzShear……display is rather noisy with lots of couplets…many not associated with any storm. Perhaps if had the option to filter out negative values (blue) so can focus on positive values only would make for easier digestion of data and enhance SA.   IN current state of product, would have have to be sure to compare to base velocity data, etc.

Azshear did  help draw my attention to potential cyclic nature of the storm and picked up on increasing shear to northeast perhaps a little sooner than if I had not been looking at it.  Pickup up on second circulation and locked on to it very well as second tornado(?) developed.

Azshear also seemed to highlight the shear along the RFD/Flanking line rather well.

0-2 km merged product provided similar information.  Did not have good feel for 3-6 km product yet.

Again, biggest drawback is the noisiness of Azshear.  I could see where this could distract from true area of shear associated with developing mesocyclone. Color enhancement could be improved as well.

Quik TWIP


23 Feb 2019 Case – AzShear

The single radar AzShear provides good continuity with persistent mesocyclones. It also highlights well meso handoffs. The single radar AzShear is far superior to the merged product. The merged product does not provide as smooth of a track and suffers from obvious different depictions of the circulation from varying ranges and sample times giving a more blotchy appearance and larger overall signal.

— S Coulomb

AllSky & TPW Check

Did a quick check of the merged TPW and AllSky products and as previously advertised/anticipated, the convection has been riding right along the gradient of the higher instability, but there is some discrepancy as to whether it’s right in the heart of the higher PWATs or along the leading edge, depending on if you’re looking at the AllSky or TPW, respectively. Noticed quite a bit of a latency in the availability of these products (up to an hour), which wouldn’t be good in an operational setting. Compared the values of the TPW and AllSky PWAT with the RAP, and the AllSky matched up much closer to the RAP. However, with the amount of cloud cover in the region (for obvious reasons), the GFS is the predominant data type (basically a model-to-model comparison). Either way, the general idea/trend is helpful if serving as a mesoanalyst in an operational environment.

~Gritty

(CAPE)

(AllSky PWATs)

(Merged TPW)