GLM Helped Situational Awareness

GLM data helped me stay situationally aware as new updrafts quickly strengthen on eastern edge of CWA.

Issued a warning on this cell about ten minutes after upon continued strengthening in the radar fields and prob severe (hail/wind) values rapidly increasing (I find the time series plots very valuable). Given storm environment I expect the storm to continue to strengthen to severe levels.


-icafunnel

Evolution of ProbSevere

I am finding the all hazards version of ProbSevere to be extremely useful as a situational awareness and decision making tool. Here is a short animation of the evolution of ProbSevere thresholds for a storm near Kermit, TX.

Below is a timeseries for the same storm…

A loop of the ProbSevere thresholds provides a quick look at the potential hazards, but it becomes even more powerful when you combine it with the timeseries.

Tornado reported in area NMDA detected a meso

A tornado was reported to have touched down at 2127z. Per the AMA radar (report was in northern LBB’s CWA), the NMDA (bottom left) was the only MDA to indicate a meso in the area the tornado was reported. The Legacy MDA (top left) and DMDA (top right) indicated a meso with the cell to the west of the primary meso.

Web ProbSevere Table Cutoff

A small cosmetic issue, but I noticed that the Table Display from ProbSevere gets cutoff on the top row, and covers the axis information on the last row.  Also had some difficulty zooming out at times, but may have fixed the issue but unselecting option to synchronize ranges.

#ProtectAndDissipate

MDAs & Lubbock CWA Supercell

A strong supercell in Lubbock’s CWA is the first example I have witnessed of the NMDA (bottome left) performing better than the legacy MDA (top left). The DMDA (top right) followed the meso at times, but the NMDA seemed to perform the best in this particular situation. The legacy MDA failed to pick up on a meso at all.

Big, Bad Flash or Bad Big Flash…Update

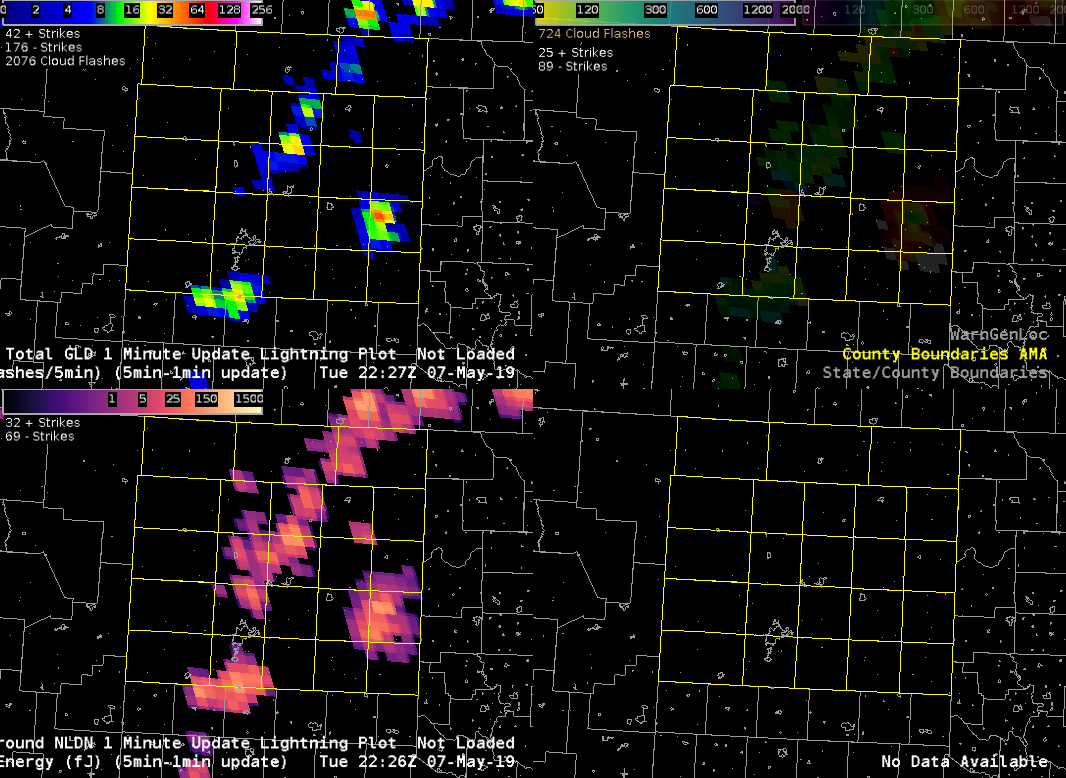
Well, one piece of the puzzle was solved.  A second large flash in the Minimum Flash Area  product occurred between Lubbock and Amarillo, around 1500 km2.  To see what was going on, we now take a look at the difference between GOES-16 GLM:
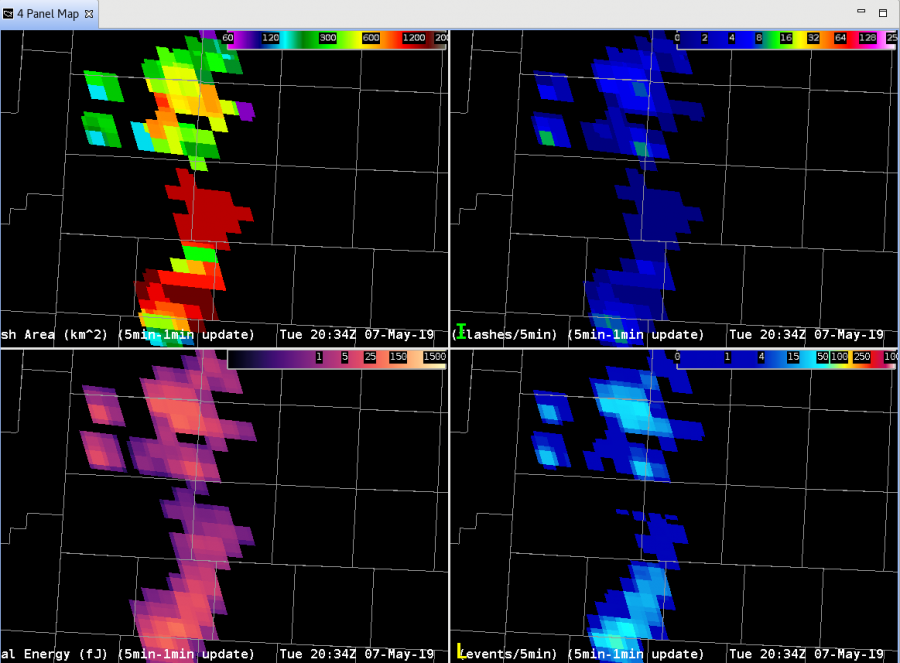
and GOES-17 GLM:

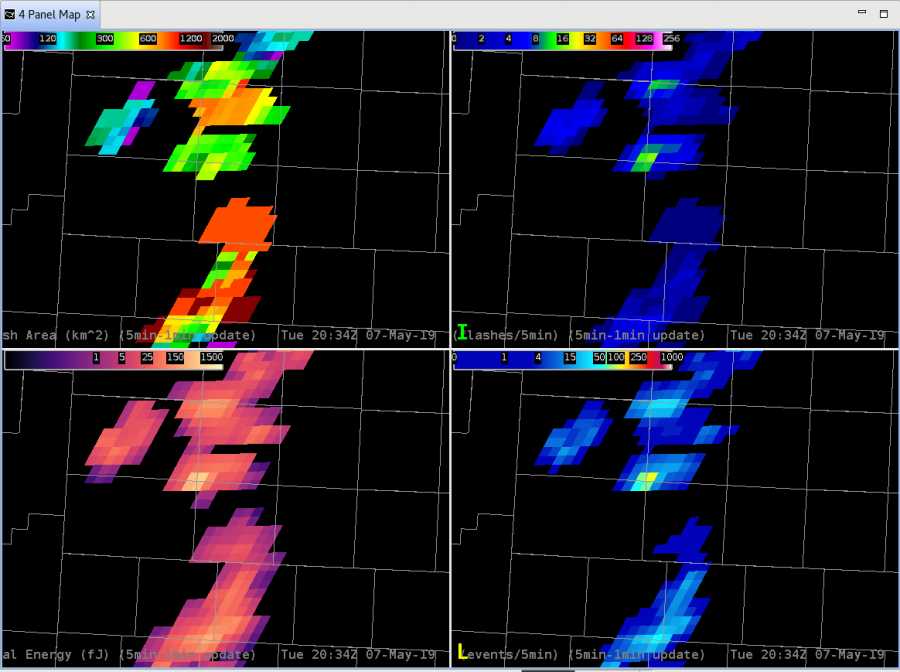
After a LOT of going back and forth, we realized that the color table for Flash Extent Density had the alpha at zero for anything around 1.0 to 1.244.  SO, the previous example that showed no FED actually DID have data associated with the large flash; it was hidden (my bad!).  Fixing the color table to plot any data greater than zero at the darkest color blue and…voila! The large flash now does show a FED of 1.0.  So that problem is now solved.

However, there is still a question as to why that big area flash occurred where it did, when it did, and if it was actually as large of a flash as indicated.  Still something to dig into further!

-Dusty

TPW Differences Along Dryline

The CIRA Merged TPW and All Sky LAP in the TX panhandle show some differences in the vicinity of the dryline at 19 UTC on 7 May.  This is a cloudy region so the retrievals are either GFS (All Sky LAP) or advected polar microwave (Merged TPW),  The All Sky LAP TPW shows a moist panhandle, with values in green / yellow (1″ or above).  The Merged TPW indicates lower values in green / purple, or about 0.7″.  Surface dewpoints range from 59-65 F, indicating moist air ahead of the dryline.

Surface GPS observations from Suominet at three TX stations in the panhandle (Amarillo – 1.0″, Borger – 1.0″, and Canadian – 1.1″) lean closer to the All Sky LAP analysis.  An hypothesis for the Merged TPW being low is dry retrievals from higher terrain to the west being advected into the moist sector.


JohnF