
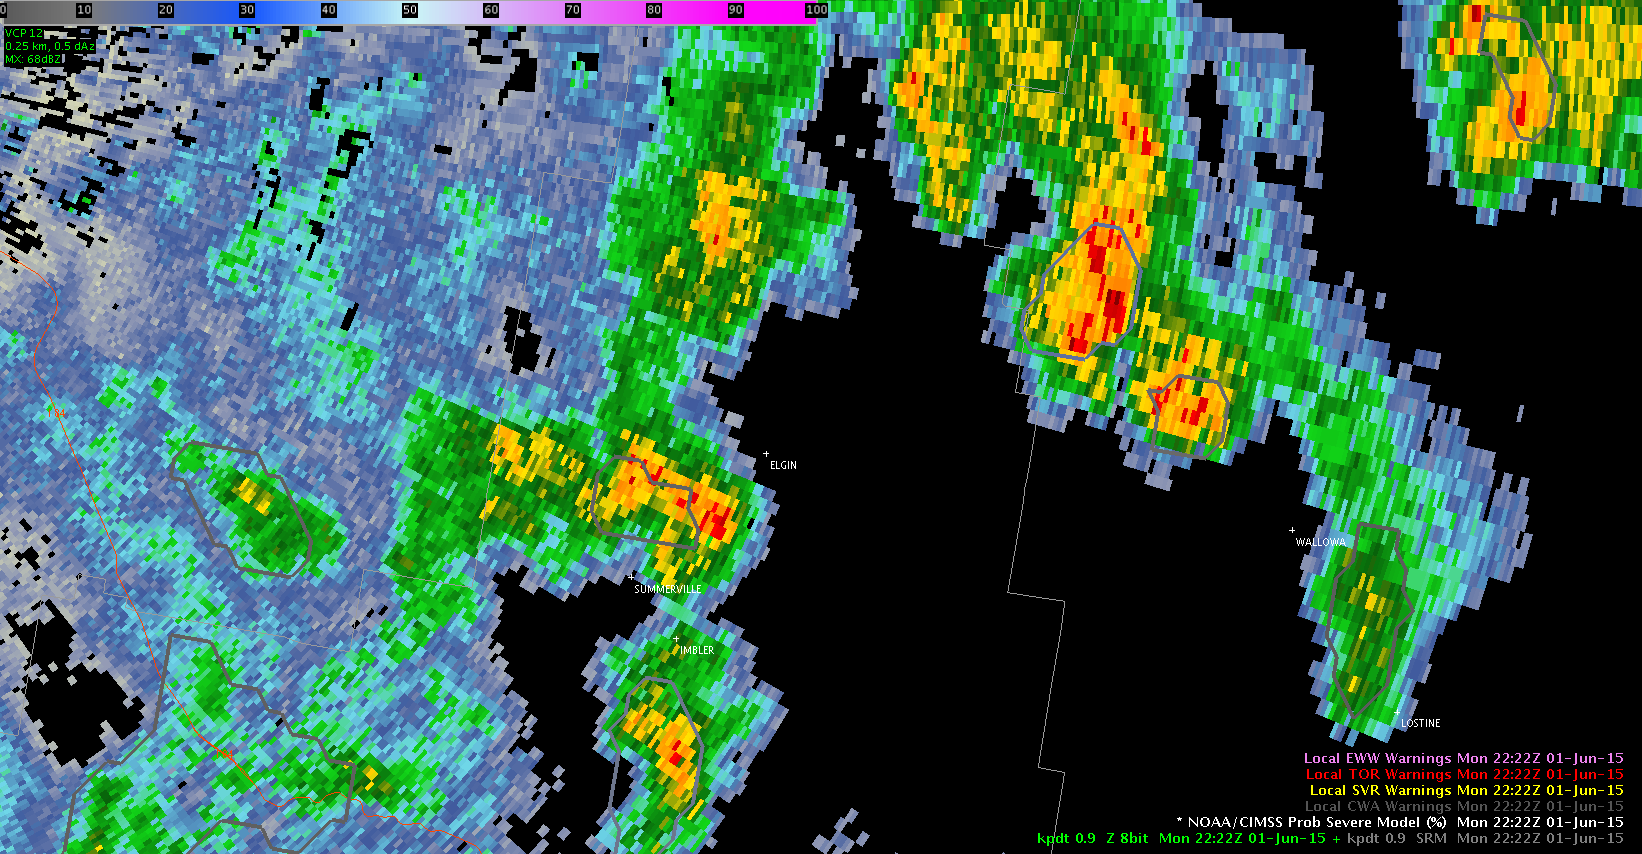
There was a 1″ hail report at 2236z north of Elgin, OR. The highest ProbSvr value was 3% with a MESH of a quarter-inch. Attached is the 2222z radar scan and ProbSvr overlay.
Williams & MacGyver
Official websites use .gov
A
.gov website belongs to an official government
organization in the United States.
Secure .gov websites use HTTPS
A
lock (
) or https:// means you’ve safely connected to
the .gov website. Share sensitive information only on official,
secure websites.

Real-time posts made during testbed nowcast and warning operations.
There was a 1″ hail report at 2236z north of Elgin, OR. The highest ProbSvr value was 3% with a MESH of a quarter-inch. Attached is the 2222z radar scan and ProbSvr overlay.
Williams & MacGyver

ProbSvr climbed above 50% at about the same time a TBSS became evident:

Issued a warning based on the TBSS signature in conjunction with the ProbSvr value quickly climbing (it reached ~80% with MESH of ~1.25″).
Williams & MacGyver
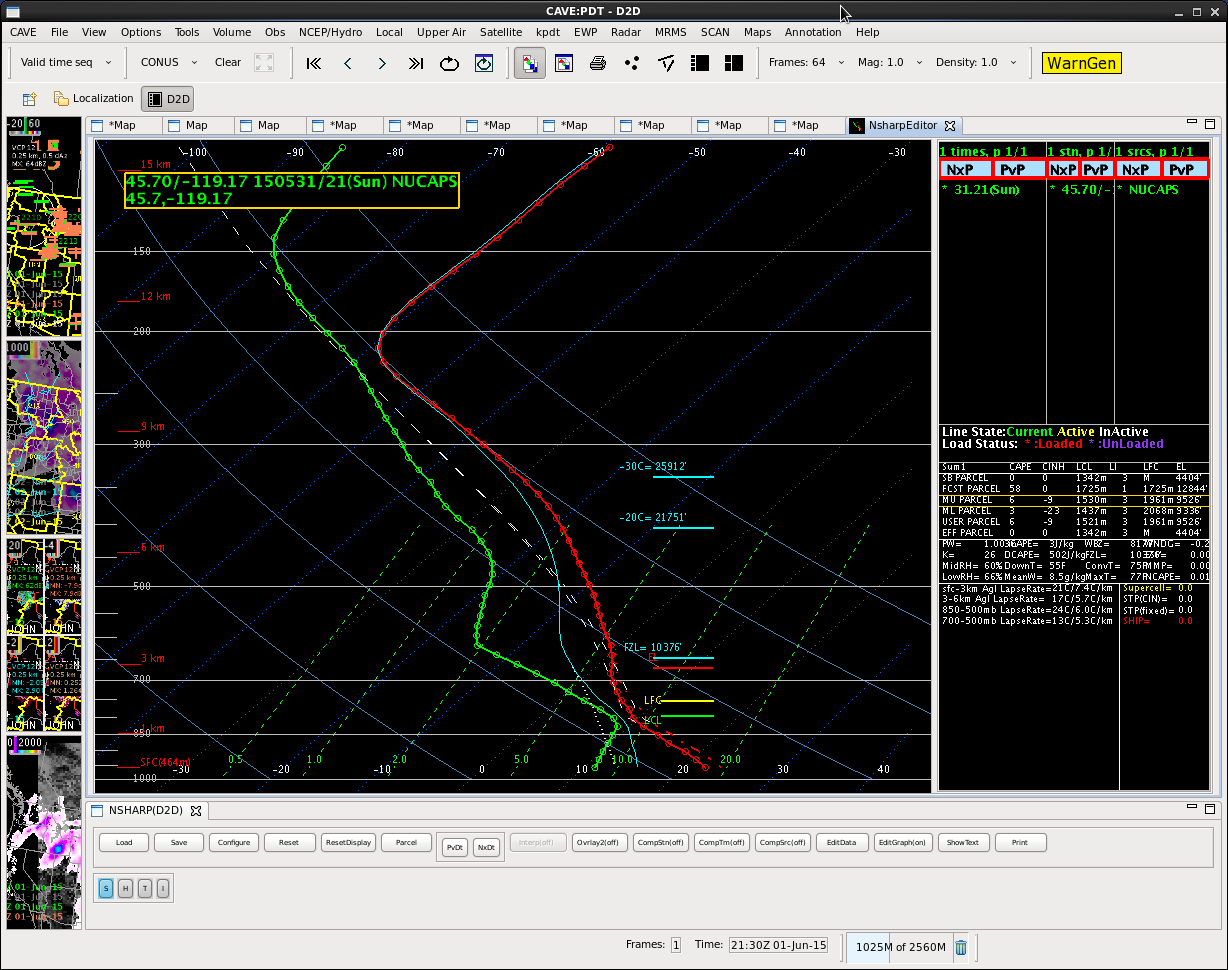
Finally got the NUCAPS data. Was waiting for this data to compare with local sounding from BOI. Had to mix the low levels to actual values. After this, it was clear why convection was not going on to our northern CWA….there is some warm air across the northern CWA. This sounding isnt as dry in the low levels, suggesting that there is not as high of a chance for wind.
Williams & MacGyver

 Timeline of values:
2042z – 31%
2046z – 54%
2050z – 70%
Levelled off at 72% thereafter
The problem is that this is likely a very sparsely populated area, so even if there were to be severe weather, it probably won’t be reported. Will be hard to verify…
Growth rates show up as N/A for this cell, which has been the case for all cells that ProbSvr pegs in this area so far.
Williams & MacGyver
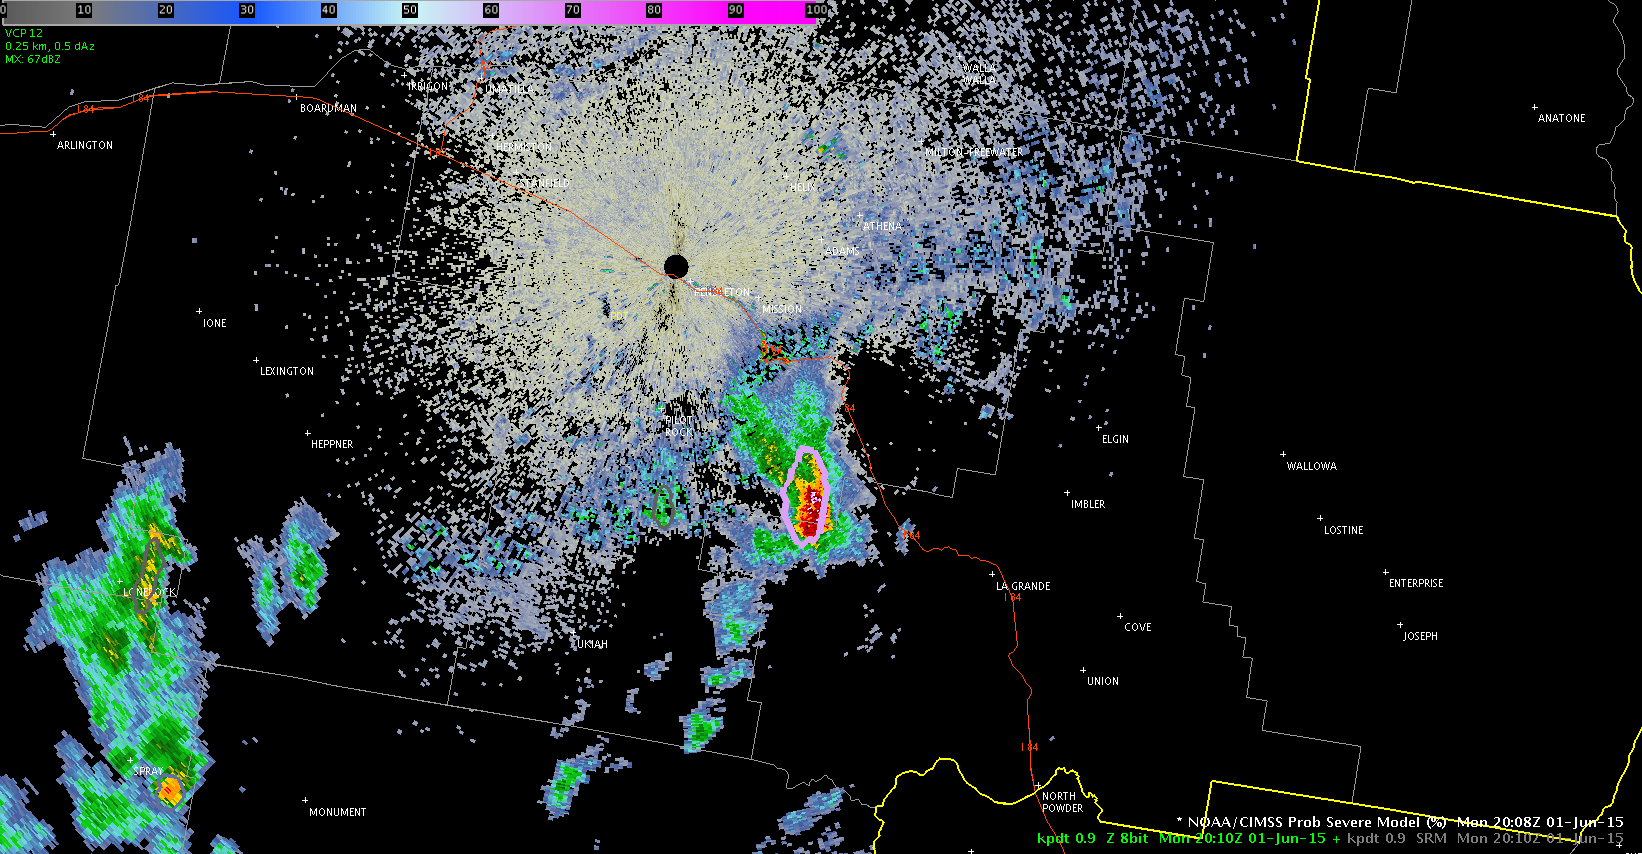
Issued a SVR at 2011z for SE of KPDT based in part on the ProbSvr product. Reached 67% at 1950z but came back down to 40% at 2000z. Shot back up to 77% at 2010z. Wanted to see how well it performed for our expected risks of 60mph wind and quarter-sized hail. Growth rates show up as N/A; MESH hail is over 1″, MUCAPE ~1600 J/kg.
Very little lightning, so ENI has not picked up any thunderstorm alerts.
Williams & Macgyver

A cu field developed in portions of the Pendleton, OR CWA shortly after 17z. The CAPE derived from GOES is underperforming compared to the RAP CAPE (up to 1800 J/kg). There is a zone where RAP CAPE is 600-1200 J/kg where the GOES estimate is zero. Just to not out-model ourselves, the GOES-derived CAPE does not match up with the cu field’s location.
A positive is that the GOES-R CI has pegged area of possible convection (in a few spots >50%) that lines up very well with where the cu field has developed. The outline of individual cloud elements that is discernible to the eye is also being picked up by the CI algorithm.
Jason Williams and MacGyver
Participants were reminded that the GOES-R CAPE values are CAPE in the layer between the LFC and EL, so to compare absolute values with (MUCAPE here), is not very 1-1. Additionally, these products use a GFS first guess, so if the GFS is way off for whatever reason, the retrievals will likely be off as well, even if they do provide some degree of bias correction – BL
Hello everyone! This is day one of Week 2 of the Experimental Warning Program and we are getting situated and learning the products and making procedures. I personally was excited to try out the ProbSvr model as I think it could help with storms that pulse and that become severe or near severe within a scan or two- this is extremely useful in the northeast and even in squall line situations. While looking at it today in LMK’s area, we got a report of power lines down and I captured some of the ProbSvr data and I found it very interesting. I’ll step through the times.
1818z- This is as the northern storm was strengthening and the ProbSvr is hinting about 24%.

Next, at 1823Z, the ProbSvr bumped up to 61%

At 1825Z, the next scan, the 61% is still there (probably the same run).

At 1829, the ProbSvr has decreased once again.

Although I didn’t put velocity here, it isn’t overly impressive. Important to note is the rear inflow notch that looks like it is trying to develop.
At 1830z, the office received a report of power lines down with this northern storm.
In the training on ProbSvr, the examples were giving huge lead times when the model went above 50% but this isn’t always the case. I found this case interesting because it only gave about a 7 minute “lead time” before the first event. It looks like the storm surged/pulsed right at that time but noticed how the model surged back down before the event. How does a forecaster handle this? When it surges up and goes right back down? Would it change my warning process if it decreased next scan? It is still too early to say what the implication is but I will definitely be keeping an eye on these probabilities as I go forward!
Lauren13
After a busy day at ICT, we have come to the conclusion that radar base data is still our #1 when it comes to warning operations, while the other tools are “confidence boosters”. With many (if not all) of the warnings we issued today, there was little doubt that the storms were likely to produce severe weather. The radar base data told us what we needed to know to go ahead and issue the warnings, with things like lightning jumps and prob severe being more of a reassurance. In a lot of cases, the prob severe did not substantially increase until we we already in the process of writing up or had already issued a warning. Take this storm in Ellsworth County, KS for example.
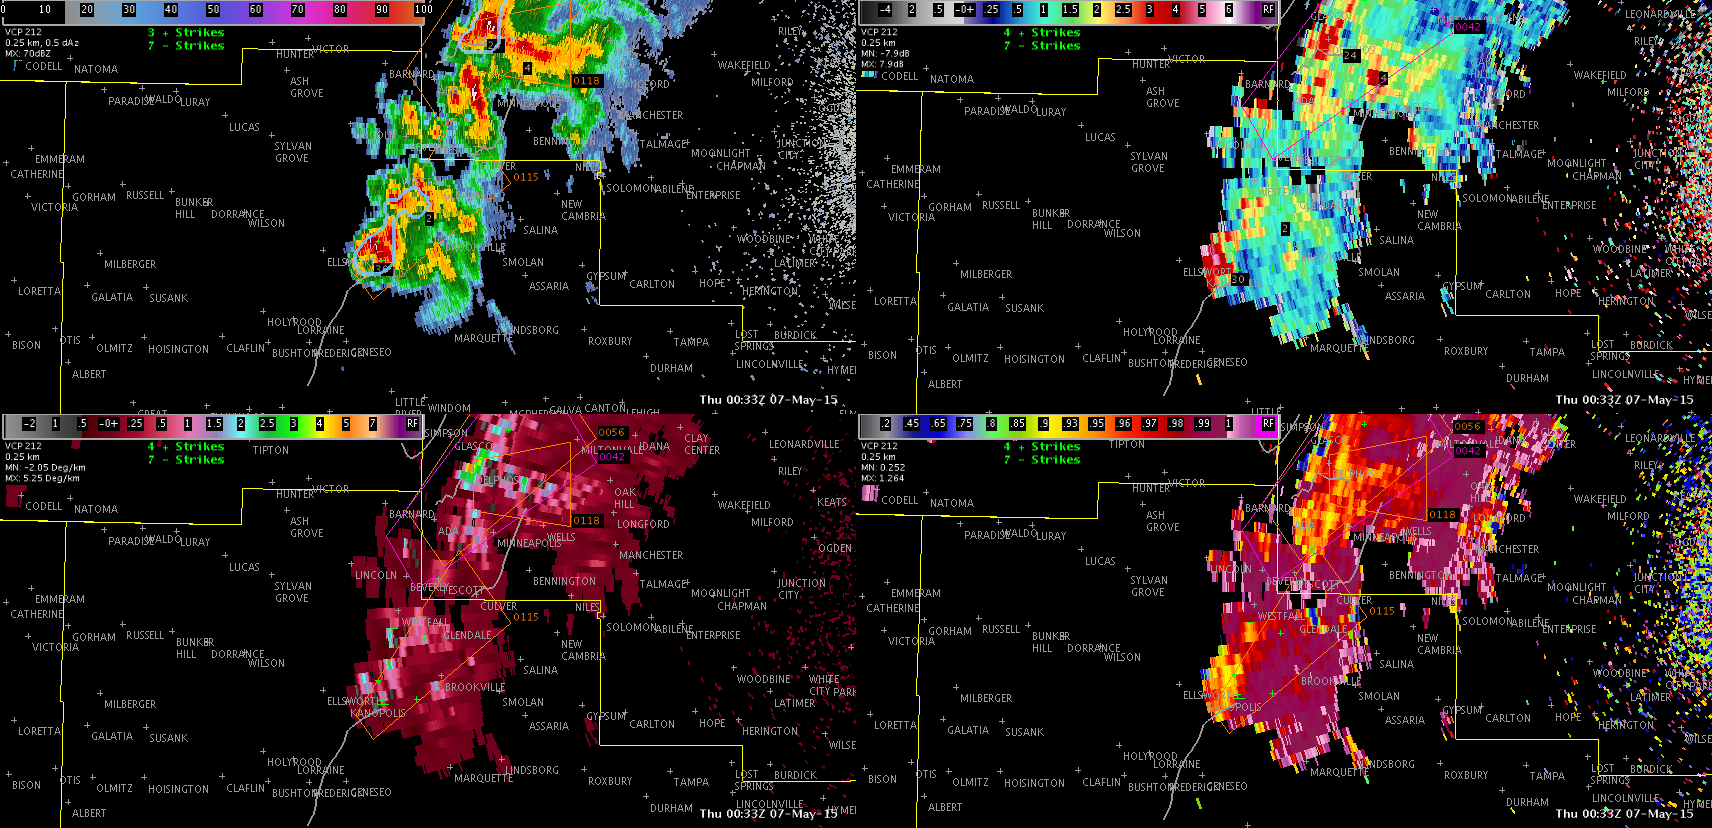
When we decided to issue a SVR for this storm, the prob severe was only 13%. Meanwhile, the base data was pointing towards severe hail.
As the warning was being typed up, the next volume scan came in and the prob severe jumped to 85%. Trends in lightning were also more of an afterthought/confidence booster with regards to subsequent storm intensification.

In cases like today, the supplemental tools did not necessarily add any lead time. We do think tools like prob severe and changes in flash rates would be a bigger help with the warning decision making process in marginal severe environments or pulse storms.
Jack Bauer/V. Darkbloom
Forecasters are working in the Midland, Texas county warning area investigating all of the products that are available to them for evaluation this week. Like my earlier post on lightning observations available at HWT, this post is a quick highlight of the GOES-R CI.
The image below came from 4 May 2015 at 2000 UTC. The GOES-R CI (upper left) highlights a region with 60+% probabilities. The upper right shows the Earth Networks 1 minute lightning observations while the lower left shows the radar reflectivity.

By 2036 UTC, a small cell with 40+ dBZ is observed (circled) and shown below.

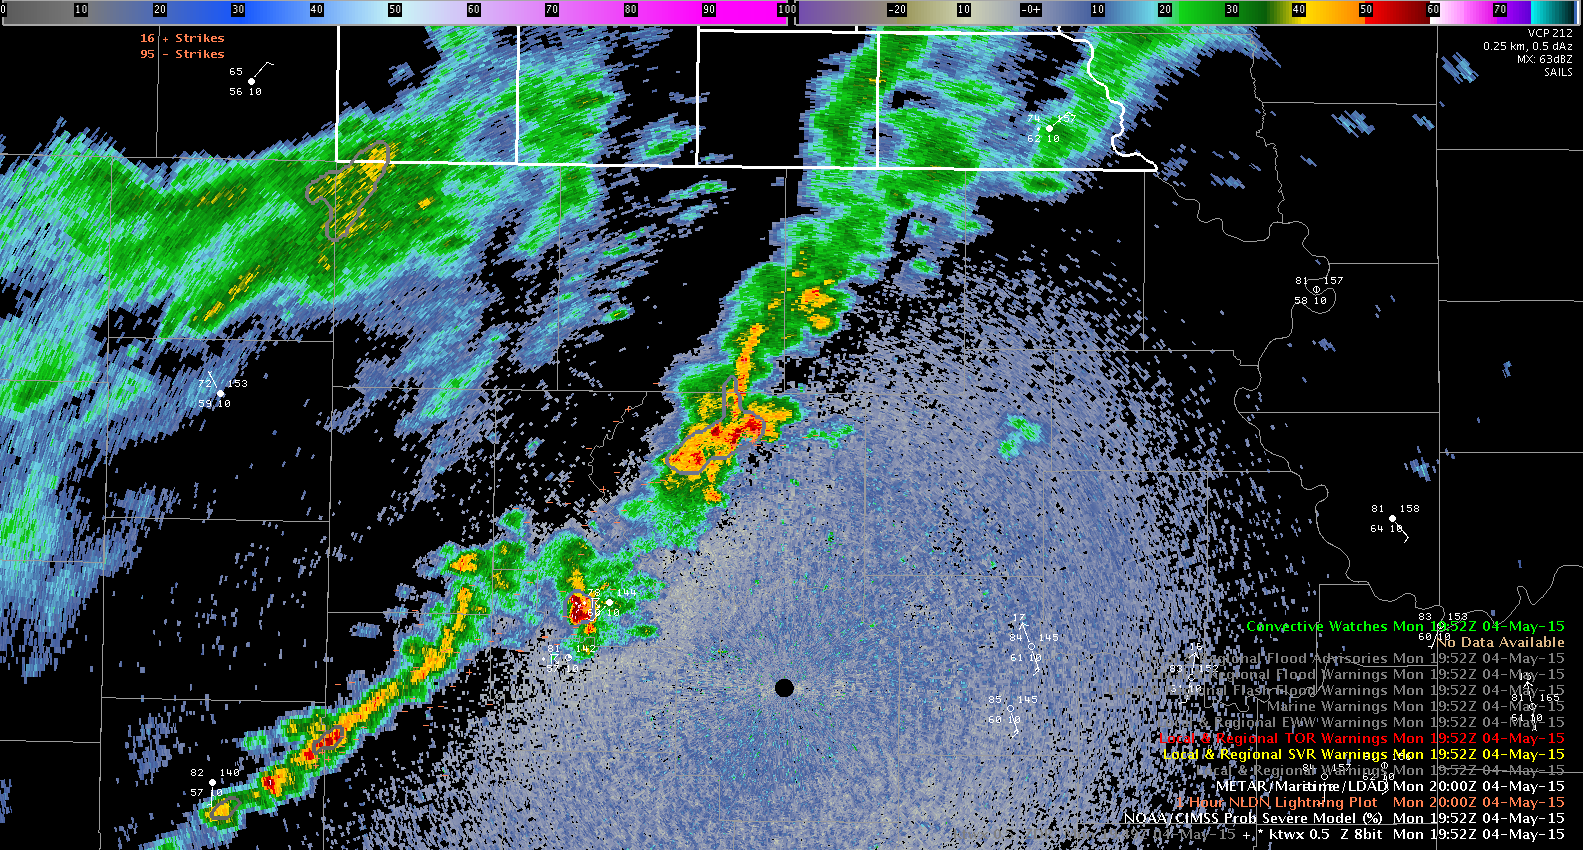
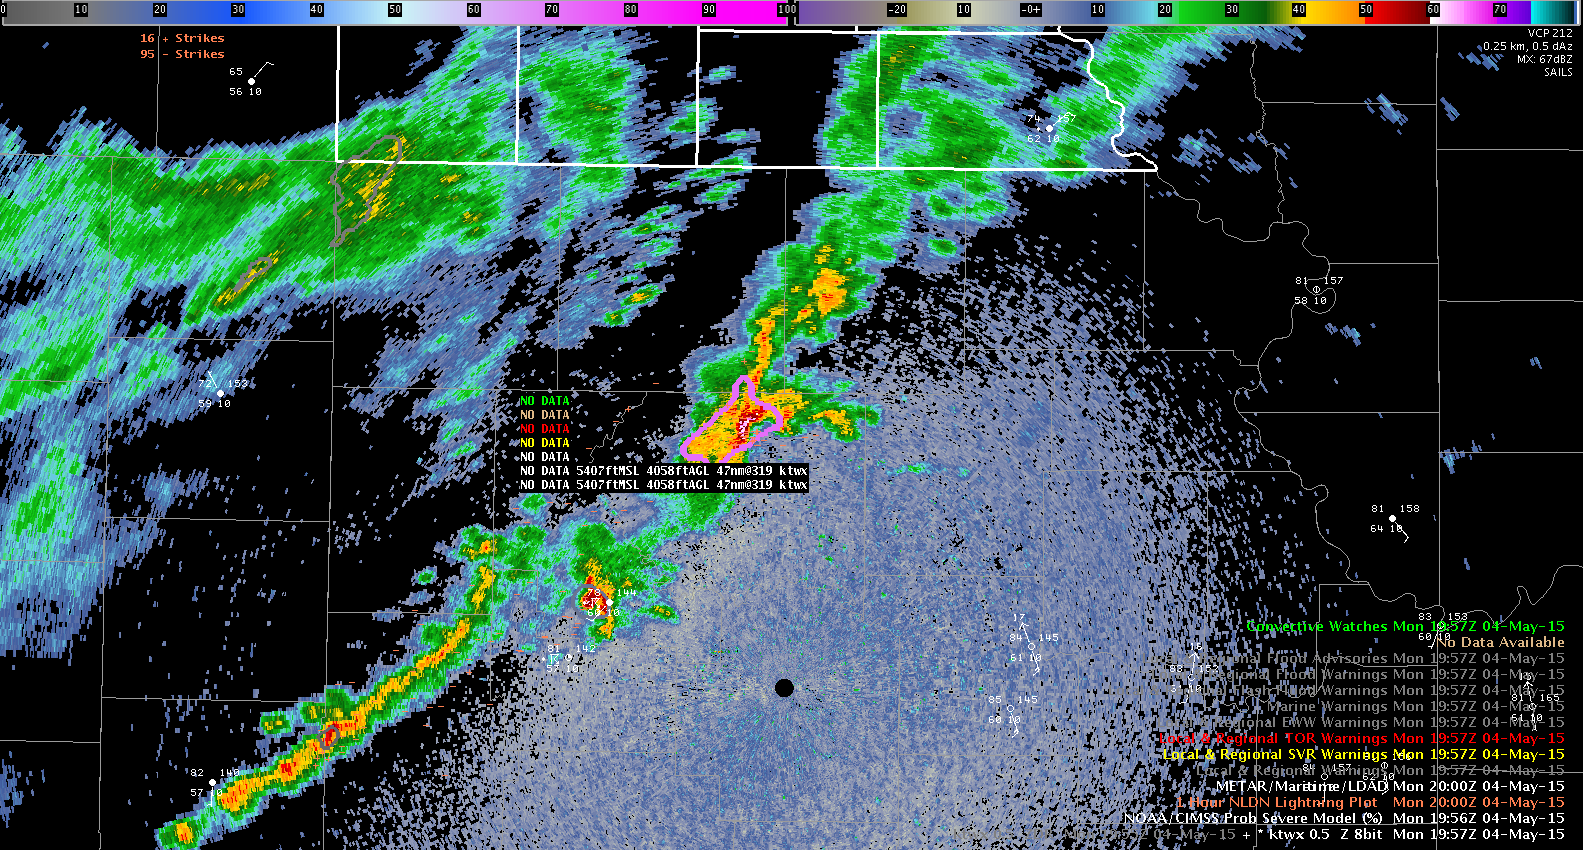
The storm of interest began to develop in a weak line of showers around 1930 UTC. Surface obs through the area indicate temperatures in the lower 80s and dewpoints in the upper 50s to low 60s. ProbSvr indicated around a 10% chance of the storm becoming severe. The storm slowly strengthened over the next 20 minutes, but the Prov Svr remained around 10%. From 19:52 to 19:57 UTC, the storm intensified rapidly, and the Prob Svr jumped from 13% to 72% (time of two radar scans)
It appears the storm is beginning to root along the E-W warm frontal boundary through the region. At 20:11Z, ProSvr MRMS MESH indicates 2″ in diameter hail in the highest dBz core. This area correlates well with lower values of Zdr of near or just below 0 dB.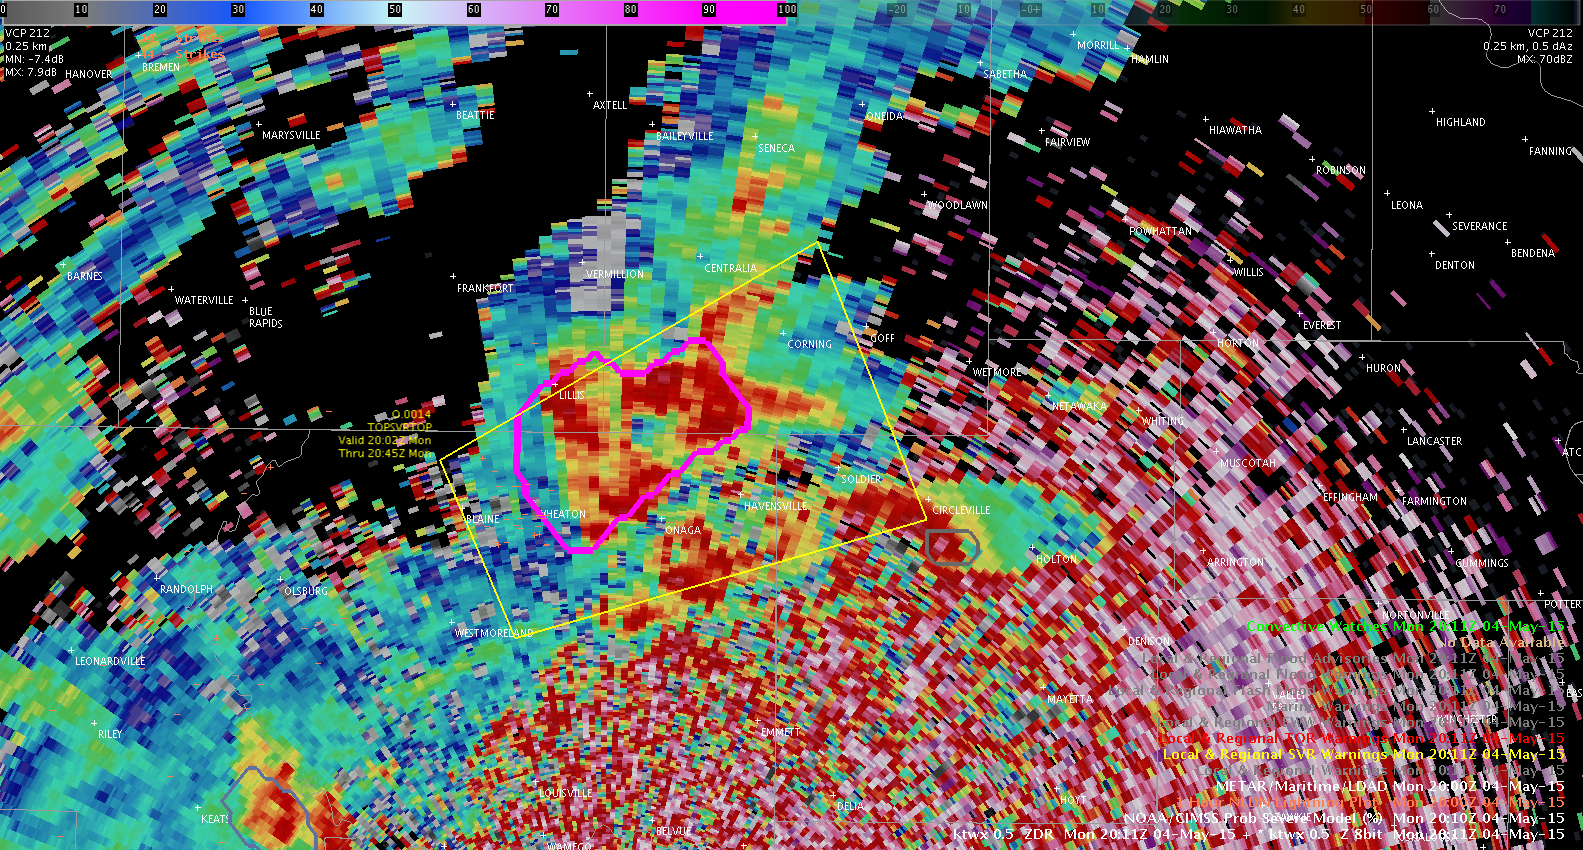
Although I did not see any hail reports while I was watching the storm, the first severe wind gust report (60 mph) occurred at 20:30 UTC, about 32 minutes after the ProbSvr rapidly increased. Because I used the site radar (KTWX), there was a slight lag in the availability of the ProbSvr data.