Operational Feedback of Gremlin, Octane, and LightningCast during a Severe Weather Outbreak in Central Oklahoma

I tested the OCTANE, GREMLIN, and LightningCast products during an actual severe weather event on 6/3/2025. My role during this testbed was that of the mesoanalyst.

Initial environmental analysis shows weak to moderate shear, which was determined via ARARS soundings and SPC Mesoanalysis, along with OCTANE imagery showing divergent / accelerating speeds within the storm anvils. VAD hodographs were used as convection developed to see rapid changes within the shear profile during the course of the event (as convection altered the broader environment). Shear increased as the event progressed. OCTANE and LightningCast were both useful showing the uptick in storm intensity as shear increased.

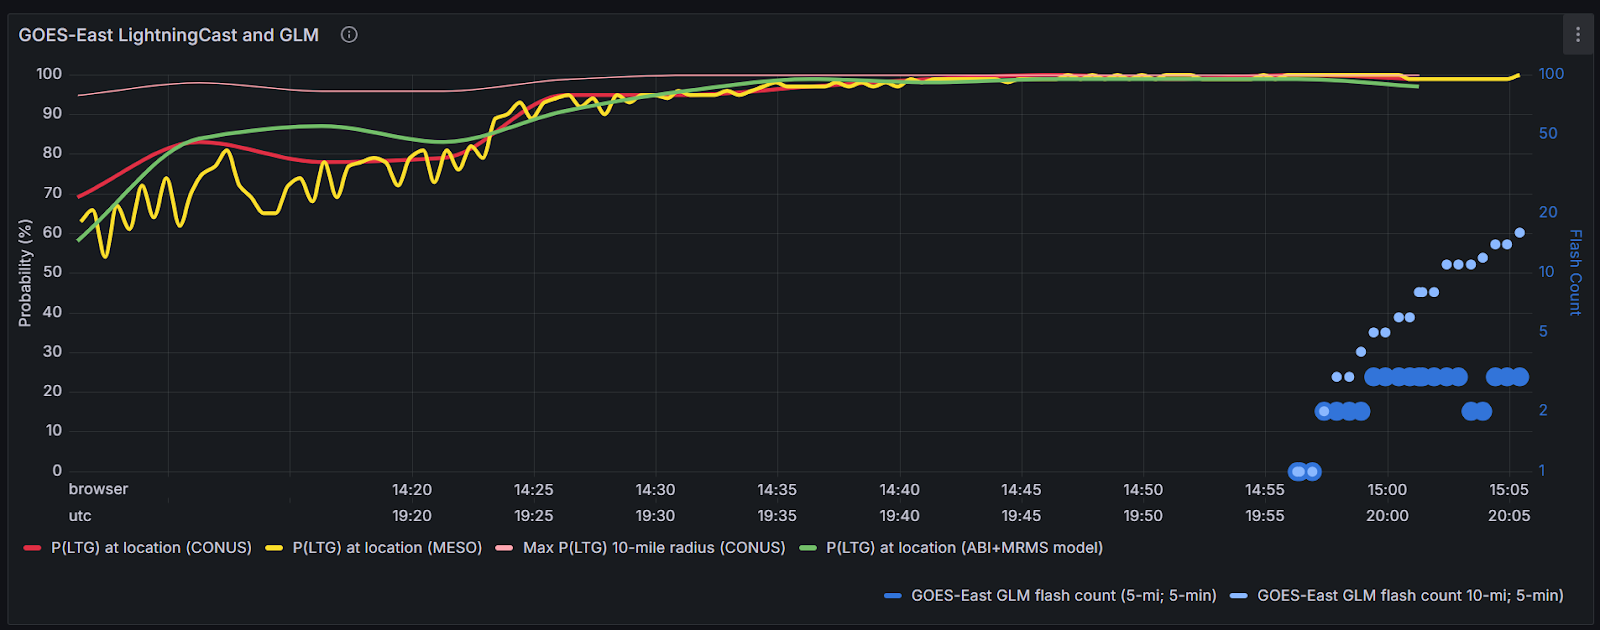
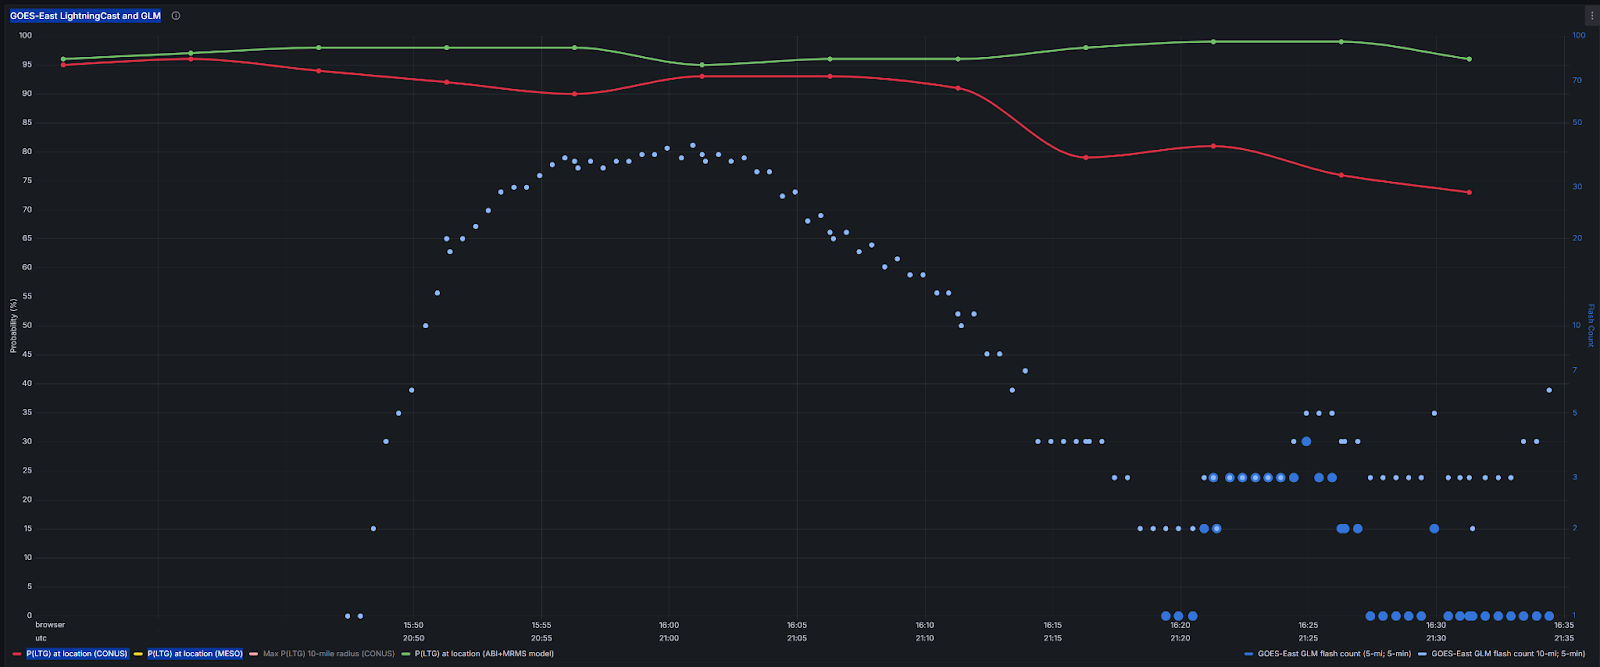
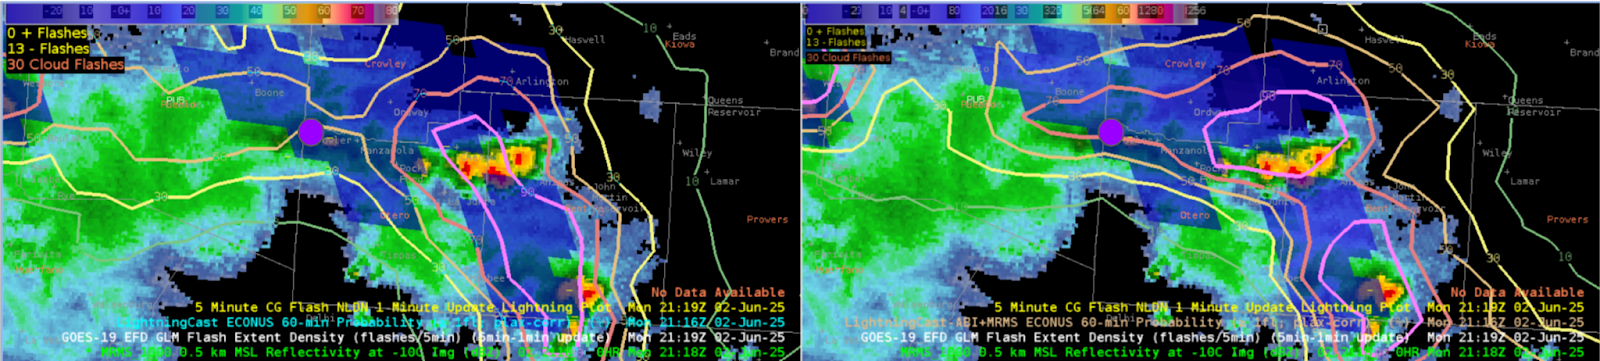
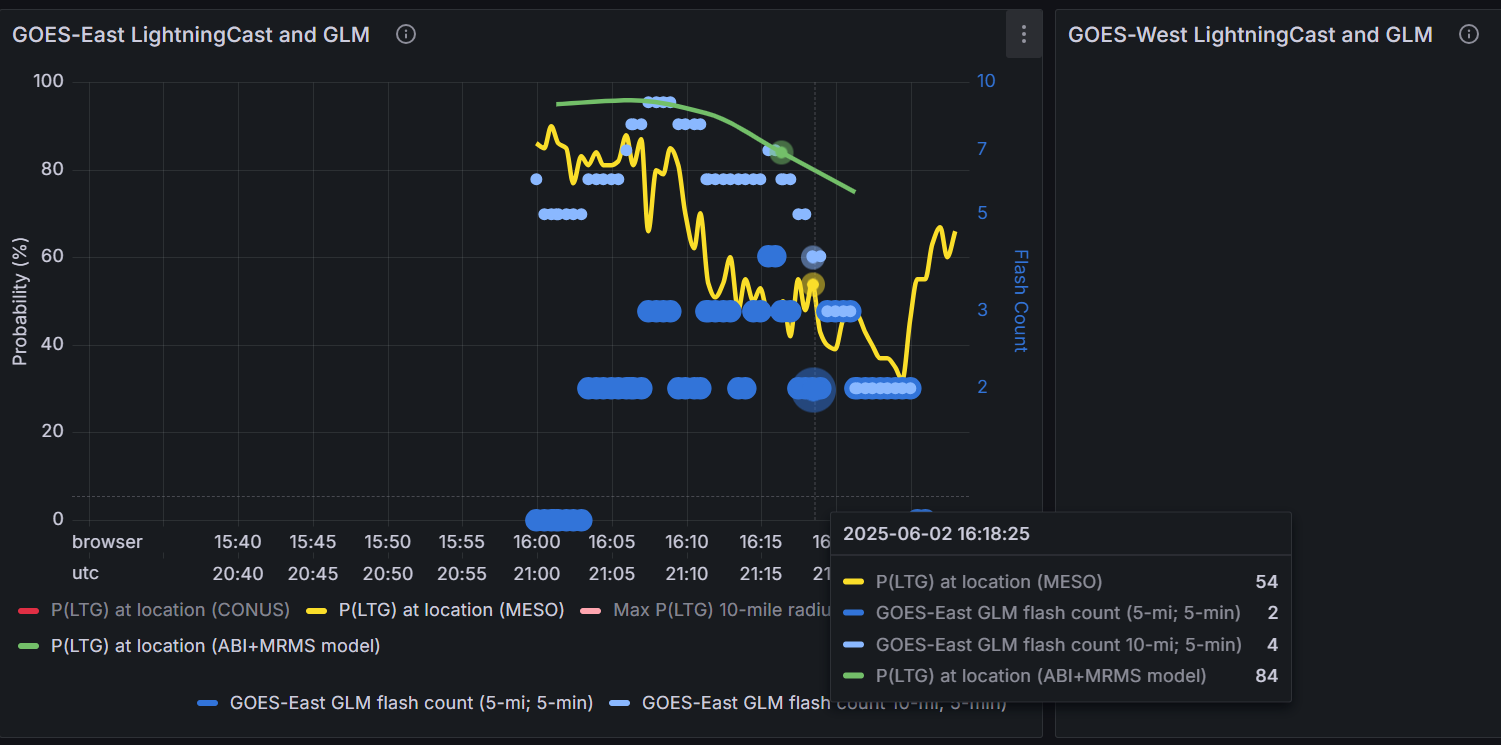
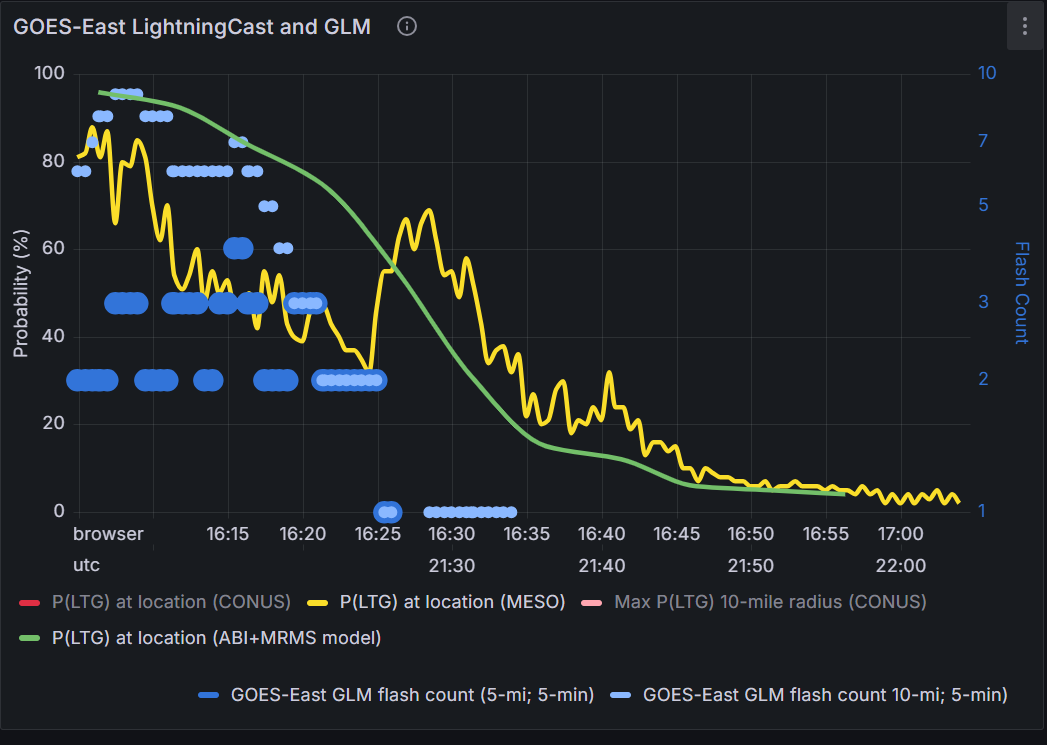
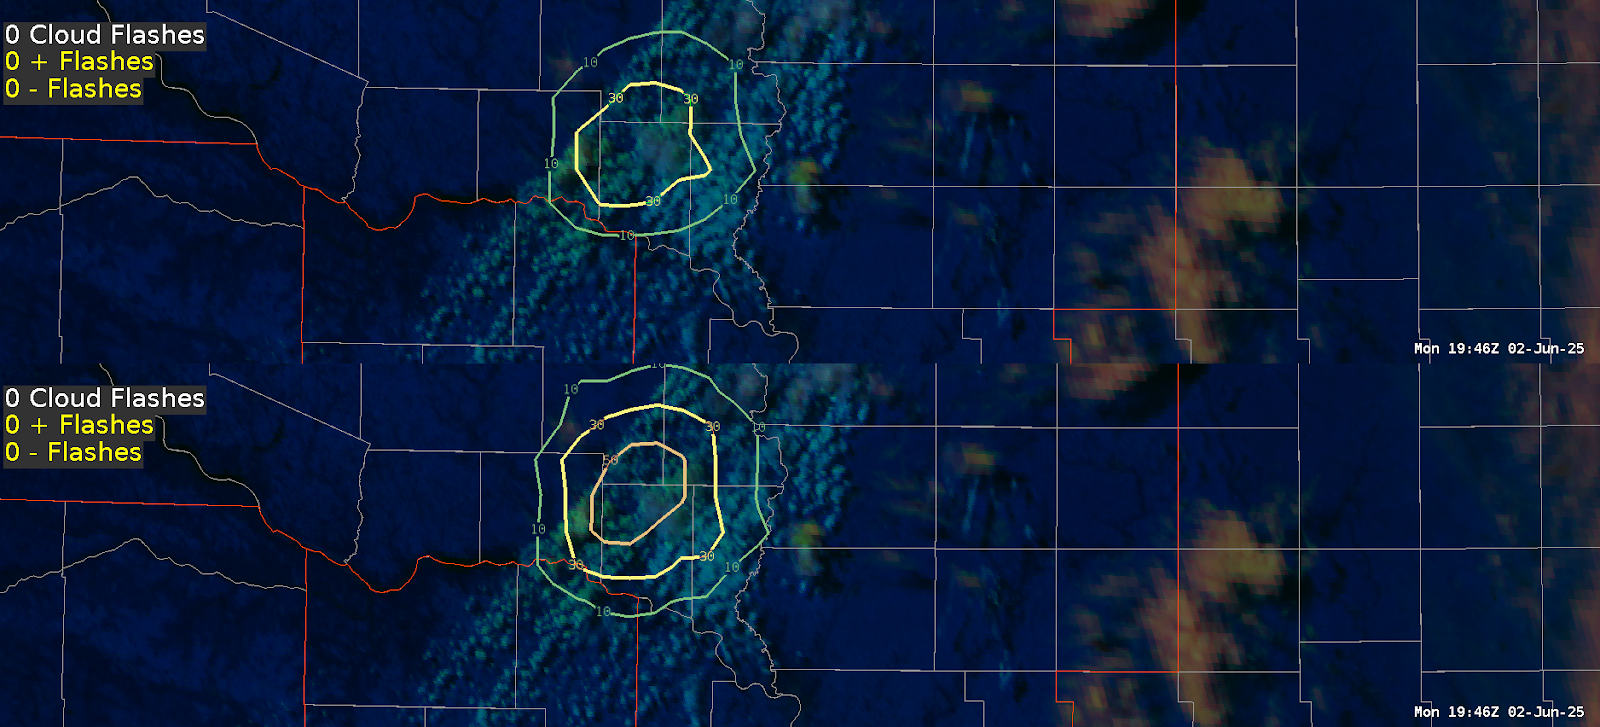
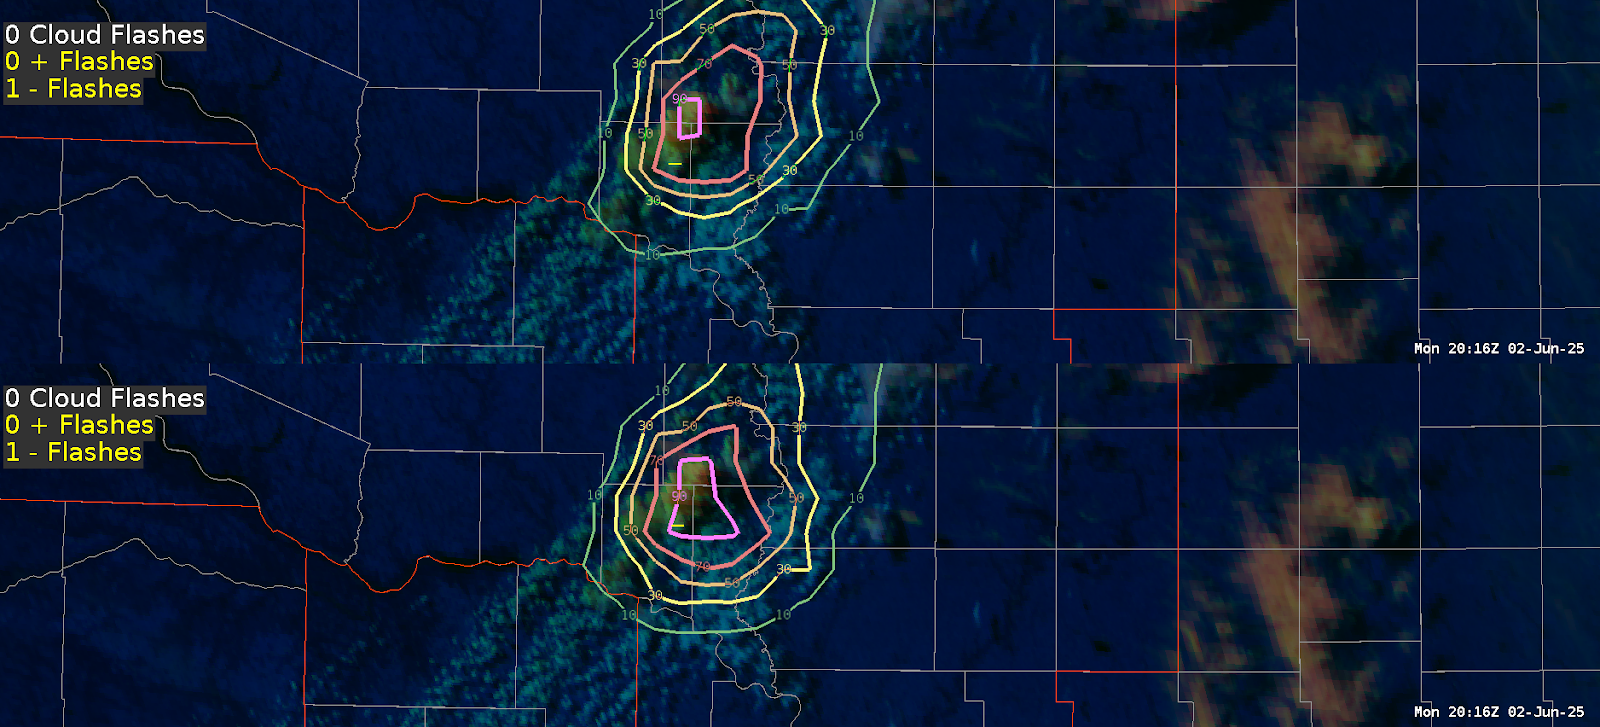
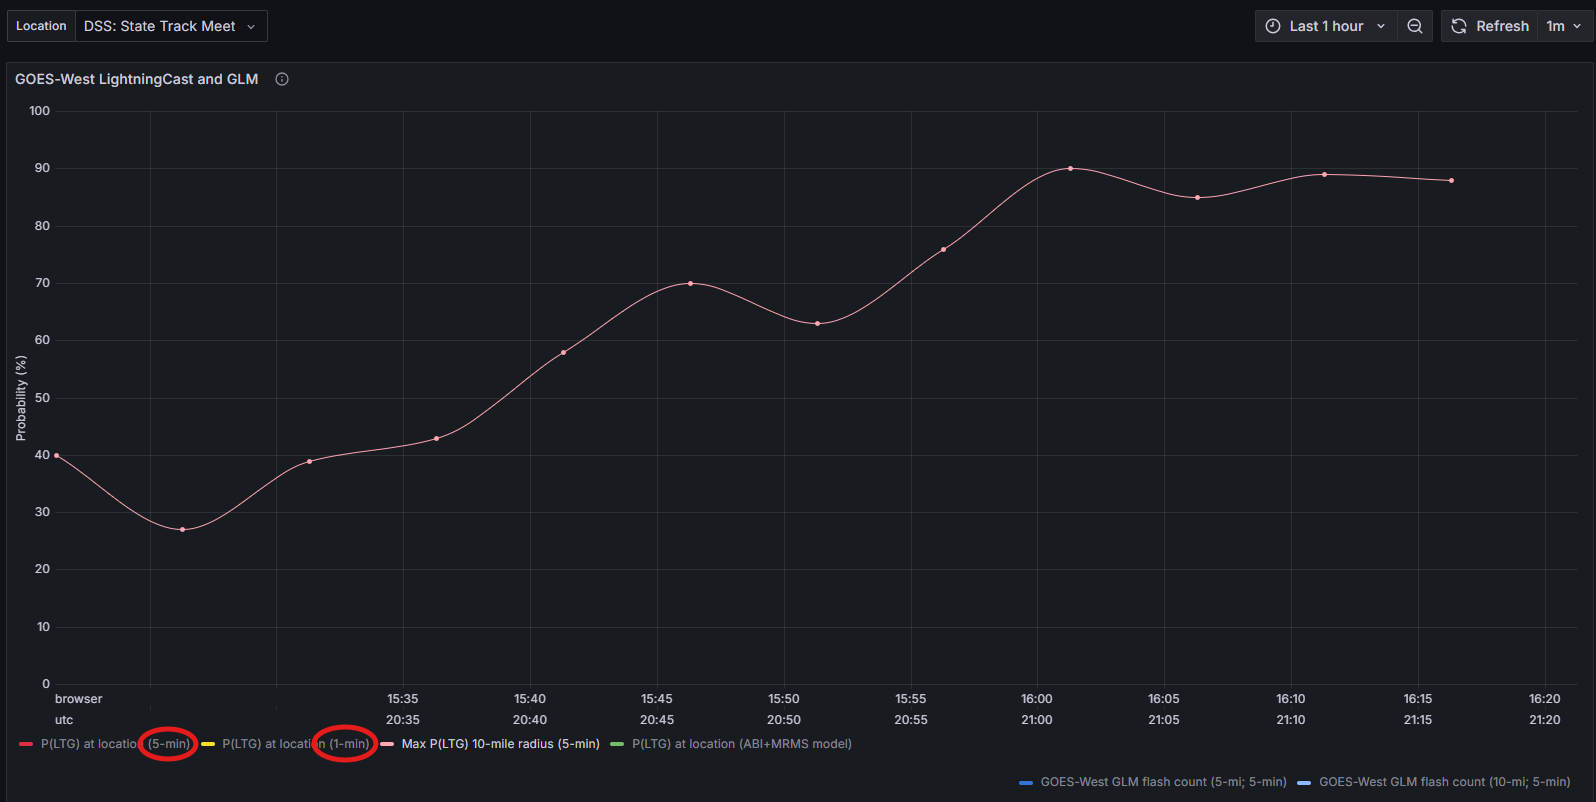
LightningCast was very useful picking out developing updrafts and embedded updrafts within broader areas of convection. We used this product to gauge which updrafts had the greatest potential to become severe in the near term. A strong uptick in lightning would indicate a rapidly strengthening updraft which would warrant further interrogation.

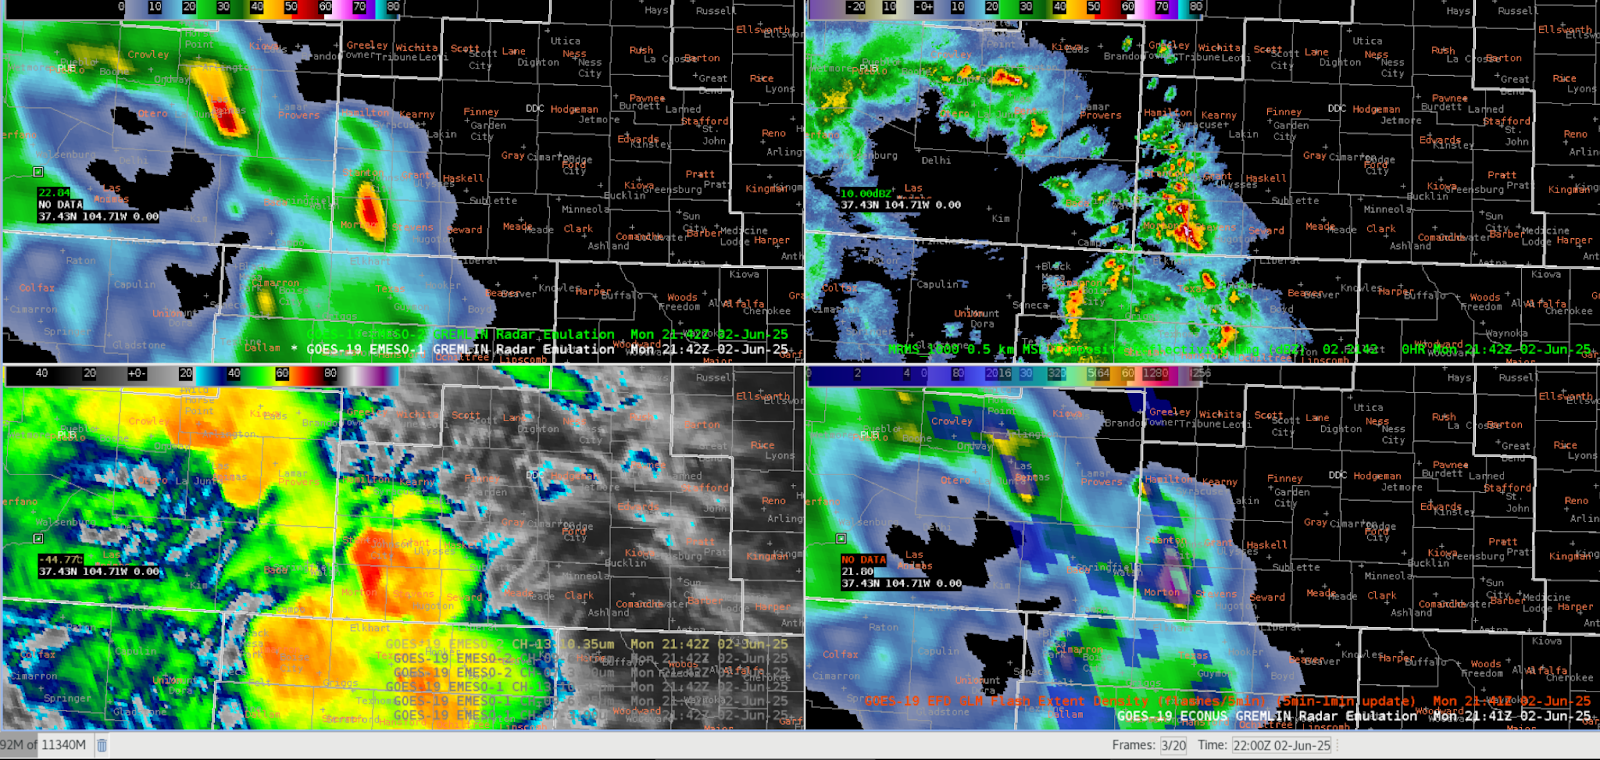
Similar to LightningCast, OCTANE was useful in determining which updrafts were trending towards severe. While in the mesoanalyst role, I would check to see which updrafts looked most intense (warmer colors paired with a very bubbly/convective appearance) and showed strong divergence. Radar analysis would then help us determine which individual cells to warn on, especially if the area of convection is multicellular and warning the entire thing isn’t ideal.

I didn’t use GREMLIN as much, since this area had good radar coverage. However, I did use it to keep tabs on its performance. The product seems to do well with picking out the strongest discrete/semi-discrete cells and potentially struggles with smaller/shallower storms and mergers.

Using these products, and working as a team with good communication, we were able to successfully warn a tornado in the Norman area along with various severe wind and hail.

– WxAnt

Tags: None

ICT Convection with Octane and LightningCast

 LightningCast

The LightningCast contours didn’t provide much insight due to high probability (>90%) of lightning pretty much the entire event. However we were able to utilize the dashboard for a DSS event. In Figure 1 below, the first thing I noticed was that the first lightning flash was recognized at approximately 2:57PM CDT where both v1 and v2 showed 90-100% probabilities. Looking back within the past hour at around 2:05 PM (not shown in the image), probabilities of lightning occurring within the next hour were approximately in the 50-60% range. It makes sense that the probabilities would increase with shorter lead times, however if this were being utilized for a DSS event and a partner was briefed at 2:05pm, they might decide to take a risk and hold off on sheltering since the probability is only 55% (therefore giving them a 50/50 chance in their eyes). Whereas around 2:20 PM when the probabilities started increasing to 80+%, there was only about a 30 minute lead time at that point. So the DSS events that require additional lead time due to further sheltering options or larger crowds may not be able to fully shelter by the time the first lightning flash occurs.

All that to say, I really like the utilization of this dashboard, however it would need to be used with additional tools (satellite, radar, etc.) in order to provide the most accurate information.

Figure 1: LightningCast Dashboard

Another item that was pointed out was that in Figure 2 below, you can see that the probabilities in v1 (red line) start to decrease around 4:10pm whereas v2 (green) remains above 95%. This could be due to the fact that maybe there were warming cloud tops, however with the ongoing lightning flashes in the vicinity, v2 would be the more reliable tool in my opinion

Figure 2: LightningCast Dashboard

Octane

The first cell that caught our attention was the cell in southwest Butler County. Figure 3 below shows the cloud top cooling and cloud top divergence (top right and bottom two panels), and you can see that cell shoot up with decent divergence aloft. We didn’t end up warning on it since radar looked pretty subsevere, however it was a good situational awareness tool to keep an eye on where the stronger storms were located.

Figure 3: Octane four panel

Later in the period, we did end up issuing two different warnings. The gif below (Figure 4) honestly doesn’t do it justice since I grabbed it a little too late, but there was a pretty pronounced divergence signature that started in Harper County near the city of Anthony that later pushed east into Sumner county. With the divergence remaining consistent and radar showing a pretty good wind signature, we ended up issuing a warning.

Figure 4: Octane four panel

I messed around with the colortables a little bit in Octane, switching to a stoplight color scale for the divergence and the magenta hue for the cooling. I’m still not fully sure which colorscale I prefer, so I’ll need to continue playing with both. However, comparing the three smoothing techniques for the divergence, I found myself looking at the highest smoothing (bottom right panel) more frequently since the lowest smoothing (top right panel) often looked too noisy. I think for situational awareness and assessing which storms to dive deeper into, the highest smoothing should work well.

-Fropa

Tags: None

PUB LightningCast and GREMLIN Nowcasting

LightningCast

For this first day, I started out looking at Lightning Cast to gain familiarity with version 2 and see how it compares to version 1. The first thing I noticed was in southwest Pueblo County, where there seemed to be fairly frequent lightning. Version 1 in the top left panel (Figure 1 below) actually decreased in probability from 70% to 50%, whereas Version 2 in the top right panel remained at 70%. With both GLM and ENTLN depicting ongoing lightning, I think both versions should be showing higher probabilities. I’m wondering if it’s because both versions are so focused on the convection moving into southeast Pueblo County that they’re less focused on the stratiform lightning/less mature convection?

Figure 1: Four panel comparing LightningCast v1 (left panels) and LightningCast v2 (right panels)

Additionally, I tested out using the LightningCast dashboard for Fowler, CO beginning at 3PM MDT. One interesting thing to note was that it seemed to match better with the version 2 LightningCast in AWIPS versus with version 1, however both versions weren’t too far off. In the Figure 2 below, the left panel (version 1) shows between 30-50% probability of lightning, whereas the right panel (version 2) shows Fowler (purple dot in the image)  right on the border of the 70% probability. Comparing that to the dashboard (Figure 3) for the same time, the yellow line (version 1) depicts a 54% probability, with the green line (version 2) showing an 84% probability for 21:18Z. With MRMS reflectivity at the -10C level showing a cell up to 42 dBz just southeast of Fowler, I would tend to lean towards utilizing version 2.

Figure 2: LightningCast v1 (left panel) and LightningCast v2 (right panel)

Figure 3: LightningCast Dashboard

One final note on the LightningCast Dashboard – I thought it was interesting to see that version 1 in Figure 4 below, the yellow line (version 1) shows two separate upticks in lightning probability versus the green line (version 2) showing a steady decline in probability.

Figure 4: LightningCast Dashboard

GREMLIN

I was also able to look at GREMLIN, which was my first time assessing this product. Figure 5 below shows a four-panel, with GREMLIN (top left), MRMS Reflectivity (top right), Satellite IR sandwich (bottom left), and GLM Flash Extent Density (bottom right). Just looking at MRMS and IR, the first cell that draws my attention is the cell in southeast Pueblo County as it has higher reflectivities and cooler cloud tops. The cell in southern Otero county looks like the cloud tops are slightly warming with time. However once we start looking at GREMLIN, those two cells look to go back and forth in reflectivity, leading to less confidence in overall intensity. If I were located in an area with poor radar coverage, or if a radar was down and I had to rely on GREMLIN, it may not be straightforward as to which cell could eventually warrant a warning.

Figure 5: Four Panel comparing GREMLIN (top left), MRMS Reflectivity (top right), Satellite IR Sandwich (bottom left), and GLM (bottom right).

That being said, Figure 6 below shows a screenshot of the same four-panel at 21:41Z, which shows GREMLIN having a pretty good grasp on the convection in Stanton and Morton counties (just outside of the PUB CWA). So in this instance, confidence in the GREMLIN product would at least be higher than the previous example shown.

Figure 6: Four Panel comparing GREMLIN (top left), MRMS Reflectivity (top right), Satellite IR Sandwich (bottom left), and GLM (bottom right).

Final Thoughts for Day 1

Overall I enjoyed testing out both of these products. I definitely want to get more hands-on experience with GREMLIN as well as the LightningCast dashboard in order to see these in different scenarios/environments.

– Fropa

Tags: None

LightningCast for Convective Initiation and IDSS

LightningCast V2 did a great job predicting lighting development with developing convection along a frontal boundary in northwest Iowa. It outperformed version 1, as shown by the loop and images below.

Animated GIF showing LightningCast V1 (top) and V2 (bottom) with the day cloud phase darkened to show detail. The ENI total lighting (yellow CTG flashes, white cloud flashes) is also displayed.

At 1946Z, V2 has a higher probability of lightning (50%) than V1 (30%).

This trend continued throughout, and at 2016Z the first lighting strike was detected. That’s 30 minutes of lead time, which would be helpful for outdoor event IDSS.

LightningCast at 2016Z with initial cloud to ground strike shown in the yellow dash.

– Updraft

Tags: None

GREMLIN and Lightning Cast – Observational Notes and Feedback

SYNOPSIS – A broken line of thunderstorms lifted north through SE Colorado in a weakly sheared, high LCL environment with modest instability (1000-2000j/kg MUCAPE) and high DCAPE (1000+ j/kg). This environment appears to favor pulse severe potential, with primarily a gusty/damaging wind risk.

OPERATIONAL NOTES AND FEEDBACK – Using GREMLIN and Lightning Cast Together

I used a 4-panel to compare GREMLIN, satellite, radar, MRMS, and LTG Cast data. I’ve not typically used LTG Cast to nowcast the severity of convection, but when combined with GREMLIN, it kind of reminds me of looking for signals in model data. For the most sustained convection, for example, GREMLIN had a fairly consistent signal of 40-50dBZ echoes in tandem with consistently high LTG probabilities. In the past, I’ve typically just focused on GLM lightning data on its own separate from LTG probs. Overlaying LTG Cast probs with GLM data seems to provide a more uniform / smoothed view of the evolution of lightning within convection as opposed to using GLM on its own. GLM can be jumpy at times, which can give the impression that a thunderstorm is weakening. However, if LTG cast probabilities remain high, it may give the forecaster more confidence that a thunderstorm is not weakening. This seemed to be the case with multiple different thunderstorms in SE CO today.

OPERATIONAL NOTES AND FEEDBACK – GREMLIN

It was interesting to note how closely the increase and decrease in GREMLIN reflectivity was tied to the increase and decrease in lightning. The developers noted that this is to be expected. Since GLM data can sometimes be jumpy, and isn’t always reflective of the severity of a storm at a given moment in time, it might be interesting to see if there is a way to offset this. Perhaps there is some way to mesh GLM data with Lightning Cast data (reference the notes in the observation section about nowcasting convective strengths) or through some other means (longer averaging time, etc.). When GLM data isn’t jumpy, GREMLIN seemed to compare very nicely with MRMS. But, when GLM data was jumpy, GREMLIN seemed to struggle some, showing more rapid increases and decreases in reflectivity that what MRMS showed. As an alternative, I could see where simply overlaying LightningCast data on top of GREMLIN data could provide a more “smoothed” and uniform trend in convection over time, in a way that could still provide useful information for warning decisions.

From an operations standpoint, GREMLIN seemed to provide a great overview of convective evolution, especially when overlaid with LightningCast data. It’s possible this could translate to warning decisions, but this initial runthrough with the product suggests its biggest advantage may be nowcasting the general evolution of convection as opposed to making specific warning decisions. Admittedly this is my first use of the product, and I’m looking forward to trying it in future days of the HWT to see if anything different stands out.

– NW Flow

Tags: None

DSS LightningCast Dashboard

GOES-East LightningCast for DSS event in CYS CWA


GOES-West LightningCast for same DSS event in CYS CWA over same time period

When using the DSS event/stadium GLM dashboard on the web, with an event that is located in the CYS CWA in the mid-CONUS, there was a significant difference in the probability of lightning from GOES-West compared to GOES-East. The GOES-West data was ultimately better and more reflective of actual lightning trends in that area, despite GOES-East  having two mesosectors located over the point in question.

Top panel, LightningCast version 1. Bottom panel, LightningCast version 2.

Meanwhile, in a different area (BOU), comparing LightningCast v1 to v2, it appears that v1 does better in areas with poor radar coverage, while v2 does better in areas with better radar coverage.  In the image above, version 1 has a better handle on the isolated first GLM pixel (50%) than version 2 (10%). Meanwhile, the more robust lightning area is more accurately represented on version 2 (which happens to have better radar coverage) compared to version 1.

– prob30

Tags: None

Filling in LightningCast Contours in AWIPS

TFX was focused on DSS messaging since it became evident fairly early on in the day that we were not expecting severe convection. The event we had was a State Track Meet with a range ring of 10 miles. Since there were a lot of contours to look at, our group decided to load them as an image and play around with the fill value of the LightningCast probabilities for easier visualization of imminent lightning threat for our partners. To do this, we loaded LightningCast as an image, went into the Change Colors option of the Img LightningCast and set the 10/30/50/70/90 thresholds to match with the colors, including setting 0-10% as transparent. Then we overlaid MRMS on top of it and set everything below 20 dbZ to transparent so we didn’t get any noise from the light showers since we were more focused on the thunderstorms with higher dBZs.

Initial attempt at filling in the LightningCast contours.

Later on in the day, we settled on a less opaque version of the colorbars and we were able to save them such that others in the TFX group could use them on the AWIPS user account as “LightningCastFilled”. This allowed the reflectivity above 20dBZ to stand out more so partners knew where the heaviest rain was without it blending into the bright filled LightningCast.

Final decision on the colormap filling in the LightningCast contours overlaid with MRMS composite reflectivity above 20 dBZ.

Our group members also noticed the default Max and Min for both versions of LightningCast (when loaded as an image) were originally set in AWIPS to random numbers like -20 and 113. Version 1’s default range was different than Version 2’s which added to the visual discrepancy. Before we figured this out, the contours and images did not match up in space (i.e. the image went outside the contour for the same value), but turning on samples revealed they were the same value. In theory, these should be set to 0 and 100 given that LightningCast is a probability. Once we changed these values on the LightningCast Img product in AWIPS to be set to a range of 0 to 100 and reset the colorbar levels according to this scale, they matched up perfectly with the contours. Our suggestion for developers was to ensure the default for these is 0 to 100 in AWIPS if they were ever to be loaded as an image.

Tags: None

LightningCast Dashboard

One of the more useful features for DSS messaging today was the Dashboard Request Form for values at our State Track Meet. Since we were operating under the assumption that the go or no-go threshold for this event was lightning within 10 miles, I liked using the dashboard but isolating the Max P 10-mile radius line in pink.

One note of feedback I had was to add some context for what we’re looking in each line at by noting where the data comes from in the legend. I was able to verbally ask a visiting scientist exactly what each line meant and where the data comes from, but this may not always be an option. The suggestion we came up with was adding (5-min, CONUS) and (1-min, MESO) to the legends circled in red so that it’s clear that the 5 minute data came from the CONUS satellite and the 1 minute data comes from one of the mesosectors.

– millibar

Tags: None

Lightning Cast Differences With Pulsing Convection

A weak line of thunderstorms developed and moved into the southern portion of Great Falls, Montana CWA (WFO TFX). Based on MRMS, the storms appeared to be weakening with MRMS and lightningcast V2 began to lower probabilities of lightning quicker than V1. However, slightly after the lightning decreased in V2, both versions increased probabilities of lightning within the next hour to above 90%. Maybe V1 does better with pulsing storms or maybe it was just a single case scenario where V2 dropped in probabilities during what it believed was decaying convection, when in reality it was pulse-like convection.

– Aurora Borealis

Tags: None

Lightning Cast: Real-Time Monitoring for DSS

The LightningCast Dashboard is an excellent tool to monitor and predict the probability of lightning at a point, which allows us to easily provide decision support services (DSS) for outdoor events.

Here’s an example from today for the Clown Rodeo on the south side of Lubbock, TX:

Notice the LightningCast probabilities for both the ABI and ABI + MRMS generally remained between 0 to 20% during the duration of the event.

These probabilities were associated with developing cumulus clouds in the area, which can be seen in the Day Cloud Phase Distinction RGB:

Typically, if a meteorologist sees developing cumulus similar to shown above in the Day Cloud Phase Distinction RGB, this would result in an increasing concern for lightning at that location. However, it is challenging to quantify this concern and message it probabilistically to our partners. LightningCast gave us confidence to message our partners there is a low probability (10 to 20%) of any lightning strikes within the next hour.

-Vrot

Tags: None