Lightning Jump Field Test: Data Collection Update

Data collection is still ongoing with back-ups moved to tape daily.  (If anyone is interested in analyzing a particular day just let me know!)

Here is a summary of activity in the LMA domains since the last update:

10 July 2012:  NALMA, [SHAVE available] 1700-2330 UTC; OKLMA 2200 UTC {SHAVE null case}

12 July 2012:  COLMA (DC3 domain) [SHAVE available] 2000-2300 UTC;  FL-LDAR [SHAVE available] 1800-2000 UTC

14 July 2012: OKLMA (range questionable) 2100-0130 UTC

15 July 2012:  DCLMA (range questionable) 1900-0000 UTC

16 July 2012: NALMA [SHAVE available] 2100-0000 UTC; WTLMA [SHAVE available, 1 storm, null case] 2230 UTC

17 July 2012: NALMA [SHAVE available, 3 storms] 1900-2300 UTC; COLMA [SHAVE available, 1 storm, null case] 2100 UTC

18 July 2012: DCLMA [SHAVE available, 6 storms] 1600-0000 UTC; NALMA [SHAVE available, 3 storms, null & non-svr] 1800-0100 UTC, FL-LDAR 2230-2330 UTC

19 July 2012: NALMA [SHAVE available, 1 storm, full swath] 2230-0130 UTC; DCLMA [SHAVE available, 3 storms, null & non-svr] 2100-0000 UTC

20 July 2012:  NALMA [SHAVE available, 1 storm, null case] 2200-2300; OKLMA [SHAVE available, 1 storm, null case] 2030-2130

22 July 2012: FL-LDAR 1800-2000 UTC

23 July 2012:  DCLMA [SHAVE available, 4 storms] 1900-2100 UTC

24 July 2012:  DCLMA [SHAVE available, 6 storms] 1500-2200 UTC

25 July 2012:  COLMA [SHAVE available, 2 storms, non-svr] 1900-0000 UTC

26 July 2012:  DCLMA [SHAVE available, 4 storms] 2200-0230 UTC; OKLMA [SHAVE available, 2 storms, non-svr] 2030-2300 UTC

27 July 2012:  NALMA [SHAVE available, 4 storms] 2000-2300 UTC

28 July 2012: DCLMA [SHAVE available, 5 storms] 2000-0100 UTC

29 July 2012: COLMA (questionable range) ~2300 UTC

30 July 2012: COLMA [SHAVE available, 2 storms] 2200-0100 UTC; NALMA 0400-0800 UTC (31 July); FL-LDAR [SHAVE available, 1 storm, null case] 2125 UTC

31 July 2012:  DCLMA 1600-2200 UTC; NALMA 1630-1730 UTC

1 Aug 2012:  DCLMA [SHAVE available, 4 storms] 1800-0100 UTC; NALMA [SHAVE available, 3 storms] 2100-0100 UTC

[SHAVE data collection currently unknown for August, to be updated later]

2 Aug 2012: NALMA 1900-2100 UTC; COLMA 0000-0100 UTC

3 Aug 2012: DCLMA 1900-2200 UTC

5 Aug 2012: DCLMA 1700-2300 UTC

7 Aug 2012: OKLMA 2000-0100 UTC, DCLMA 2130-2230 UTC

8 Aug 2012: FL-LDAR 2130-2230 UTC; OKLMA (range questionable) 2130-0030 UTC

9 Aug 2012:  DCLMA 1700-0000 UTC; NALMA 1600-1730 UTC

10 Aug 2012:  DCLMA 2130-0100 UTC; NALMA 2000-2300 UTC

13 Aug 2012: NALMA 1630-1800 UTC

14 Aug 2012: DCLMA 1900-0300 UTC

15 Aug 2012: DCLMA 2000-2200 UTC

Tags: None

Lightning Jump Field Test: Status/SHAVE data update

SHAVE students are currently working to compile the data for each particular day, but here is the summary of SHAVE data collected in each network (using a range of roughly ~200km from center) so far for the experiment:

CO: 195 (0 wind-related reports)
DC: 1971 (413 wind-related reports)
AL: 881 (130 wind-related reports)
FL: 432 (10 wind-related reports)
OK: 1951 (402 wind-related reports)
SWOK: 20 (1 wind-related report)
WTX: 162 (0 wind-related reports)
note: OK/SWOK and WTX/SWOK could have overlapping reports.

The range was expanded for SHAVE data collection so the status of storms entering / leaving the official network area (e.g., “lightning jump range”) could be known.

—————

Summary of data collection June 2012- current:

1-2 June 2012: DCLMA, 1800-0000 UTC; WTLMA/OKLMA, 2300-0200 UTC

2-3 June 2012: COLMA, 2000-2300 UTC;  OKLMA/WTLMA, 2300-0800 UTC

3-4 June 2012: NALMA, 0300-0600 UTC; OKLMA/WTLMA, 0100-0400 UTC; DCLMA 2300-0100 UTC

4-5 June 2012: WTLMA/OKLMA, 2100-0300 UTC

6 June 2012: COLMA, 2300-0300 UTC (questionable range); WTLMA, 1300-0000 UTC

7-8 June 2012: COLMA, 2200-0500 UTC

10-11 June 2012: FL-LDAR, 0000-0100 UTC

11-12 June 2012: NALMA, 2200-0100 UTC; OKLMA 0200-0600 UTC (questionable range)

12-13 June 2012: WTLMA, 0100-0800 UTC

14-15 June 2012: WTLMA, 2300-0400 UTC;

15-16 June 2012: WTLMA, 0200-0800 UTC;  COLMA, 1900-0200 UTC

16-17 June 2012: WTLMA/OKLMA, 2100-0400 UTC (late might be at questionable range)

22-23 June 2012: DCLMA, 1900-0100 UTC; COLMA, 0100-0300 UTC

24-25 June 2012: FL-LDAR, 0000-0400; DCLMA, 1900-2000 & 0300-0500 UTC

25 June 2012: DCLMA, 1600-1800 UTC

27 June 2012: COLMA, 2100-2300 UTC

28-29 June 2012: DCLMA, 2300-0900 UTC

29-30 June 2012: DCLMA, 2300-0400 UTC

30 June 2012: DCLMA, 2200-0100 UTC

1-2 July 2012: NALMA, 1900-0200 UTC

2 July 2012: NALMA, 2200-0000UTC, possibly out of range, over OHX forecast office.

3 July 2012: DCLMA, 2200-0100 UTC

4-5 July 2012: DCLMA, 2000-0800 UTC,

5-6 July 2012: NALMA 2000-0500 UTC,  DCLMA 2200-0000 UTC

6 July 2012: NALMA, 1800-2000 UTC, SHAVE data collected

8-9 July 2012:  DCLMA, 1800-0500 UTC

Tags: None

Lightning Jump Data Collection Summary: 31 May 2012

An earlier post summarized the first month and half of data collection, the details below will bring us through the end of May.

Note: All times are approximate to include timing of any severe or marginally severe weather in the domains.  Re-processing and analysis should start prior to first time listed here. SHAVE details are included for dates that I personally know they collected data over the domain.  Dates without “SHAVE ops” listed may also have SHAVE data, please check directly with Kiel Ortega if you need it for analysis.

17 May 2012: FL-LDAR, 2230 UTC – 0100 UTC (18 May), SHAVE operational

19 May 2012: OKLMA, 2200 -0800 UTC, SHAVE ops in OK domain

20 May 2012: OKLMA (maybe, on edge of 3d); 2100 – 2230 UTC

24 May 2012:  DCLMA, SHAVE ops in NWS Sterling, VA (LWX) County Warning Area (CWA)

25 May 2012: OKLMA (maybe, on edge of 3d); 2300-0200 UTC

27 May 2012: DCLMA, 2340-0200 UTC

28 May 2012: OKLMA, 2200-0300 UTC

29 May 2012: DCLMA, 1820-2230 UTC; OKLMA, 1900-1130 UTC; NALMA (2330-0300 UTC); SHAVE ops in LWX and OUN CWAs.

30 May 2012:  WTLMA & OKLMA, 2100-0400 UTC. SHAVE ops in OUN CWA

31 May 2012:  NALMA likely. SHAVE ops planned over area. (edit, 5:35 CDT: FL-LDAR domain has had activity &  jumps today)

-K. Calhoun

FL-LDAR domain: Lightning Jumps & HWT 3DVAR and Tor Warnings

Lightning activity has been prevalent in the FL-LDAR domain today and the ltg jump alg has detected multiple jumps in range of the domain.  Scale_0 seems to be the most stable at keeping the storms ID’s unique while scale_1 seems to be dealing with lots of mergers/splits.

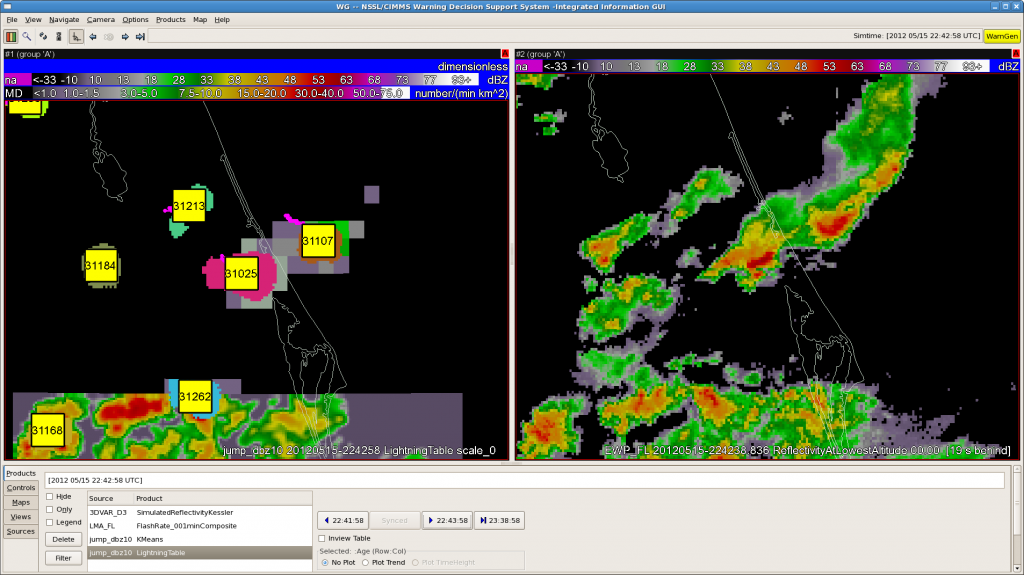
In the past half hour (2230-2300 UTC) at least 3 jumps have been detected at scale_0:  cell IDs: 31025 @ 2242 UTC, 31107 @ 2245 UTC, and 31184 @ 2248 UTC (additional jumps likely occurred prior to this time).

Storm clusters at scale_0 at 2242 UTC. Cell 31025 was the primary storm of interest in the testbed.

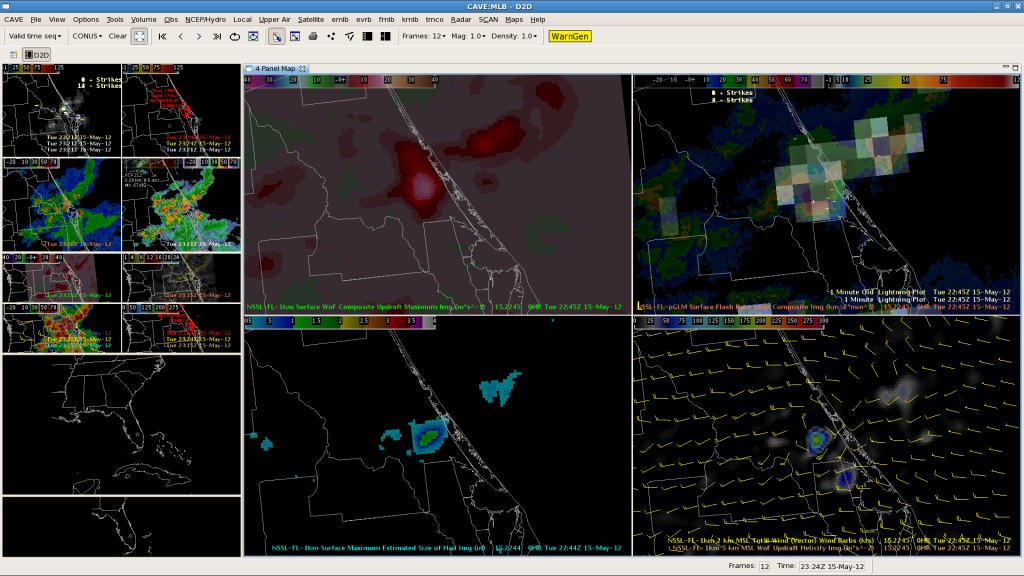
The main cell of interest for forecasters in the HWT operating in the MLB domain has been #31025.  3DVAR products depicted increases in max updraft and vorticity as early as 2230 when the domain was re-centered over the storm.  The storm maintained its strength through over the next half hour and the forecaster opted to continue the warning at 2256 UTC (the first TOR warning issued in the HWT was at 2225 UTC, see the forecaster post associated with these warnings for more info).  The screenshots below from AWIPS2 include lightning, 3DVAR, MRMS & KMLB radar data for this event:

AWIPS2 screenshot 2245 UTC. Top left: 3DVAR max updraft composite; Top right: MRMS Refl @-10C, pGLM lightning flash extent density, & 1-min NLDN CG data; bottom left: MRMS MESH; bottom right: 3DVAR updraft helicity and 2 km winds

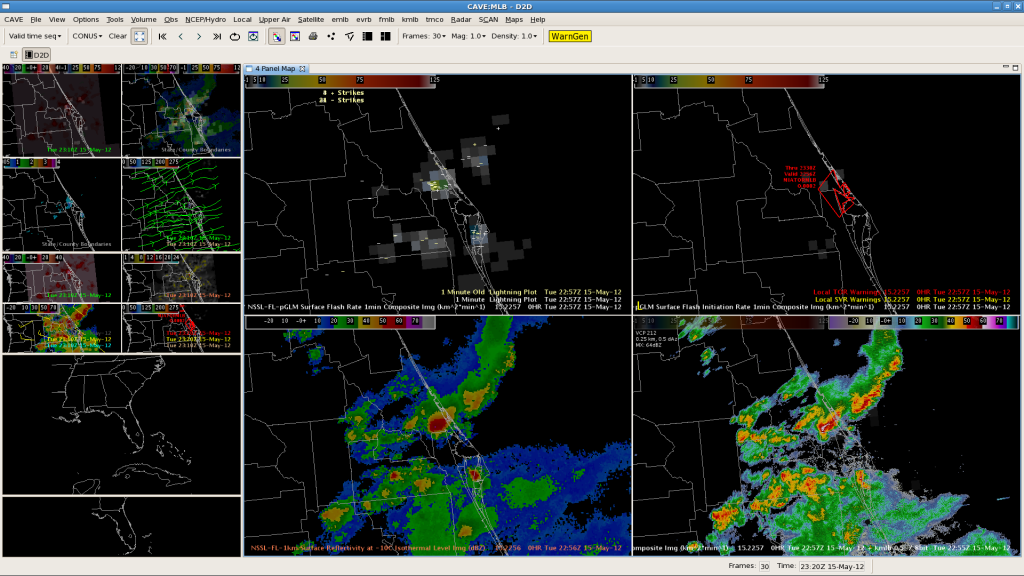
At the time the tor warning was issued in the HWT:

AWIPS2 screenshot.
AWIPS2 screenshot @2257 UTC: Top left: pGLM flash extent density and 1-min NLDN CG data; top right: pGLM flash initiations & Tor warning; bottom left: refl @-10C; bottom right: KMLB 0.5 deg refl

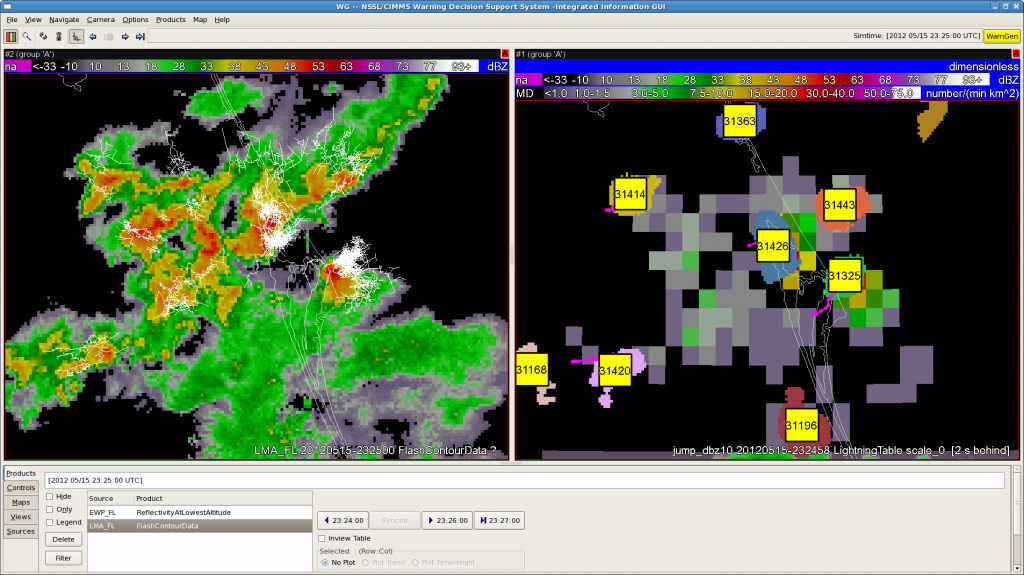
Even as the clusters have become a bit more muddled, the storm tracking algorithm has seemed to maintain a good handle on individual clusters at scale_0, though some of the cell ID’s have changed…

WDSSII image at 2324 UTC: Left: Refl at lowest altitude and lightning flash contours; right: scale_0 storm clusters overlaid on pGLM flash extent density.

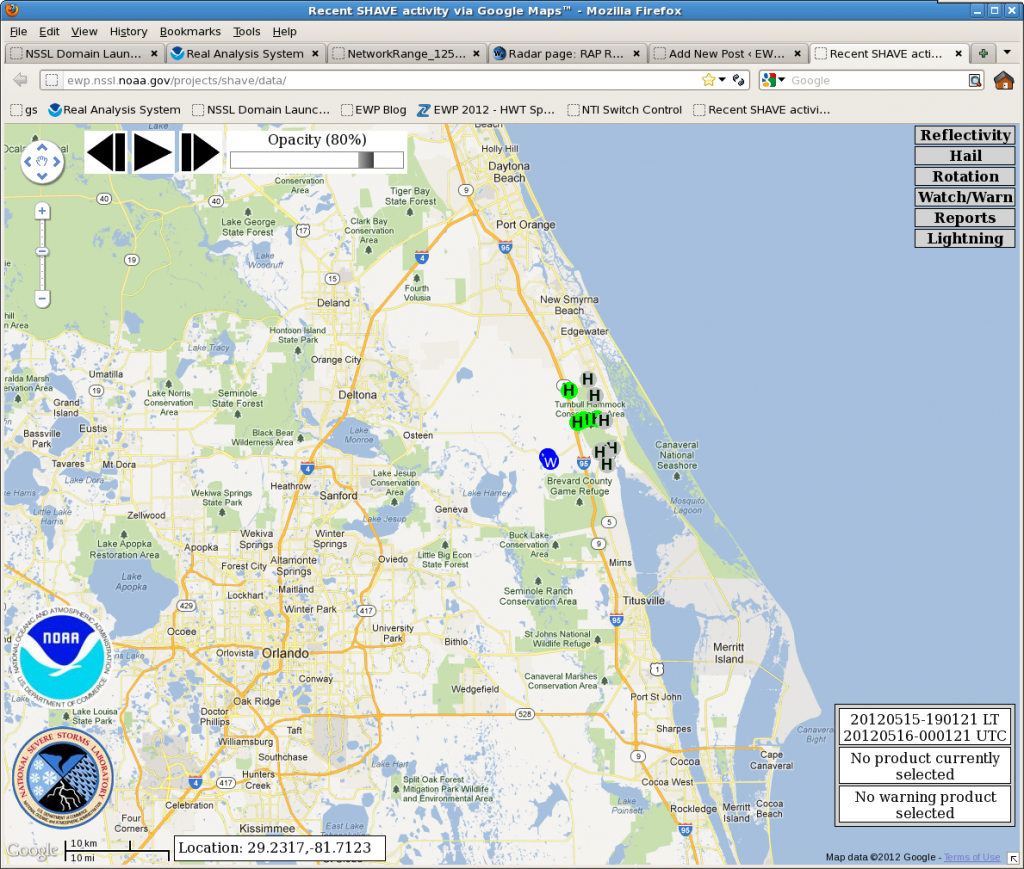
SHAVE is also operational today over this same area… current reports include 1 in hail and high wind:

SHAVE data between 2200 and 0000 UTC in the Kennedy Space Center domain. Gray H circles correspond to no hail, green H circles 1 in hail, and blue W circles severe wind. Reports include 1 in hail piled against side of house & dents to truck.

Technical difficulties of note: the KML images are not currently updating on the webpage, but should be back up in the next day or two; it is also possible that cron job notification of a python script stopped running mid-day on 2 May 2012 and data between 2 May and 14 May, may need to be reprocessed to assure that jumps occurred within the network range.

-K. Calhoun

Lightning Jump Project: Status Update & Summary (so far)

It has been unseasonably quiet in all of the LMA networks the past few days; unfortunately, the upcoming week does not look too promising either.  In the meantime, below is a summary of severe/near severe activity in any of the networks during the project so far including the date/time & corresponding networks…

Note: No systematic verification of jumps has been processed for any of the cases.

April:

4 Apr 2012 – NALMA: approx. 2300 UTC  (possibly out-of-range).

5-6 Apr 2012 – NALMA: 2300-0100 UTC.

9-10 Apr 2012 – WTLMA / OKLMA: 2100-0200 UTC (possibly out-of-range for both networks).

12 Apr 2012 – WTLMA: 0100-0500 UTC.

13-14 Apr 2012 – OKLMA: 1900-0500 UTC.

15 Apr 2012 – WTLMA: 0300-0500 (& 14 Apr OKLMA, 2100+ UTC, likely out-of-range)

17 Apr 2012 – NALMA: 1900-2100 UTC (possibly out-of-range)

20 Apr 2012  – WTLMA/OKLMA: 0000-0300 UTC

20 Apr 2012 – FL-LDAR: 1900-2300 UTC

22 Apr 2012 – FL-LDAR: 0700-0800 UTC.

25 Apr 2012 – WTLMA: 0000-0300 UTC (possibly out-of-range).

26 Apr 2012 – WTLMA: 2200-2300 UTC (possibly out-of-range).

27 Apr 2012 – NALMA: 0000-0100 UTC (possibly out-of-range).

29 Apr 2012 – WTLMA/OKLMA: 0000-0700 UTC.

29-30 Apr 2012 – WTLMA: 2300-0500 UTC.

30 Apr / 1 May 2012 – WTLMA/OKLMA: 2100-0500 UTC.

May (as of 2245 UTC on 14 May 2012):

2 May 2012 – DCLMA: 2000-2230 UTC.

3-4 May 2012 – DCLMA: 2100-0200 UTC.

4 May 2012 – DCLMA: 1600-1700 UTC.

6 May 2012 – NALMA: ~1100 UTC.

6-7 May 2012 – NALMA: 1700-0100 UTC.

7 May 2012 – NALMA: 1900-2100 UTC.

8 May 2012 – NALMA: ~1800 UTC (possibly out-of-range).

14 May 2012 – FL-LDAR: (likely non-severe and under jump threshold; HWT Spring Experiment/EWP operating in domain).

Lightning Jump: 19 Apr 2012 OK & TX

It was an active evening over two of our networks last night, with lightning jumps occurring on multiple storms in OK & TX.  SHAVE was active as well though phone numbers in some of the areas were a bit sparse and calling ended at 9pm CDT, with many storm reports appearing just after this.  Luckily, storm reports in the region were plentiful including one of 3 in hail SE of Plainview, TX.

Oklahoma (Caddo/Grady Co. storm):

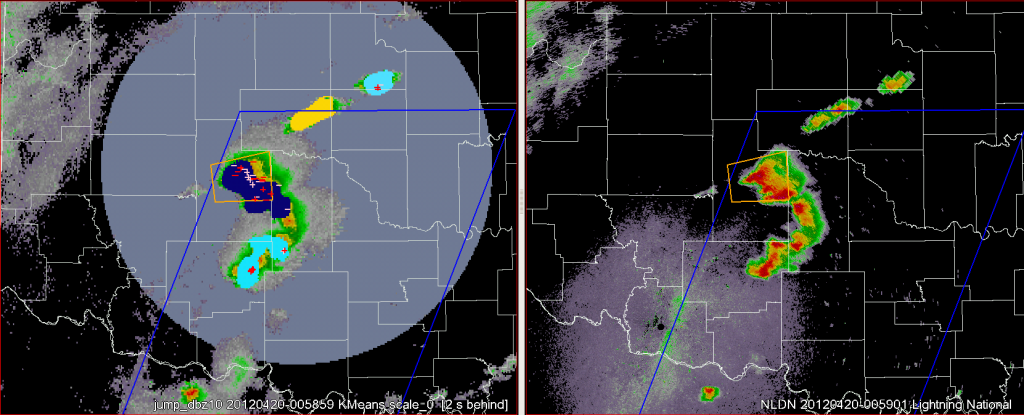
20 Apr 2012, 0059 UTC. Left panel: OKLMA network range, kmeans storm clusters, and NLDN lightning. Right panel: KFDR 0.5 deg reflectivity. NWS watches/warnings on both panels.

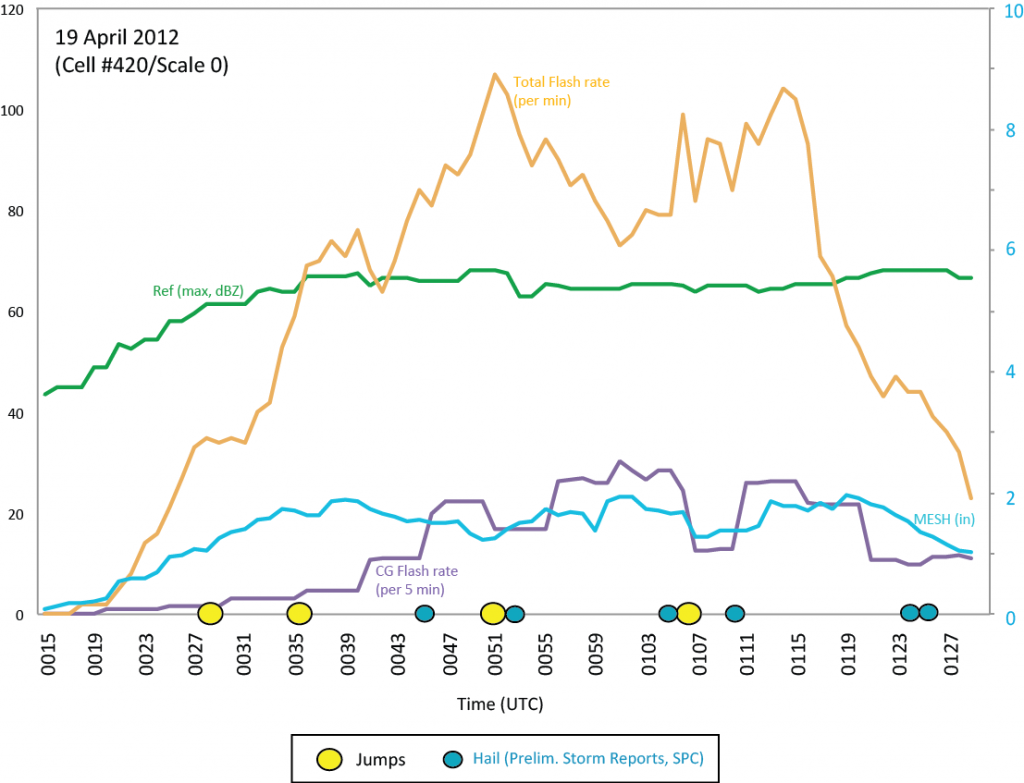
Storm trends, jumps and storm reports (SPC, prelim) for this same storm:

Trends for cell 420 in Oklahoma. Left y-axis: Flash rate/max ref. Right y-axis: MESH (in)

There were multiple other storms in Oklahoma that also had lightning jumps.  These storms were along the line from central Canadian Co through NW Oklahoma Co into Logan, Lincoln and Payne Counties.  Watching the realtime feed it seems that many of the ‘jumps’ were due to storm mergers along the line.  It will be interesting to compare storm cluster size with timing of the jumps in post-analysis.  SHAVE did call along this line, but found only dime-to-nickel-size hail.

Plainview, TX storm:

(details to be completed)

—–

SHAVE closeout at Fri 20 Apr 2012 015711 GMT:  SHAVE made ~103 calls today.  We had 30 hail reports with 2 being severe (1.0″+), 0 being significant (2″+).

SPC storm reports:

http://www.spc.noaa.gov/climo/reports/120419_rpts.html

Lightning Jump – 13 April 2012: Technical Update & Norman Tornado

Earlier entries (to be updated) have gone over a few of the technical issues we’ve found during these first couple of events.  Managed to find a new one on Friday.

Our flash sorting algorithm (i.e., w2lmaflash) seems to be having difficulty dealing with timestamps across multiple minutes from multiple domains coming in at the same time. For example, lets say the current time is 2012 UTC… the OK-LMA is sending 2009 UTC data (the more activity the slower the data transfer gets, up to about 4 min latency), but meanwhile there is no activity in the NA-LMA domain so the timestamp on the LDM feed the most recent data is 2012 UTC. This seems to be leading the w2lmaflash algorithm to be ‘prune’ (or drop) flashes that are more than a minute older (our current processing interval) than the most recent time from an LMA network…

At least that’s what I believe the problem is right now since it’s not reproducible in post-processing when it pulls from all the networks at the same time.

—-

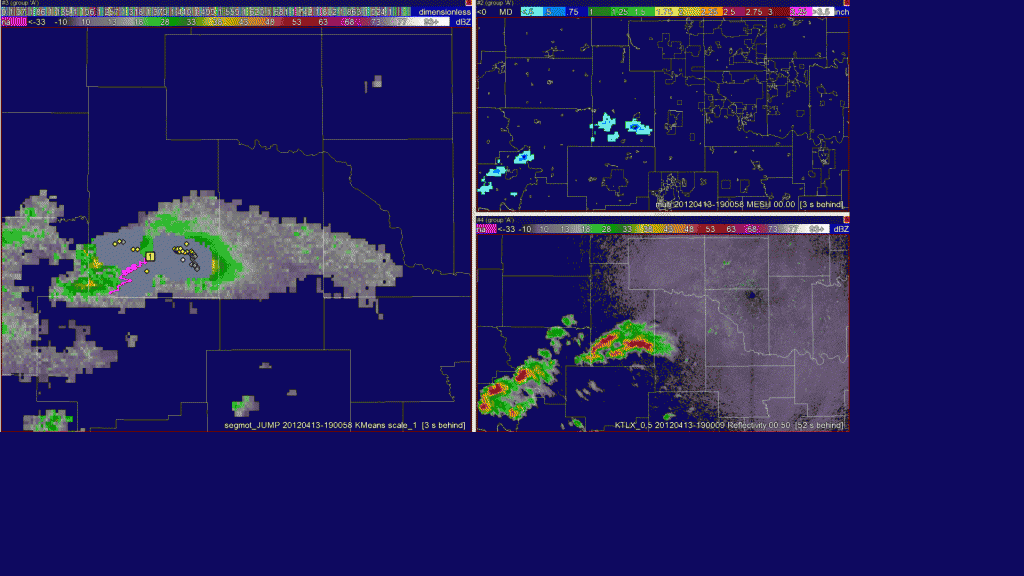
I pulled all the data from Friday off the realtime feed and re-ran it over the weekend over the Oklahoma domain.  The Norman tornadic storm is labeled as Cell 1 in all the figures and tables below using scale 1 from the w2segmotionll (kmeans) storm tracking.

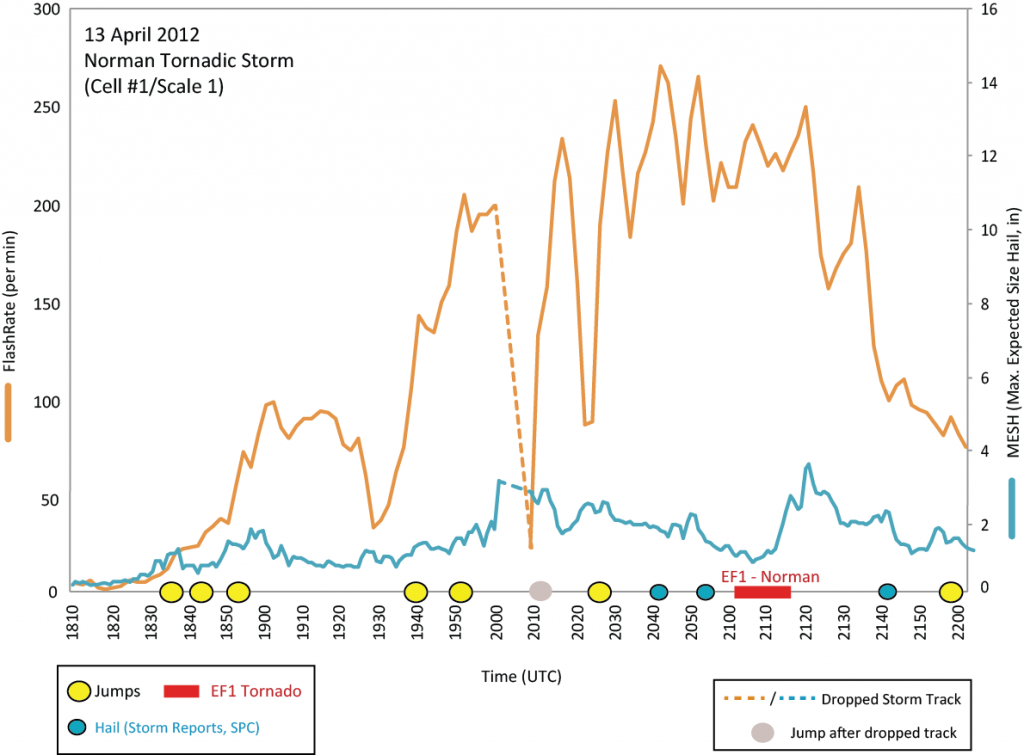
The total flash rate (TFR) rate for this storm peaked at 282 flashes per min at 2244 UTC, with jumps occurring at 1835, 1844, 1853, 1940, 1952, 2012, and 2027 UTC (Fig. 1).  Hail times from Local storm reports associated with this storm  were recorded at 2041 (1 in), 2055 (1 in), and 2142 (1.5 in).  The EF1 tornado moved through Norman, OK between 2102 and 2113 UTC (estimates from TDWR).

Time Series 20120413 Cell 1, Scale 1
Time series data (Total Flash Rate & MESH) for the Norman tornadic storm 1810-2200 UTC, Friday 13 Apr 2012. Yellow circles denote time of lightning jumps.

I’m discounting the lightning jump at 2012 UTC since there was no real-time radar merger between 2000 and 2008 UTC, hence nothing for the algorithm to track.  Oddly, during this same time period [2002-2008 UTC] four stations in the OKLMA were also not communicating, leading to too few stations to do any quality control for flash sorting.  So it is unknown whether the storm would have produced a lightning jump at this time had the merger/tracking been working correctly.

What is really interesting with this storm is how the character of the lightning changed prior to 2000 UTC and after 2010 UTC as the storm began it’s deviant motion right (towards Norman).  The animation below (5 min intervals) catches this character as lightning initiations grow not only in number but also across the storm. The flash rate continues to increase with initiations spreading into the anvil region by the time the core of the storm is over Norman.  This increase in flash rate and expanded coverage of lightning is reflective of change in the strength and size of  the main updraft core over the same time period (linked via storm electrification processes in around the updraft region).

20120413_animation (quicktime movie, looks a bit better than gif animation below. Either way, you’ll need to click on the link above or image below to see the animation)

gif animation for 13 Apr 2012
3 panel animation of storm between 1900 and 2125 UTC. Main panel: Kmeans storm clusters with cluster ID (yellow square) and past track (pink). Lightning initiation locations (green, gray, & yellow diamonds) overlaid. Top right: MESH (Maximum Expected Size of Hail). Bottom right: KTLX reflectivity at 0.5 deg.

There was also a tornado reported in Mustang at 12:45 am CDT, but I haven’t had time to evaluate that storm yet.

Feel free to leave any questions or comments below or send them directly to me at kristin.kuhlman -at- noaa.gov

Lightning Jump: Network Range

Since the LMA networks depend on a line-of-sight for the time-of-arrival detections, distance from the network center is a key aspect to quality control.  While accuracy of a any VHF detection in the center of the network is around ~10 m, this drops off dramatically with range.  Flash sorting helps to remove some of this dependency, however, we still want to make sure jumps are not occurring simply because a storm is moving into to the LMA domain.

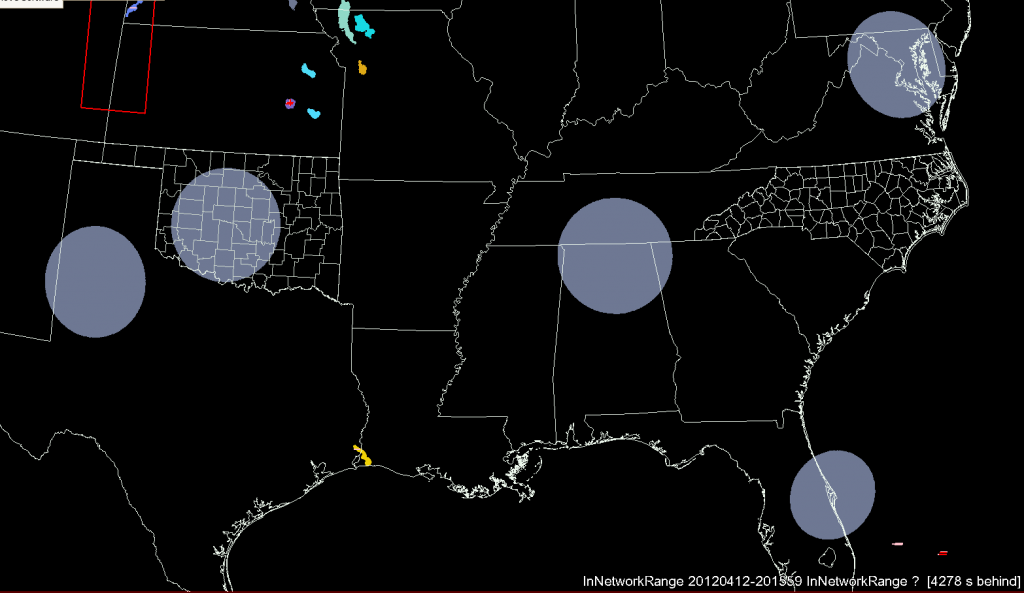
Originally, this network range issue was planned to be part of the flash sorting algorithm, but after looking at the data we decided to change it to a strict 150 km range (Fig. 1).  But I was still seeing an effect of storms entering the network, so I decided to reduce the range again to 125 km (Fig. 2).

Network Range
150 km range maps for WTLMA/OKLMA/NALMA/DCLMA & 125 km range for FLLDAR

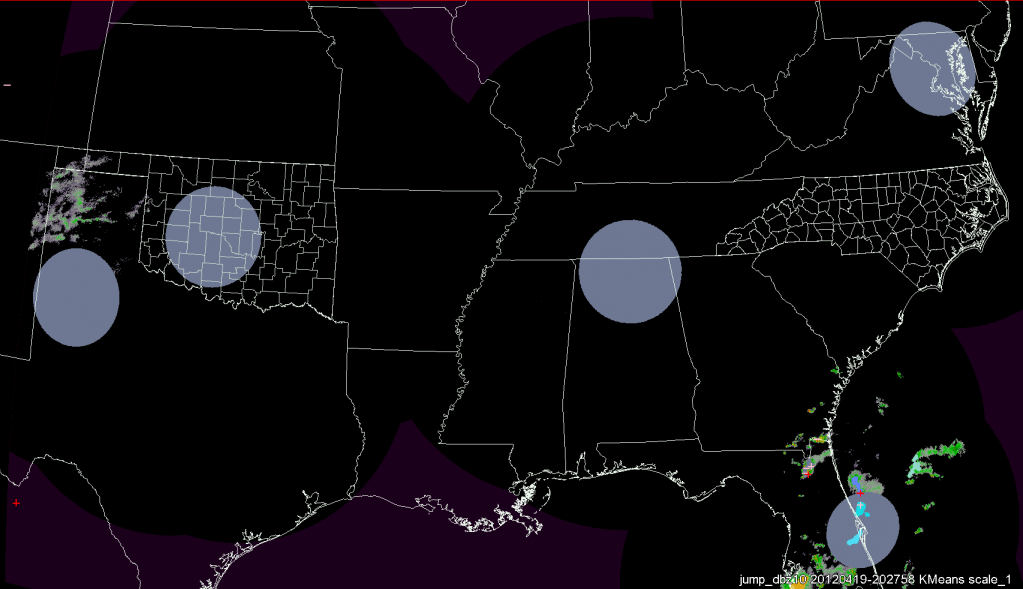
We’ve now switched to 125 km for the majority of the networks (100 km for FL).  This means that if any part of the identified k-means cluster overlaps the region within 125 km of the network center it is eligible for a lightning jump. (And, yes, this does mean that the majority of a cluster can be outside the range, hence why we went a little stricter and confined it to 125 km instead of 150 km).

The new network range map can be seen below:

LMA network ranges of 125 km for WTLMA/OKLMA/NALMA/DCLMA and 100 km for FL-LDAR.

I don’t have the exact location of the OKLMA southwest extension yet, nor is the data feed working in realtime so that is being left out for the moment.

Lightning Jump – Week 1: 2 Apr 2012 – 9 Apr 2012

Moving an algorithm into real-time operations is full of pitfalls and challenges.  This first week of operations for the lightning jump algorithm was no exception.  No matter how much archive data you test on, there are certain aspects that change once you’re at the mercy of a real-time feed. Add to that, working with weather data where the outcomes are unknown and you get a great recipe for failure.

This first week we had three events to test data on, with the SHAVE project active on 2 of the days.  The below images (screenshots from the event) will give you a chance to see our visualization of the lightning jump for the SHAVE participants and what you can see real time during future events at:  http://ewp.nssl.noaa.gov/projects/shave/data/

Basically, the jump is currently being visualized by colored circles along the track of the centroid of the identified storm cluster. When a storm has a lightning flash rate > 10 flashes per min, but does not have an active ‘jump’ a gray circle is placed along the track.  When the storm meets the jump criteria, the circle changes to red.  The activity this first week was our first chance to see the visualization and get the data over to kml format (Kiel Ortega was instrumental in getting all of this up and going).

5 Apr 2012: Northern Alabama

(to be filled in w/ info on any jumps)


SHAVE closeout on Fri 06 Apr 2012 at 011011 GMT:  SHAVE made ~471 calls today. Today we had 98 hail reports with 11 being severe (1.0″+), 0 being significant (2″+).  We had 1 wind reports today.

SPC storm reports for this event: http://www.spc.noaa.gov/climo/reports/120405_rpts.html

7 Apr 2012:  Oklahoma

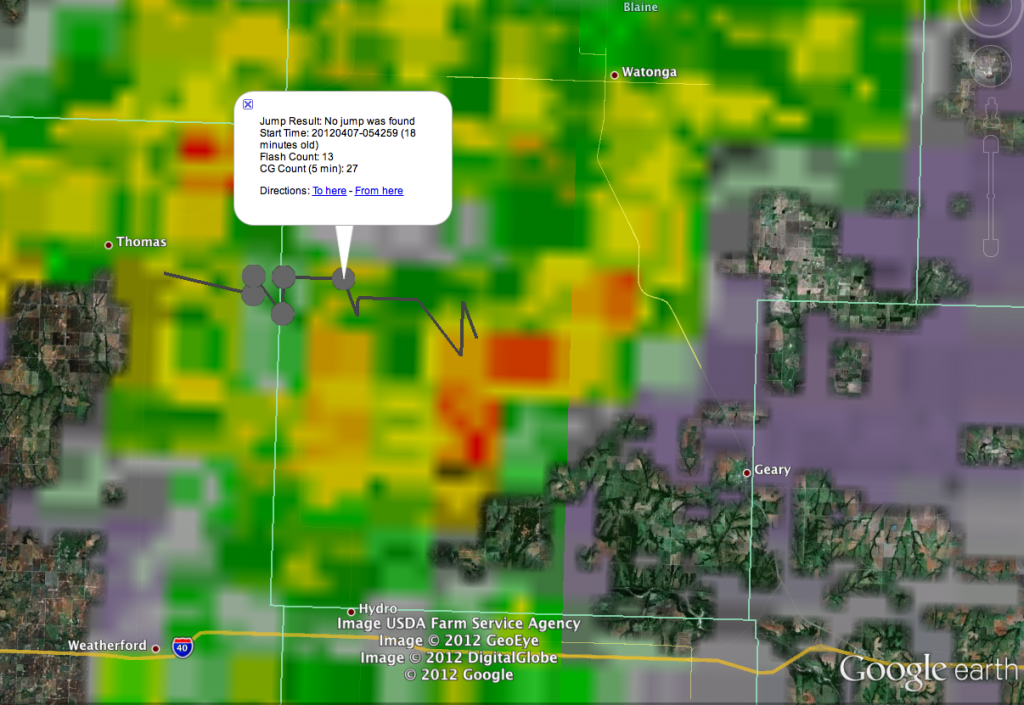
Google Earth image from 7 Apr 2012
Storm track in NW Oklahoma on 7 Apr 2012 at 0542 UTC showing no jumps, but flash rate above 10. Displayed in GoogleEarth.

SHAVE was not active on this day and there were no warnings or storm reports over any of the LMA regions.

9 Apr 2012:  Oklahoma

Activity on 9 Apr 2012 was primarily outside the central range of the OKLMA network, though there was a chance that storms would move into range. I’ve included it here mostly for illustration of storm cluster identification and storm tracking.

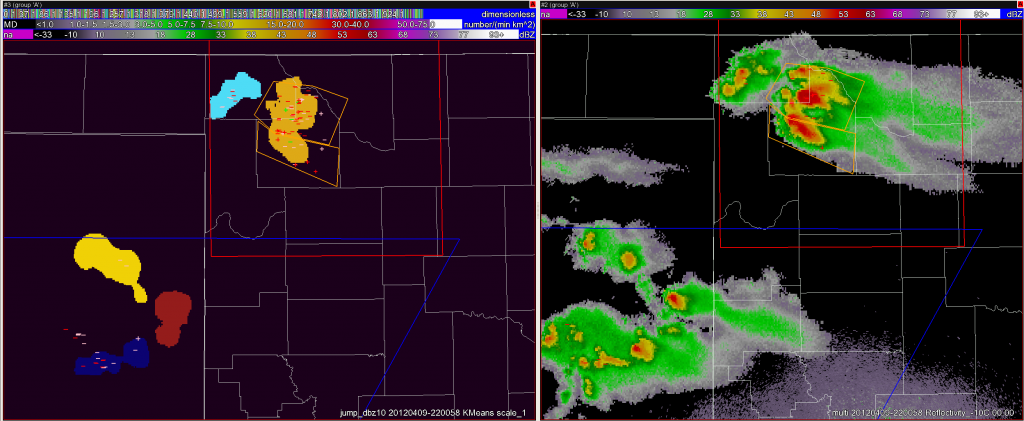
Screenshot at 2200 UTC from WDSSII/WG display. Left panel: storm clusters identified by Kmeans. Right panel: Reflectivity @-10C. NWS warnings/watches and NLDN lightning location and polarity are shown on both panels.

The kmeans storm identification works on 3 separate scales, simply thought of small, medium and large (or 1, 2 and 3).  Each of these is using Reflectivity at -10 C, with thresholds set such that all reflectivity less than 20 dBZ becomes 0 and all greater than 50 dBZ appears at 50 dBZ to the algorithm.  We are also using a percent filter such that pixels nearby that are partially filled or surrounded by pixels that are filled match the neighbors.  This acts to expand the cluster slightly, with the goal to pick up more of the lightning flashes.  Looking at the example in the screenshot above, all the CG flashes within the colored area would be counted as occurring with that storm, anything outside the area, even closely nearby will not be associated.  Sometimes (at scales 1 & 2 especially) this may combine storms that the human forecaster would deem to be separate entities.  This is typically a problem with smaller storms occurring in close proximity to each other as we had from this example on 9 Apr.

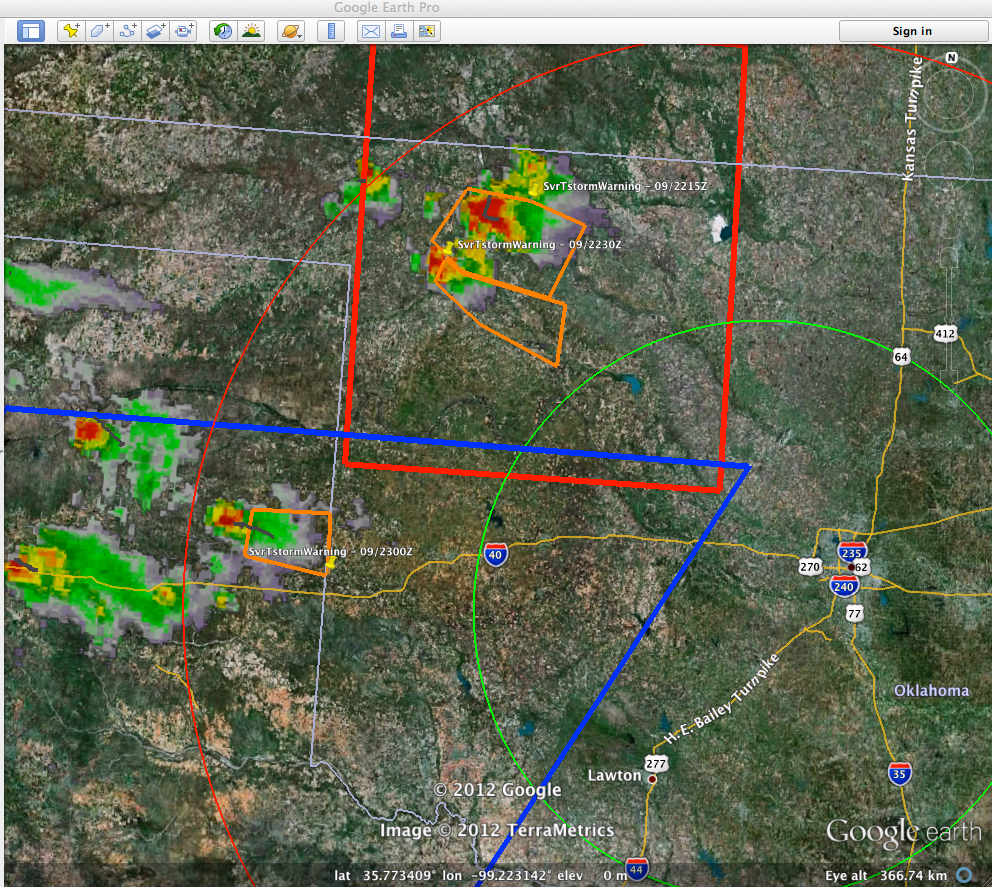
The corresponding visualization in Google Earth (or similarly on Google Maps) can be seen below.

Google Earth image from 9 Apr 2012 at 2230 UTC
Storms as seen via Google Earth around 2230 UTC. Gray tracks represent centroid of associated Kmeans storm cluster. Reflectivity at lowest level and NWS watches/warnings also shown. Green circle represents 125 km from LMA network center.

SHAVE closeout at Mon 09 Apr 2012 234803 GMT. SHAVE made ~109 calls today. We had 27 hail reports with 13 being severe (1.0″+), 10 being significant (2″+)