LAPS nearcast for precip is a pretty good match

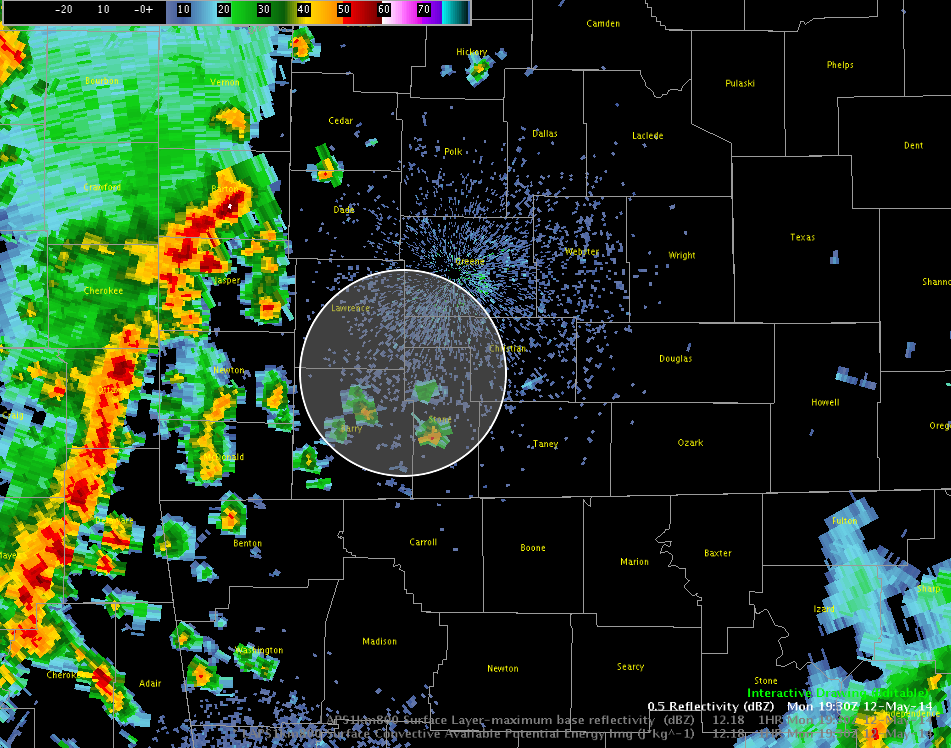
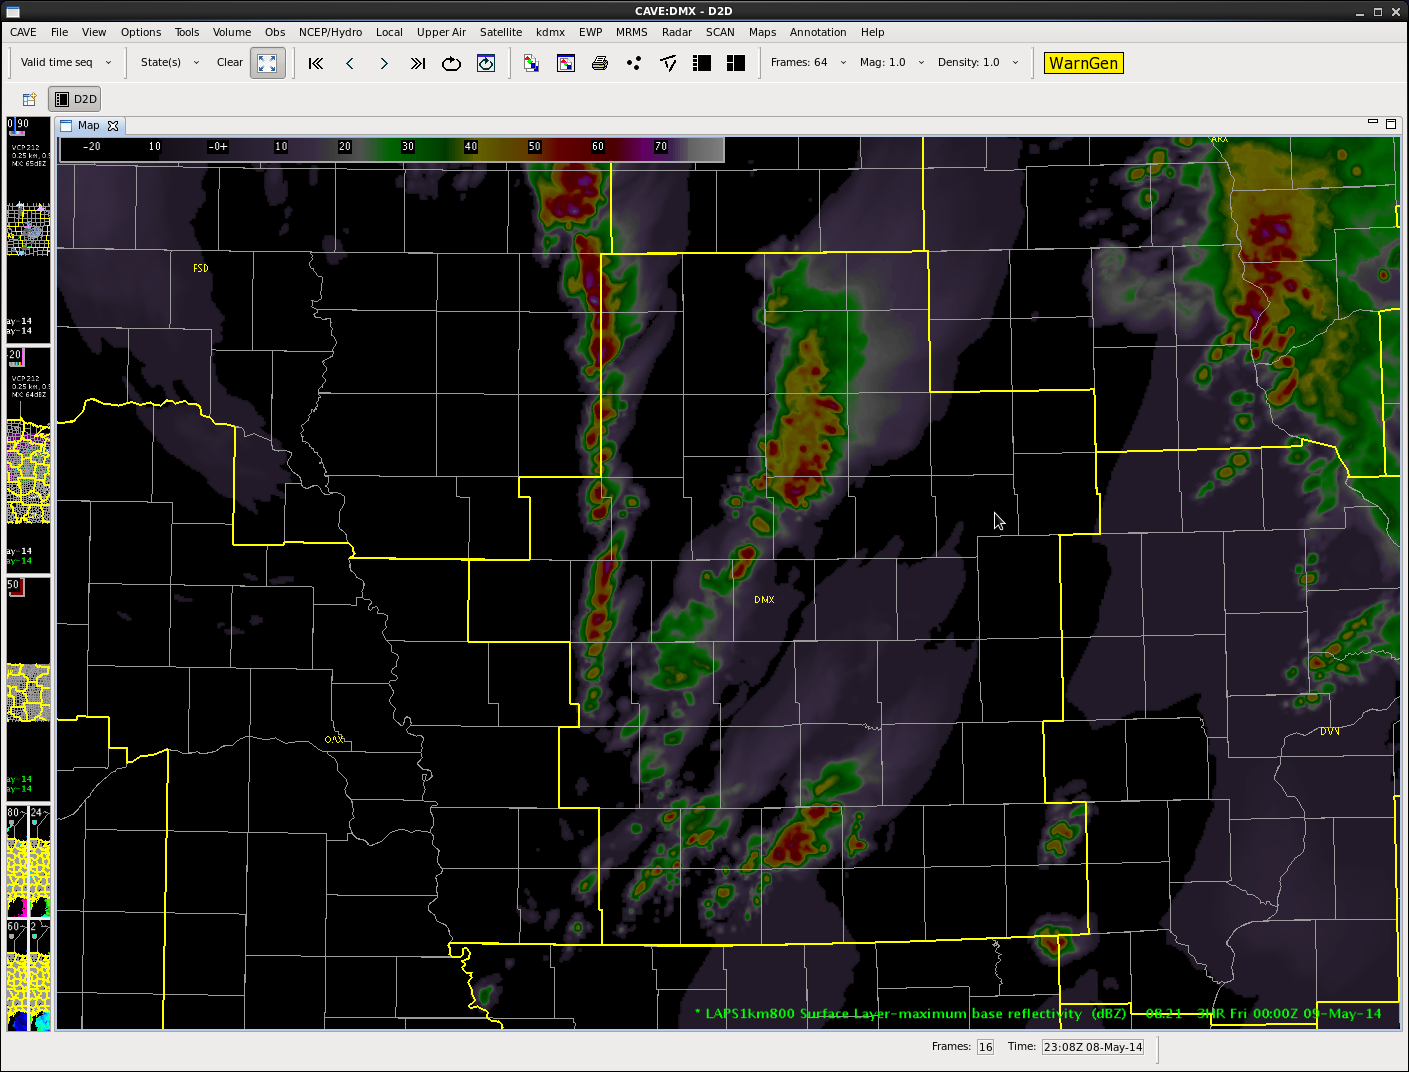
We worked with the LAPS 800 x 800 grid as it was centered over a portion of the Midwest, which was under a Severe Thunderstorm Watch until 8PM local time. The model’s maximum reflectivity product was pretty well matched up with radar at 19Z on May 12th for the area with a precip shield, and it even had a pretty good match with the areas of heavier intensity. The first image is of the LAPS max reflectivity product from its 18Z run, valid at 19Z:

LAPSmaxreflectivity19ZMay12

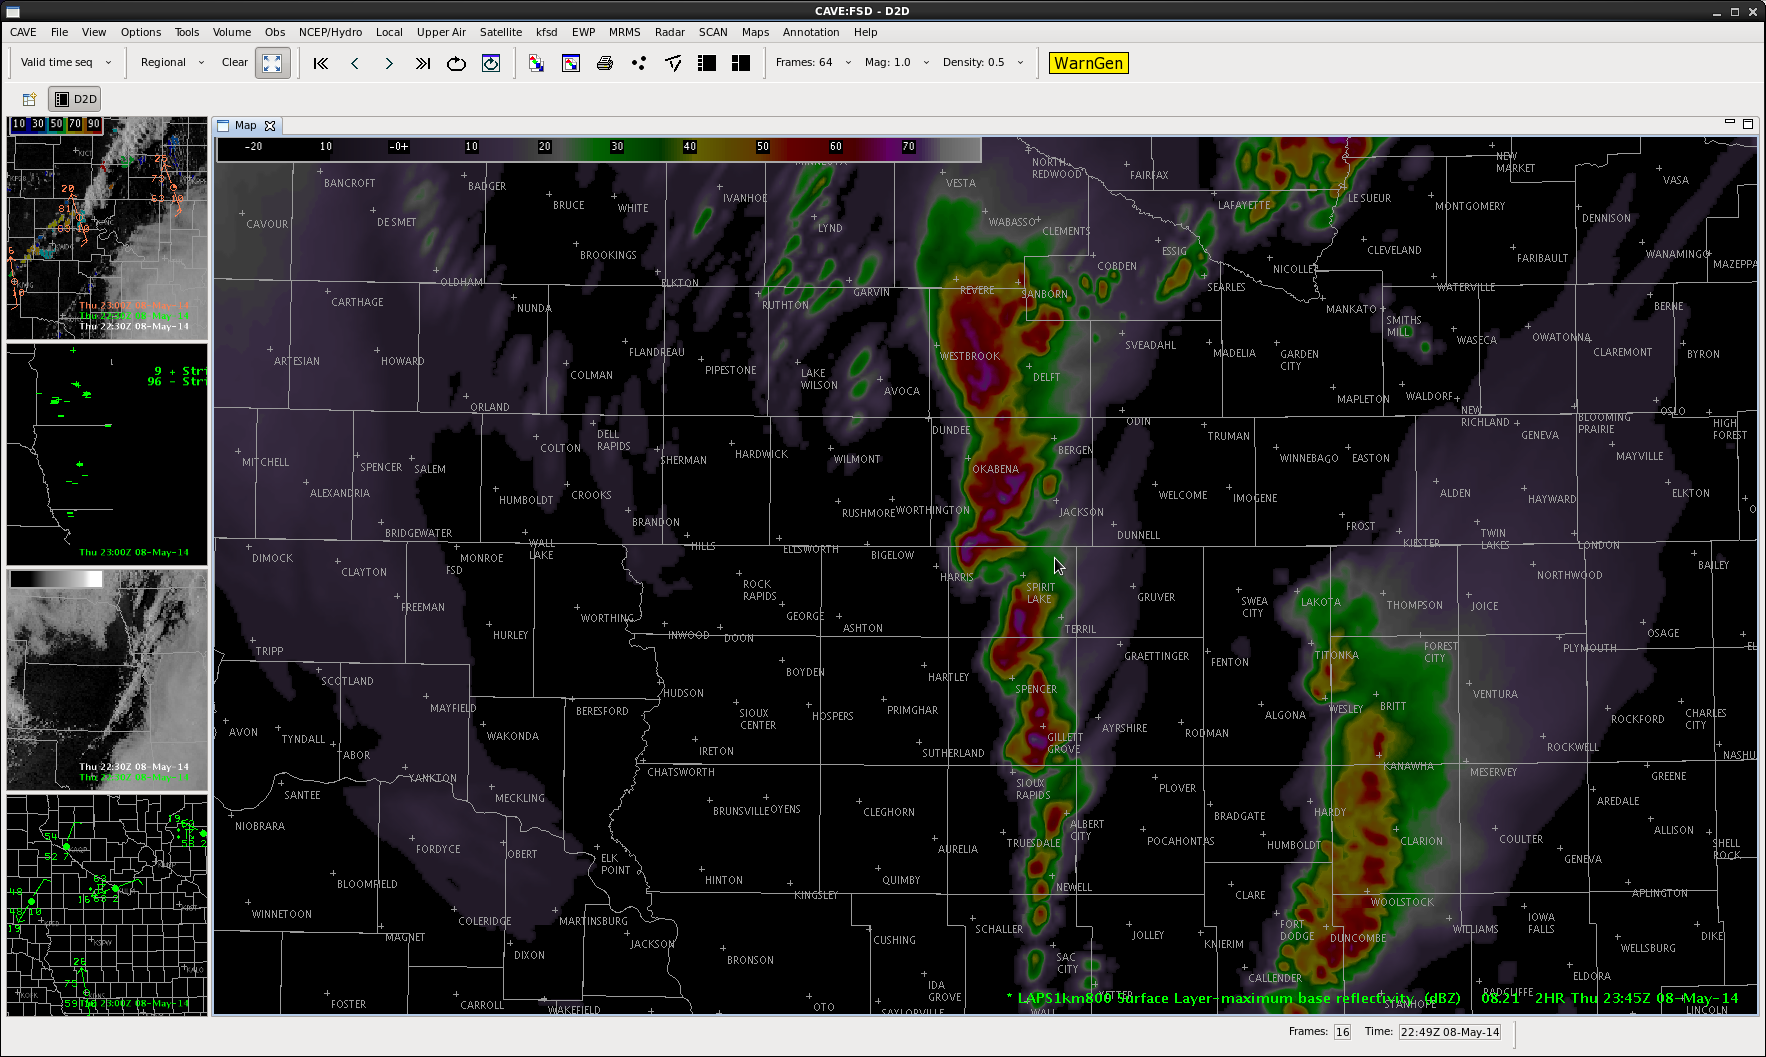
And here is the Davenport, IA radar base reflectivity, also at 19Z:

KDVNbaseref19ZMay12

Notice that the spatial coverage of the precipitation is a pretty close match over central and eastern Iowa at this time period. The model also correctly forecast a sort of “dividing line” between the eastern and western areas of precip. However, the intensity of the precip is a bit overdone on LAPS, especially in the cluster of storms on the left side. The heavier rain toward Iowa City did not materialize as of 19Z, though it was forecast by LAPS to have reflectivity above 50 dBZ.

However, as I continued to watch the radar in Iowa, I noticed some more convective cells developed in the region that the LAPS had predicted higher values of max reflectivity. So the timing was a bit off on the forecast of convective initiation and heavier precipitation. We’ll have to continue to watch this product throughout the week as other convective situations arise in order to see if it’s valuable for nowcasting.

Tags: None

ProbSevere Model Good Lead Time NE Missouri/SE Iowa border – Missing SRSOR Images

The ProbSevere Model indicated an 83% probability of a severe storm within an environment of 2968 J/Kg of MUCAPE and 34.6 kts of EBShear at 2020Z. It also indicated MESH of 1.07inch at this time. The following 2-minute resolution updates continued to show 80+% prob and 1 inch+ MESH as the storm tracked northeast from the NE Missouri/SW Iowa border into SW Iowa except for one frame at 2028z where it showed a 64% prob. WFO DMX issued a SVR at 2037z. ProbSevere may have helped give up to 17 minutes additional lead time if the warning was issued once the ProbSevere crossed above 80%. At the time of this post there were not yet any confirmed hail reports.5-12-2014-2020zProbSvr

Visible satellite data started to show a resemblance of an enhanced updraft on this storm at 2015z with a developing anvil and anvil shadowing at 2025z.  SRSOR VIS data was missing between 2011z and 2030z so had to use conventional visible images for the attached screen captures.
2015zvis2025zvisShawn Smith

EDIT: Missing GOES-14 SRSOR images were due to “daily housekeeping” – BL

Tags: None

Expanding Overshooting Tops Increase SVR Lead Time in Southern IA

The following images depicted the expansion in overshooting tops depicted by the CIMMS Auto Overshooting Tops Detection Algorithm 2015 to 2045 UTC May 12 across southern Iowa.

The first image had a small red blob in southwest Davis county at 2015 UTC, which greatly enlarged in area by 2025 UTC in the second image.   By 2030 UTC in the third image, the area split up into three blobs.  By 2037 UTC, the fourth image indicated four blobs with the two blobs to the northeast representing the fastest growth and expansion of the storm.  By 2045 UTC, the last image, three blobs were with this storm, possibly indicated that storm was intensifying or at least maintaining intensity.

A SVR was issued for Van Buren county, on the southeast part of the enclosed circular area, with the overshooting tops blobs at 2037 UTC.  A 60 mph gust along with heavy rainfall and low visibility was observed in the warned area at 2127 UTC. The great expansion and splitting of blobs indicated by the Auto Overshooting Top Detection Algorithm could have increased SVR lead time another 10-30 minutes.

OvershootingTops2015UTC120514


OvershootingTops2025UTC120514 OvershootingTops2030UTC120514 OvershootingTops2037UTC120514 OvershootingTops2045UTC120514

Michael Scotten

Tags: None

vLAPS Slightly Overdone in MO Monday – 20Z

vLAPS Surface Maximum Reflectivity
vLAPS simulated surface reflectivity versus observed radar

While awaiting convection in my CWA (St. Louis), I used the vLAPS model to diagnose the potential for pre-frontal convection across my CWA.  These images depict the model-derived reflectivity versus the observed radar at 21Z Monday May 12th.  The model is quite a bit overdone with the convection in the warm sector in Missouri (although perhaps being on the edge of the model domain may be affecting this to some extent…).


-Deitsch

Tags: None

CI Tool – Monday May 12th 19-20Z

At 1930Z, the CI Probability tool showed very high probabilities of CI
This was the radar at the time of the high CI probs, 1930Z

An area of very high CI probailites (90%) caught my eye at thresholds around 90%.  Sure enough, convection did indeed form around the time of the highest probabilities, so the product worked well in highlighting the area of potential convection.  However, convection quickly died out after reaching the dBZ thresholds to blank out the CI algorithm out (30-40 dBz).  So while it proved well in identifying an area of potential storm development, in this case, the storms simply failed to materialize into anything more then a few light showers/sprinkles (although I realize the algorithm is not meant to diagnose storm sustainability).


– Deitsch

Tags: None

Starting This Monday – The Big Experiment (Week 2)

Monday 12 May 2014 begins the second week of our four-week spring experiment of the 2014 NSSL-NWS Experimental Warning Program (EWP2014) in the NOAA Hazardous Weather Testbed at the National Weather Center in Norman, OK.  This week we will evaluate multiple experimental products geared toward WFO applications.   This evaluation – known as “The Big Experiment” – will have three components including a) an evaluation of multiple CONUS GOES-R convective applications, including satellite and lightning;  b) an evaluation of the model performance and forecast utility of two convection-allowing models (the variational Local Analysis Prediction System and the Norman WRF); c) and an evaluation of a new feature trending tool.  We will also be coordinating with the Experimental Forecast Program and evaluating their probabilistic severe weather outlooks as guidance for our warning operations.  Operational activities will take place during the week Monday through Friday.

For the week of 12-16 May, our distinguished NWS guests will be Kevin Deitsch (WFO Louisville, KY), Shawn Smith (WFO Buffalo, NY), and Michael Scotten (WFO Norman, OK).  In addition to our NWS forecasters, we will be hosting a broadcast meteorologist to work at the forecast desk; this week, our distinguished guest will be Erica Grow of WUSA-TV (Washington, DC).  If you see any of these folks walking around the building with a “NOAA Spring Experiment” visitor lanyard, please welcome them!   The GOES-R program office, the NOAA Global Systems Divisions (GSD), and the National Severe Storms Laboratory have generously provided travel stipends for our participants from NWS forecast offices and television stations nationwide.

Visiting scientists and observers this week will include Hongli Jiang (GSD), John Cintineo (UW-Madison/CIMSS), John Mecicalksi (University of Alabama – Huntsville), Elise Schultz (University of Alabama – Huntsville), Sara Stough (University of Alabama – Huntsville), Ben Baranowski (Weather Decision Technologies), Jason Lynn (Weather Decision Technologies), Chris Schwarz (Weather Decision Technologies), and Mike Smith (AccuWeather / WeatheData),.


Bill Line 
will be the weekly coordinator.  Lance VandenBoogart (WDTB) will be our “Tales from the Testbed” Webinar facilitator. Our support team also includes Darrel Kingfield, Kristin Calhoun, Gabe Garfield, Chris Karstens, Greg Stumpf,  Karen Cooper, Vicki Farmer, Lans Rothfusz, Travis Smith, Aaron Anderson, and David Andra.

Here are several links of interest:

You can learn more about the EWP here:

https://hwt.nssl.noaa.gov/

NOAA employees can access the internal EWP2014 page with their LDAP credentials:

https://hwt.nssl.noaa.gov/ewp/internal/2014/

 
Gabe Garfield
CIMMS/NWS OUN
2014 EWP Operations Coordinator

Tags: None

EWP2014 Week 1: Weekly Summary 5 May – 9 May 2014

Project Overview:

This was first week of our four-week spring experiment of the 2014 NSSL-NWS Experimental Warning Program (EWP2014) in the NOAA Hazardous Weather Testbed at the National Weather Center in Norman, OK.  “The Big Experiment” or “Spring Experiment” had three components:  (1) an evaluation of multiple CONUS GOES-R convective applications, including satellite and lightning;  (2) an evaluation of the model performance and forecast utility of two convection-allowing models (the variational Local Analysis Prediction System and the Norman WRF);  (3) and an evaluation of a new feature tracking tool from NASA SPORT.  Additionally we coordinated daily with Experimental Forecast Program, participating in briefings and evaluating the probabilistic severe weather outlooks produced by their forecasters as guidance for our warning operations.

Participants:

The NWS guests were Jared Maples (WFO Grand Rapids, MI), Scott Rudge (WFO Rapid City, SD), and Bruce Thoren (WFO Norman, OK).  Additionally, for the first time, the EWP is hosting a weather broadcaster to work with the NWS forecasters at the forecast desk.  This week, the guest was Daniel Bickford of WSPA-TV (Greenville, SC).   The GOES-R program office, the NOAA Global Systems Divisions (GSD), and the National Severe Storms Laboratory provided travel stipends for our participants from NWS forecast offices and television stations nationwide.

Visiting scientists this week included Hongli Jiang (GSD), Paola Salio (Ciudad Universitaria, Buenos Aires, Argentina), Justin Sieglaff (CIMSS), and Kris White (WFO Huntsville, AL).

Kristin Calhoun 
was the weekly coordinator, Gabe Garfield the back-up coordinator and Lance VandenBoogart (WDTB) was our “Tales from the Testbed” Webinar facilitator. Our support team also included Darrel Kingfield, Bill Line, Chris Karstens, Greg Stumpf,  Karen Cooper, Vicki Farmer, Lans Rothfusz, Travis Smith, Aaron Anderson, and David Andra.

EWP Week 1 participants.  Back Row (L to R): Bruce Thoren (WFO Norman), Hongli Jiang (GSD), Darrel Kingfield (CIMMS/NSSL), Kristin Calhoun (CIMMS/NSSL), Kris White (NWS Huntsville), Scott Rudge (NWS Rapid City), Paola Salio (Ciudad Universitaria, Buenos Aires, Argentina).  Front row (L to R): Jared Maples (WFO Grand Rapids), Daniel Bickford (WSPA-TV, Greenville, SC), William Line (CIMMS/SPC), Lance VandenBoogart (CIMMS/WDTB), Gabe Garfield (CIMMS/NWS Norman)
EWP Week 1 participants. Back Row (L to R): Bruce Thoren (WFO Norman), Hongli Jiang (GSD), Darrel Kingfield (CIMMS/NSSL), Kristin Calhoun (CIMMS/NSSL), Kris White (NWS Huntsville), Scott Rudge (NWS Rapid City), Paola Salio (Ciudad Universitaria, Buenos Aires, Argentina). Front row (L to R): Jared Maples (WFO Grand Rapids), Daniel Bickford (WSPA-TV, Greenville, SC), William Line (CIMMS/SPC), Lance VandenBoogart (CIMMS/WDTB), Gabe Garfield (CIMMS/NWS Norman). (Not pictured:  Justin Sieglaff (CIMSS-WI)


Daily Operations Summary:


Feedback on Experimental Products:

Synthetic Imagery (simulated satellite via NSSL WRF):
  • Easily showed the lack of handle on the current situation of the model: if it didn’t match current observations would disregard that solution
Nearcast:
  • Useful product for visualization of moisture and instability
  • Easily track of movement of moisture and instability gradients.
  • Believe that more frequent analyses could be better, but current forecast frequency is adequate.
  • Suggest filling in gaps in coverage with other model data, but highly believe there should be an option to turn on / off model interpolation so forecasters can see what is observations vs model data.
  • Gain more knowledge / understanding of the product with increased use.
 GOESR Convection Initiation – probabilities:
  • “It’s ok.”  In some regimes it was fantastic, in others not so great. (Surprised it did not work well on 8 May 2014 in Kansas without cirrus coverage).
  • Need to better understand what when it works well, and when it doesn’t/
  • Foresee utilization outside of severe convection (e.g., updating near-term POPs)
ProbSevere –
  • Good tool for short-term use and initial storm development.
  • Used tool as assistant to further interrogate the storm via all-tilts radar, etc.
  • Watched trends in probabilities; self-calibrated by watching control (or first) storm to develop in environment and applied to other storms that day.
  • Look forward to having different probabilities for tornado / wind / hail.
  • See limitations for linear systems as it will grab long line and produce probability and max values for entire line.  Would prefer to see see lines segmented more (possibly could be done once they get above a certain size, e.g., 50 or 100 km).
  • Would like to see strong/ mod colorization of text in metadata via mouseover (e.g., MESH text move from white to yellow at 1 in).
  • High probabilities failed on Thurs 8 May due to influence of high growth rates (strong glaciation) though MESH remained was low.  This provided low confidence in values during the event.
Overshooting Tops:
  • highlights features in imagery – useful where radar coverage is sparse or radar is down
Super-rapid scan, 1-min imagery:
  • “Very cool” ; “Eye candy”
  • Could easily pick out boundaries and associated movement
  • Able to view the overshooting tops form and see shadows move (utilized more than CI or overshooting tops products)
  • Provided a view of updraft strengthening
pGLM –
  • Flash extent density picked out which storms growing the quickest and which were the strongest.
  • Could see intensification and decay of multiple storms
SPORT tracking tool:
  • Not highly utilized this week due to day-to-day changes in product.
  • Could see it being a useful tool to examine trends multiple products including gate-to-gate values and storm-top divergence.
vLAPS :
  • Much difficulty with initial runs immediately after re-centering domain.
  • Could easily interrogated max reflectivity in model and compare w/current observations
  • Visible artifacts (hot spots in humidity) from possible assimilation of bad observations from AWOS sites (more comparison QC needed?). 
  • For enhanced operational utility, suggest extending forecast to 6 hrs window.  (1st hour forecast is generally “now,” thus only currently used as 2 hr forecast)
  • For similar computational usage suggest updating only 30 min for longer forecast window, but still begin a new forecast every hour.

Contributors:

-Kristin Calhoun, Week 1 Coordinator

-Gabe Garfield, EWP Spring Experiment Coordinator

Tags: None

OT Detection Assists on IR

8May14 IR Without OT 8May14 Overshooting Top IR

If you refer to the first image, it is obvious that we have some cold cloud tops over Minnesota and Wisconsin. However, it wouldn’t be quite obvious where the highest tops exist and which of those are necessarily overshooting tops. The OTD (Overshooting Top Detection) tool helps! By detecting a cloud top that is less than or equal to -6K than its surrounding anvil, the OTD will mark the cloud top (seen by the dark blue marks in the second image). The anvil must also meet a temperature threshold. The anvil must be less than or equal to 225K and the top must be less than or equal to 215K. If these conditions are not met, no overshooting top will be detected. This prevents the tool from being over sensitive and creating false detections.

Jared Maples

Tags: None

LAPS Max reflectivity following storm trends.

LAPS Max reflectivity has done an adequate job with storm placement and storm mode with the exception of some model boundary issues. Those issues have become less and less apparent in successive runs. Definitely some utility with this product for short term trends.

LapsMaxRefl


Scott Rudge.

Tags: None

LAPS00Z_eastern_FSD


Most recent run of LAPS model, increases storms across the far eastern part of FSD’s CWA.  By 00z (three hour forecast), storms extend from Revere to Okabena to Sioux Rapids.


bt