OUN WRF – Thursday 2200Z Analysis

OUN WRF Analysis 22Z - Simulated Reflectivity overlayed with ongoing reflectivity.
OUN WRF Analysis 22Z – Simulated Reflectivity overlayed with ongoing reflectivity.

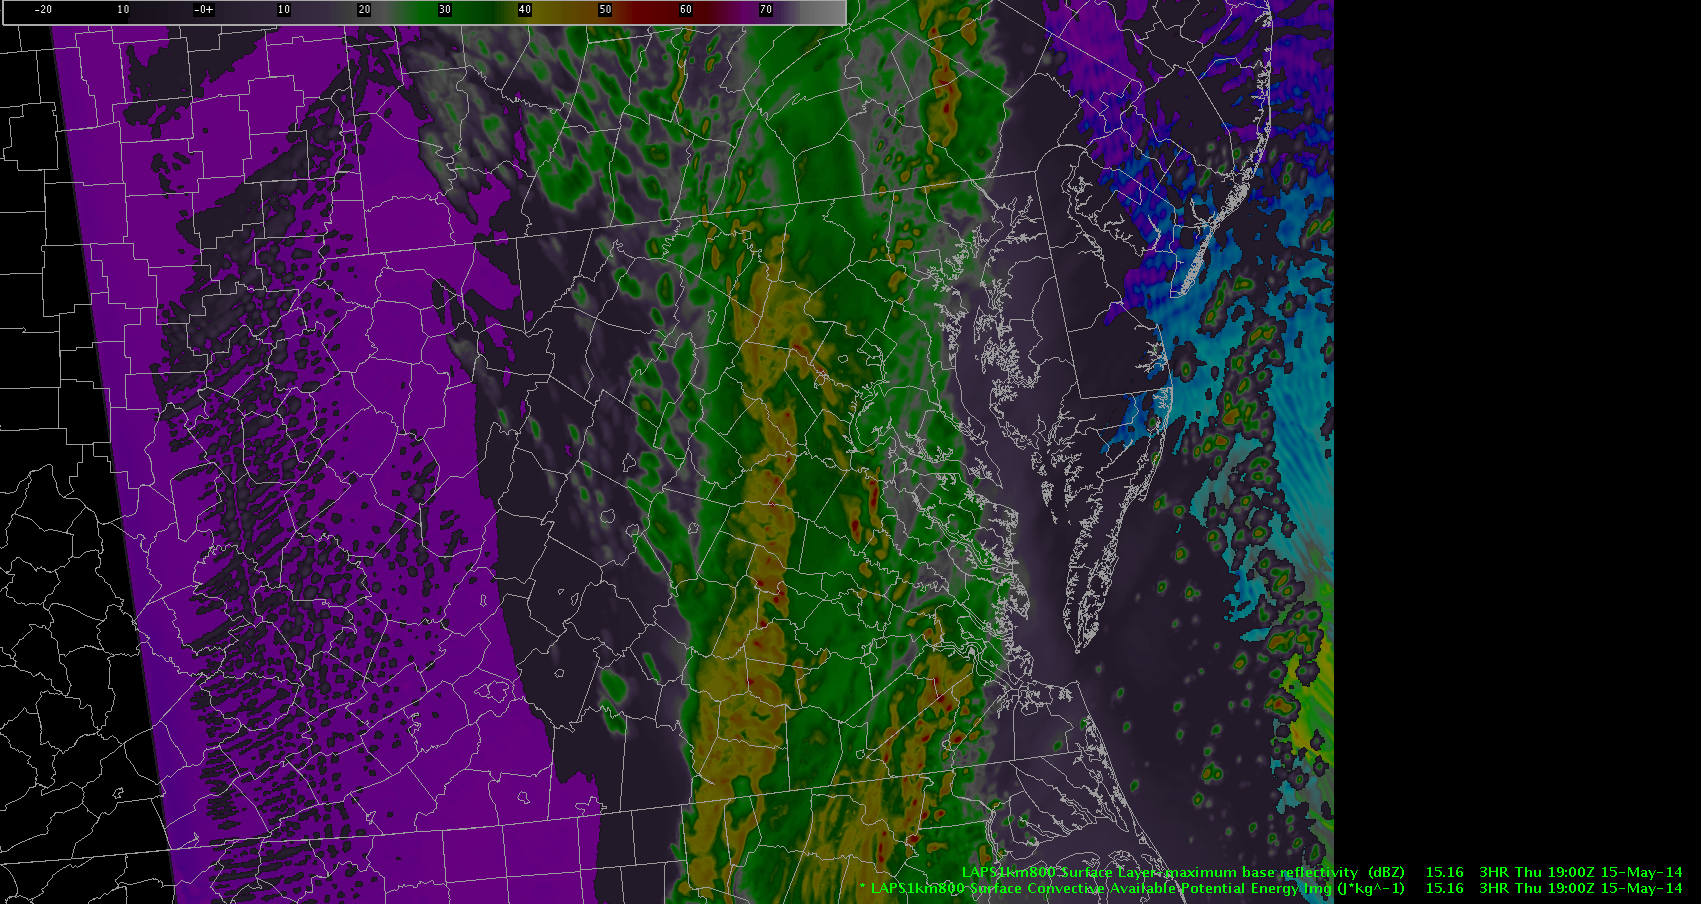
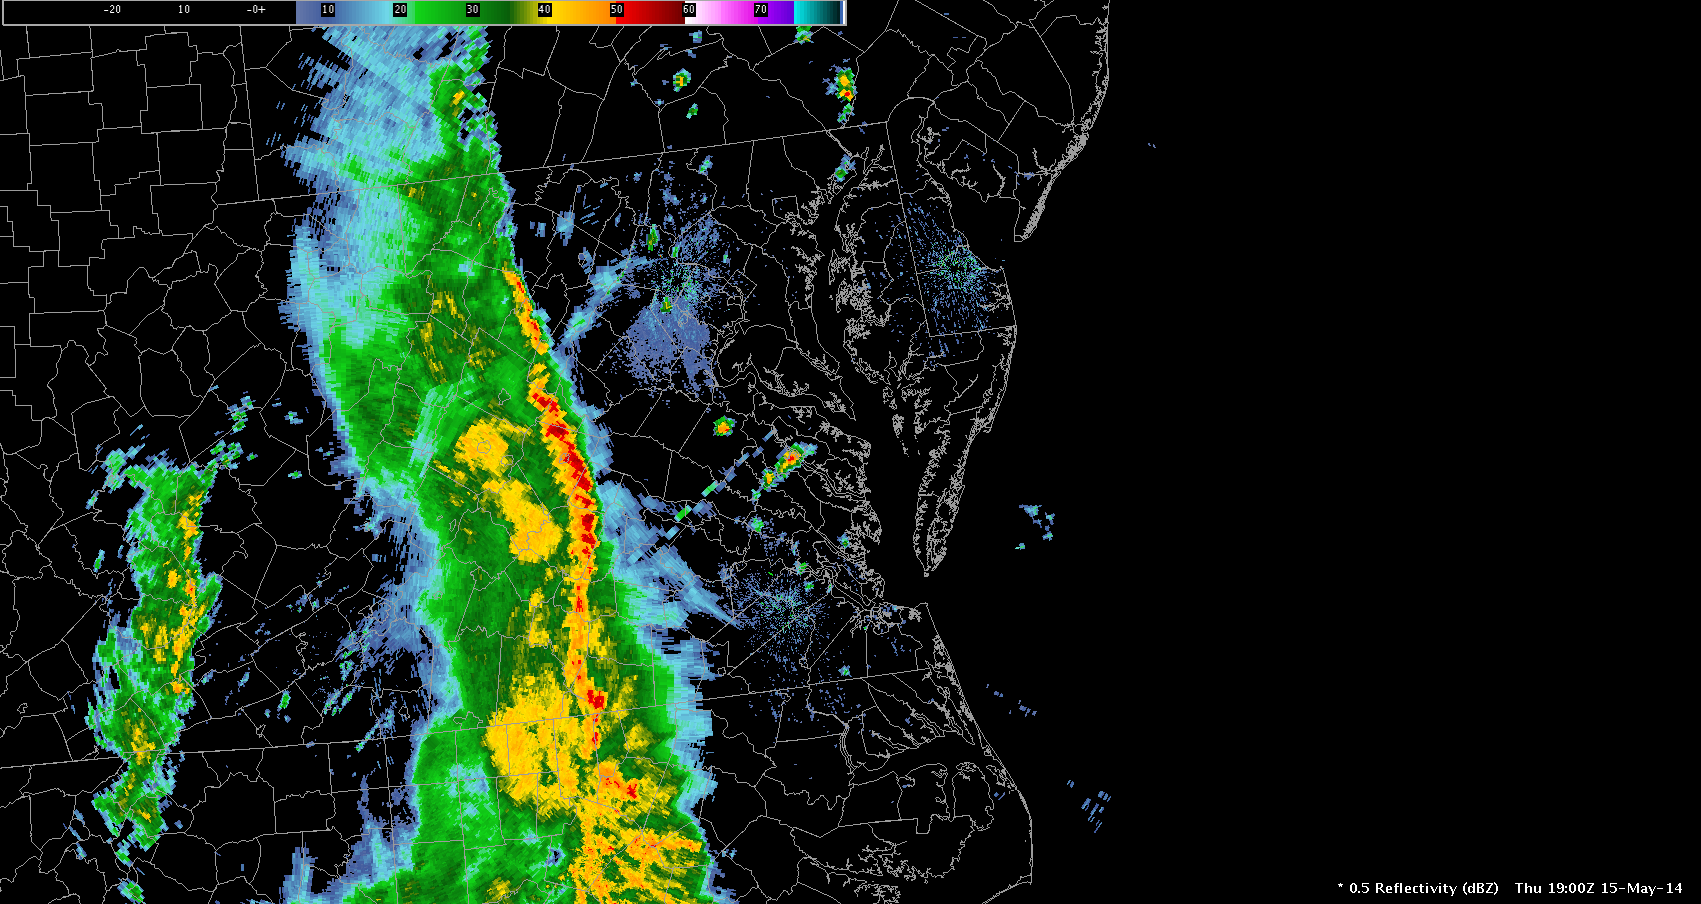
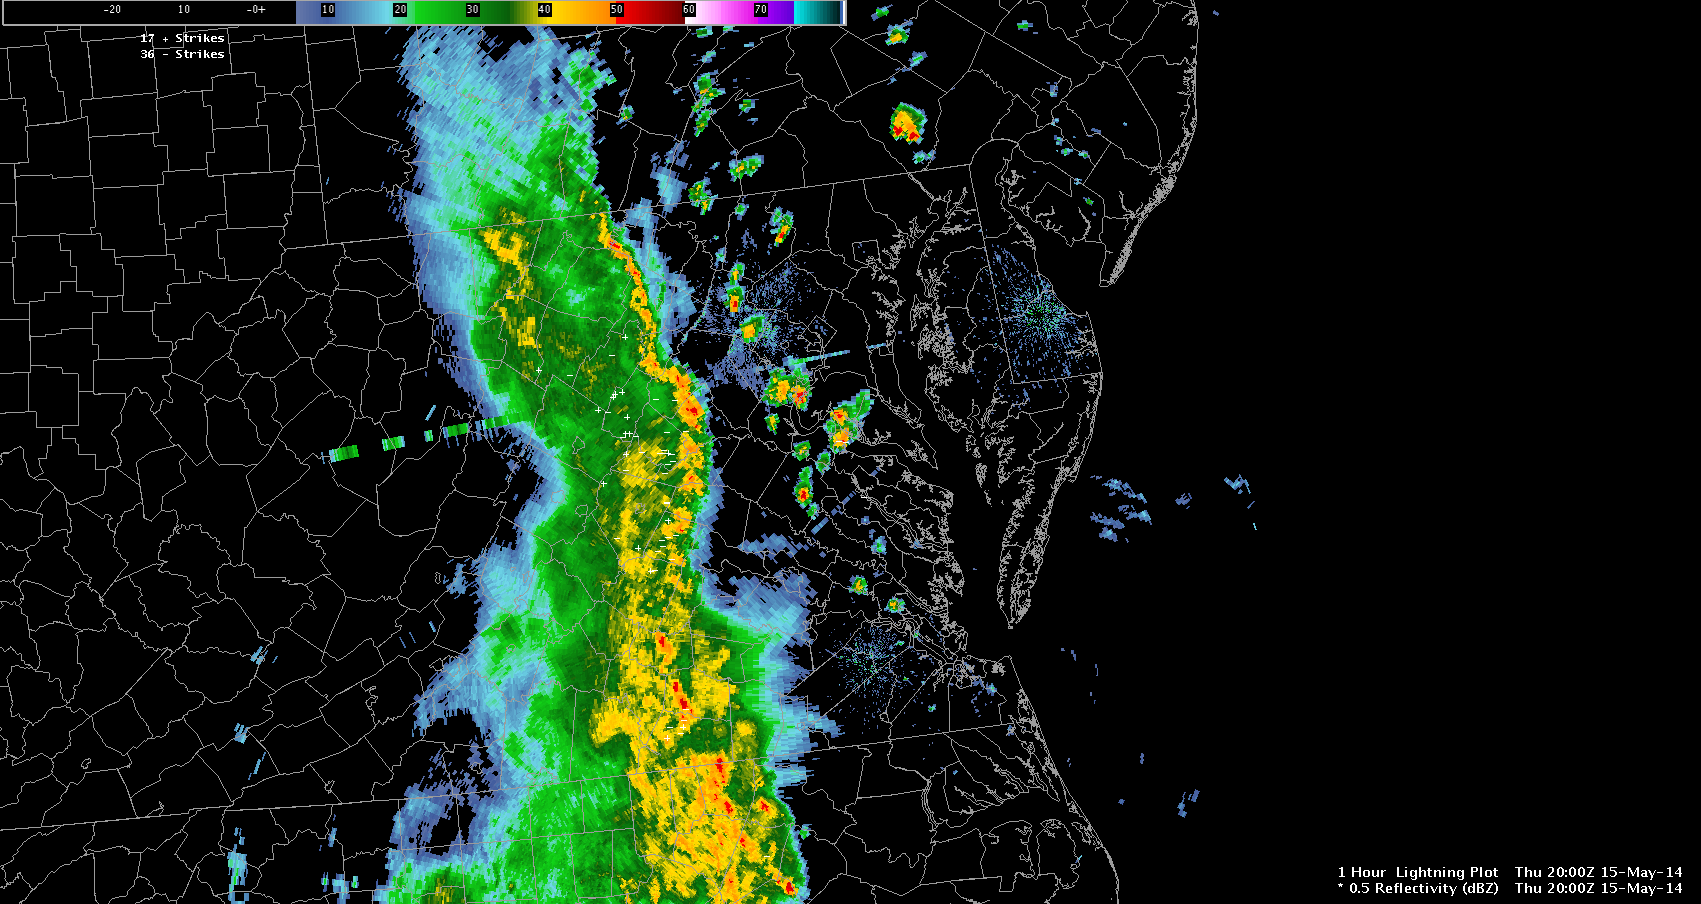
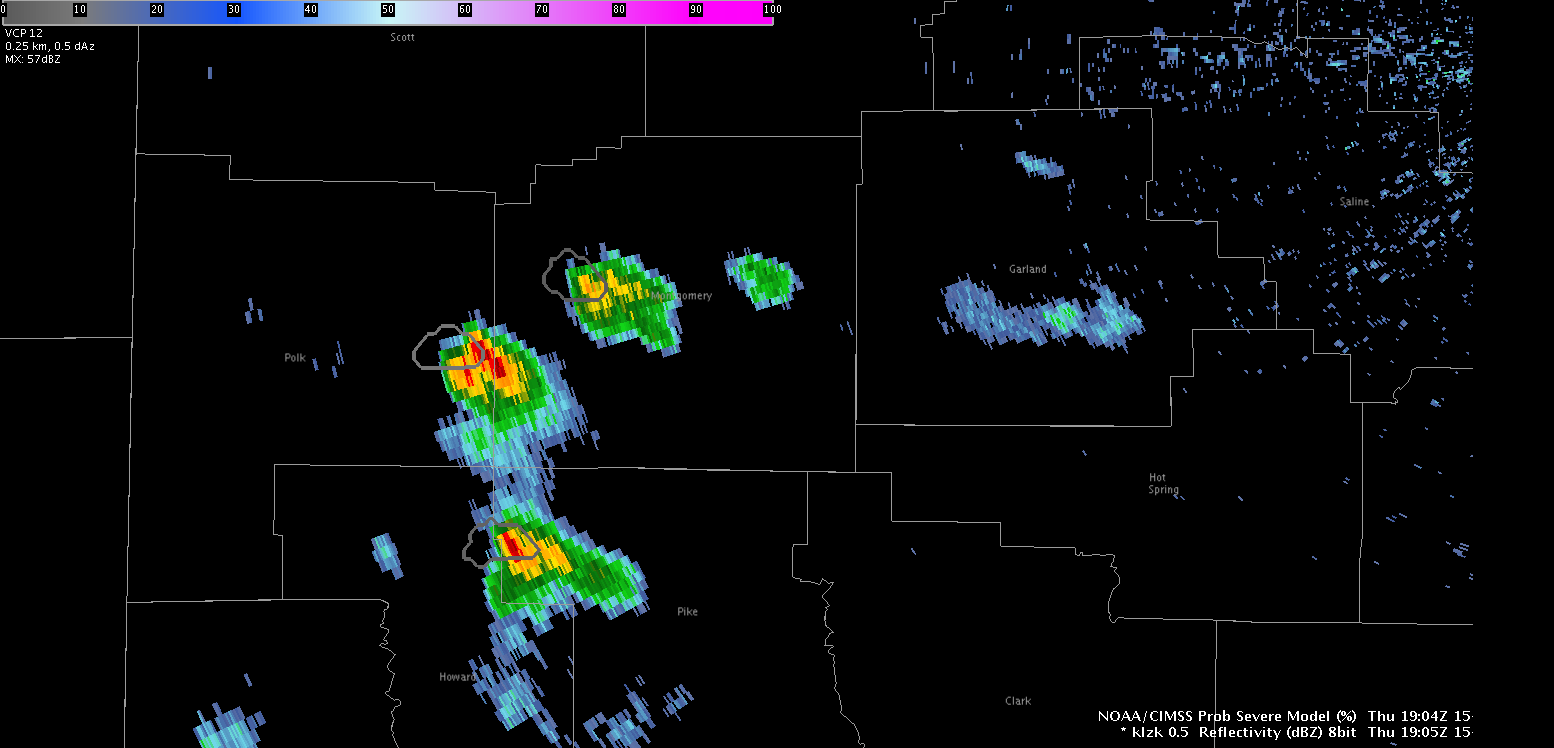
I’ve been following the performance of the OUN WRF through the day today, and thought I’d go ahead and give a brief description of how it’s doing.  Given the overall lack of any strongly convergent boundaries, these storms have just been developing under the cold core of the upper-level trough.  Therefore, you’d expect a bit of placement issues.  We see some placement issues with this convection, but overall I think the model is handling it pretty well.  It has the storm mode correct with discrete structures and bowing segments being observed both in reality and within the model.

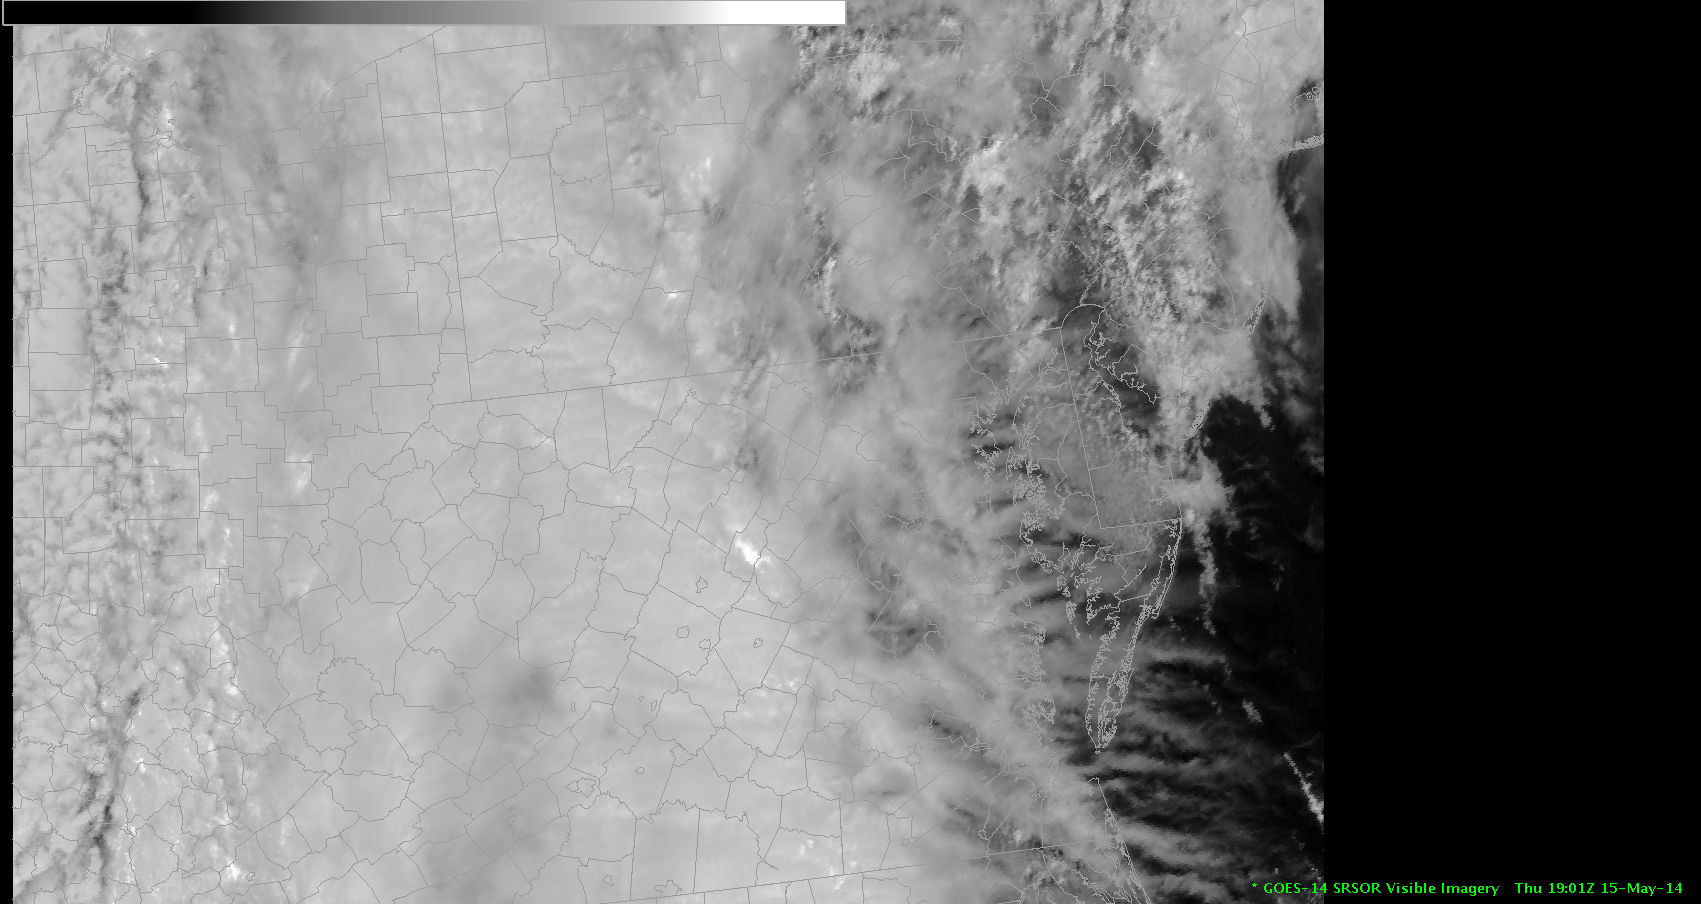
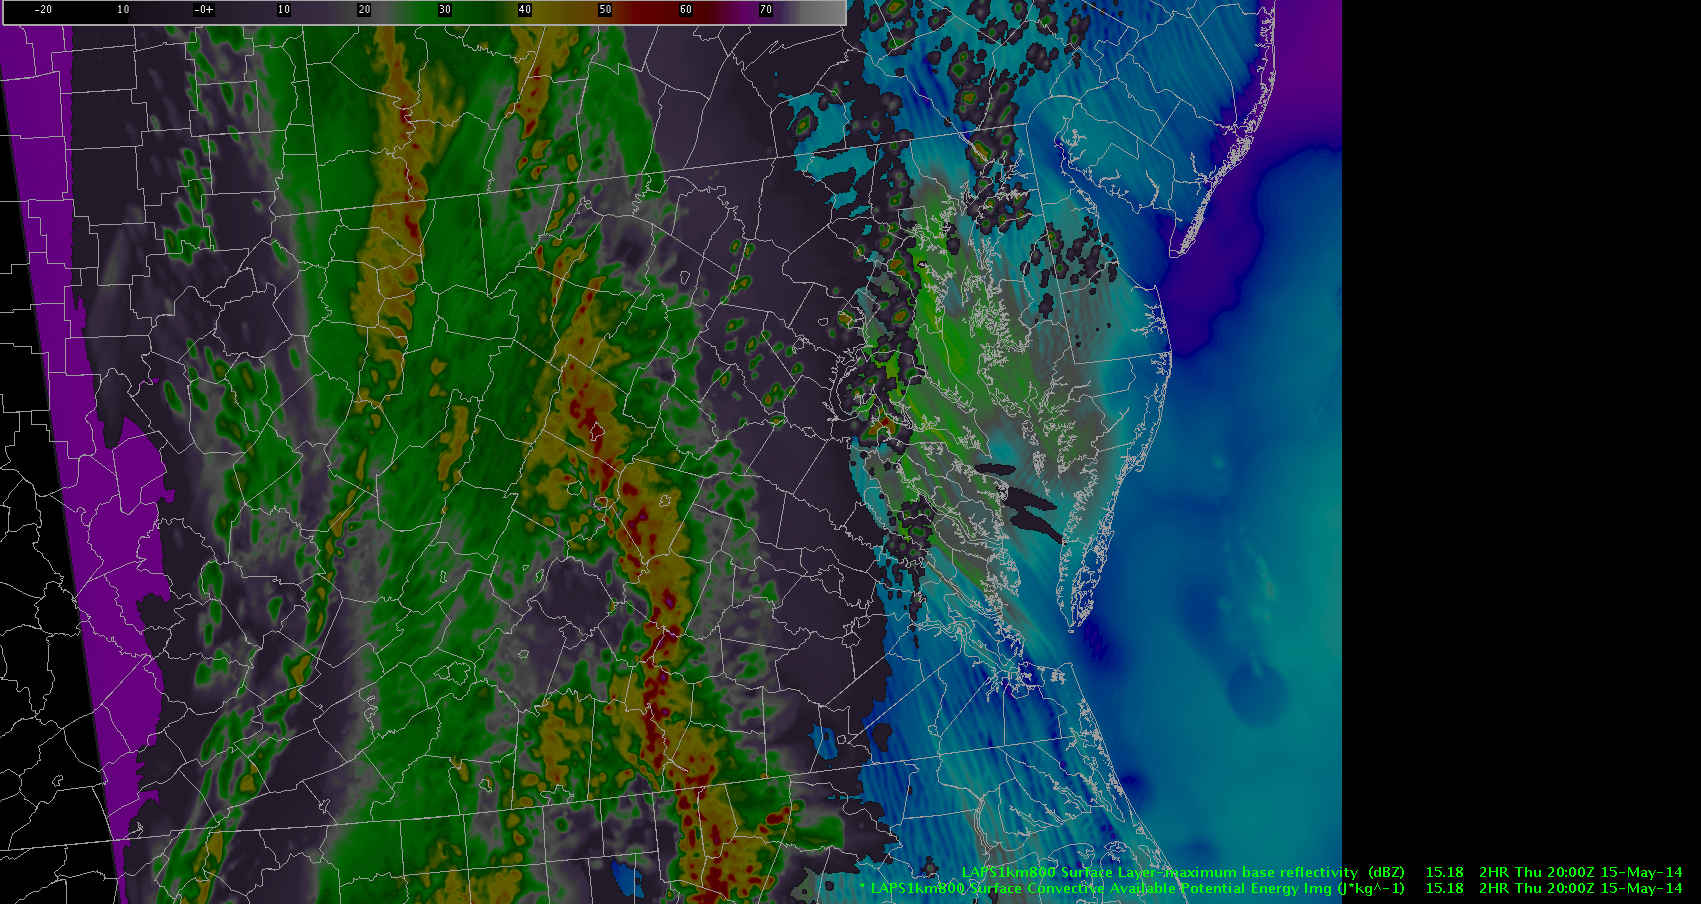
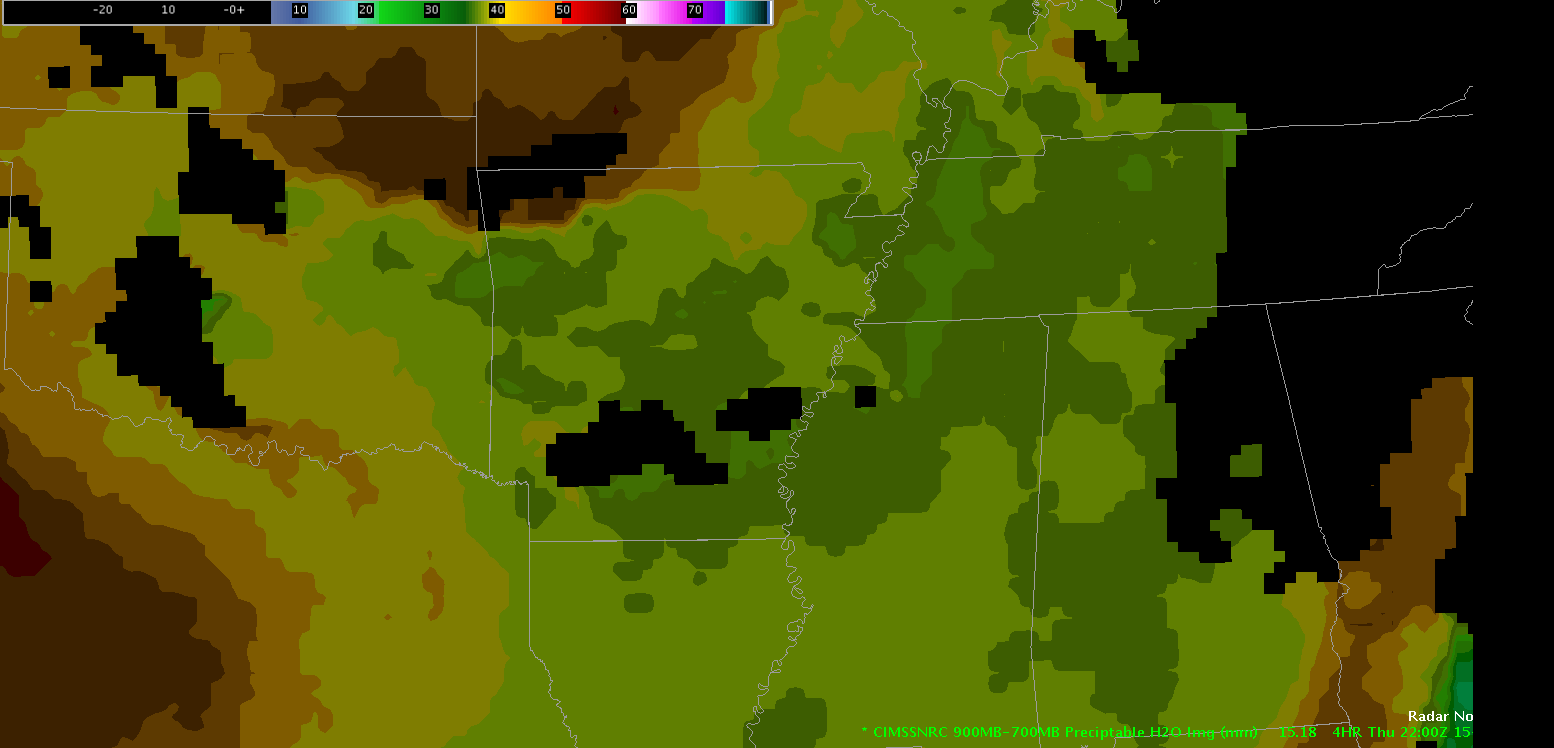
An interesting feature that the model did pick up on is the gravity waves seen across portions of OK and Texas.  Looking at satellite, sure enough there was a large area of gravity waves, with some mid-level echoes showing up with them.  Pretty cool feature that the model was able to pick up on.

Tags: None

Simulated Satellite Imagery Perspectives OK/AR on May 15

The simulated satellite imagery performed okay, generally capturing the overall IR and water vapor patterns.  The simulated IR and water vapor depicted linear convection too far south across Arkansas while the actual imagery depicted convection over northern Arkansas.  This product may be more useful for a National Centers such as SPC and WPC which cover the entire nation, but may be a bit too general for a local WFO which relies heavily on small scale features.

21UTCSimulatedSatelliteImagery051514Michael Scotten

Tags: None

vLAPS Reflectivity vs Radar

vLAPS_LWXIn the image above is the vLAPS model maximum base reflectivity is evaluated verses observed radar over the Mid-Atlantic region. The top left pane is 0.5 deg reflectivity from the LWX radar at 2017z. The top right pane shows the 2 hour forecast of the 18z run of the vLAPS model surface layer maximum base reflectivity with 1km resolution. Overall the model continues to forecast convective mode very but location is still a bit off.

The model shows a wavy convective band extending north-south to the west of Washington DC along with discrete individual cells between the line of storms and the Chesapeake Bay. Location of the band of storms in the vLAPS model is about 20-40 miles too far west. The location of the highest model reflectivity correlates with the stratiform rain behind the leading edge of the bowing line not handling the eastward progression of the bowing segments very well.

Shawn Smith


Tags: None

CI Tool Shortcomings -Thursday 1945Z

I noticed today that with the satellite out of rapid scan mode, the CI tool has not been nearly as effective.  It does not give the type of lead times that we had seen in rapid scan mode.  Here is an example:

1945Z satellite imagery with the CI tool overlayed.

In the above imagery, try to focus across the northern CWA (near the chimney region).  As you can see, very low values of CI are being detected at 1945Z.

Satellite with CI tool overlayed at 20Z.

I’ve circled the area of interest here.  By this time, there’s one small area of 50-60% dBz.  However, at this time, echoes were already beginning to show up on radar.

Satellite imagery with CI tool at 2015Z.

The probabilites finally began to expand and increase in this scan.  However, by now, the radar already had 30+ dBz echoes, which gave very little lead time to the probability of CI.  Given this is a cold core convective case, perhaps the threshold of CI is lower?  I noticed the other day 70% and above tended to result in CI, but perhaps in these type of environments the CI thresholds may be 50-60%.  Either way, it appears that without rapid scan mode, this product’s utility and ability to increase lead time to convection is greatly diminished. Below is the radar slice at 2019Z which corresponds to the latest satellite/CI imagery seen above.

Radar image at 2019Z.


Tags: None

ProbSevere not working out for bowing low-topped liner convection

LWX-probsevereWINDIn the 4-panel image above from 1955z over northern Virginia the ProbSevere model was evaluated on a low-topped bowing line of storms. The developer has noted poor performance in liner convection but wanted to evaluate its utility in storms with damaging winds.

The top left pane shows 0.5 deg reflectivity from LWX radar with the ProbSevere model shapefile overlaid. The top right pane shows 0.5 deg velocity and the lower left pane is enhanced echo tops. The mouseover shows inbound velocities of around  50kts at the nose of the bowing convective line with enhanced echo tops only to 20kft (low-topped). This line of storms is likely producing some damaging winds but the low-topped nature of the convection should preclude any hail. The ProbSevere shapefile of predictors indicated only a 1% probability of a severe storm in an environment with 620 J/kg of MUCAPE and a healthy 36.2 kts of EBShear (High Shear Low CAPE). The MESH product is likely performing well since it only indicated hail to 0.08 inches. This case further supports the lack of utility of the ProbSevere model in liner convection. However, I continue to feel that its best use is for detecting storms which can produce severe hail.

Shawn Smith

Tags: None

On the Usefulness of the GOES-R Convective 4-Panel Procedure

A 4-Panel created by Bill incorporating many of the GOES-R Products

Just a quick post to discuss the utility of this convective 4-panel.  Operationally speaking, I can forsee this procedure being quite useful as it incorporates many analysis tools.  The NearCast tool (top left) can be looked at and compared to ongoing cloud cover/convection to see if storms are forming along/near any boundaries.  In this case, you can see that convection is concentrated in the most unstable airmass, located across Arkansas northwest into eastern Oklahoma.  It is also nice to have the CI tool (top right) with this procedure to diagnose if any of these boundaries have convective potential in the near-term.  I added radar to the bottom-right panel in order to see convective trends and whether or not CI is actually occuring in some of the areas highlighted by the CI tool.  In this case, the overshooting top tool did not have any detections, but would also be of use with more robust convective elements.  Overall, I think this procedure will be of operational use, especially once GOES-R is actually launched and these products increase in overall utility.

Tags: None

OUNWRF Wind Gust Speed – Will it Verify???

The 18 UTC run of the OUNWRF Wind Gust Speed for 21 UTC is depicted below.  From the model output, it appears that numerous wind gusts 30-40 kt will occur with a developing line of storms in Arkansas, just north of Little Rock.  Will it verify?  So far as of 2024 UTC, no significant wind gusts over 30 kt have been reported.

Update: There was a 50 mph report with downed power lines in Malvern southwest of Little Rock at 350 pm CDT (2050 UTC).  The OUNWRF Wind Gust Speed product suggested this potential for strong winds, however the location was way off.

21UTCWindGustSpeedOUNWRF051514Michael Scotten

Tags: None

Checking the vLAPS model initialization

The line of storms heading toward the DC area is showing up on the vLAPS model 800×800 grid. This is the forecast for max reflectivity at 19Z:vLAPSmaxrefl19ZMay15


It shows moderate rainfall over DC itself, with heavy rainfall to the west. Max values on vLAPS (in red) were between 50-55 dBZ. At the time, the line of rain and storms was further to the west, and it was not raining in DC yet. However, some small convective showers were starting to  show up in front of the longer LCS line.

Baseref19ZMay15As you can see, the spatial coverage of the rain is way overdone on vLAPS at this point, and the line of convection is too far to the east as well. It might be the cloud cover that’s causing a problem for LAPS. You can see how heavy the cloud deck is on the rapid scan GOES visible imagery:

GOESrapidvis19ZMay15At some point, I’m not sure exactly when because I was on this side blogging :-)… but the model re-initialized and looked much better. This is the 20Z forecast for max reflectivity on vLAPS:

LAPSmaxref20ZMay15Notice how much further west the line of storms is in the frame above. It compares better with the actual base reflectivity:

Baseref20ZMay15… but now, it seems that the model has over-corrected. The storm line is now too far west by about 50 miles. Unfortunately, it looks like the vLAPS is not going to be initialized well enough to aid in severe forecasting today.

At our meeting earlier this afternoon, vLAPS developer Hong Le mentioned that it takes an hour or two for the model to completely switch over to its new environment once its coordinates have been moved. Was there still some bad data lingering in the system that caused the speedy FROPA earlier in the afternoon? Or, did the model need time to “catch up” to the new initial conditions in this 800x800km region? Or was there another reason altogether?


Tags: None

ProbSevere Too Low in Cold Core Low Events with Low CAPE/Marginal Shear

The top image below depicted a few marginal severe storms in western Arkansas,  The storm of interest is the one farthest west between the two other cells that were located slightly to the east.  ProbSevere gave this storm 9% chance of being severe in an environment with 898 J/kg, 27.4 kt of ENShear, MRMS MESH of 0.53 in, 1.27%/min normal vertical growth rate, and 0.03/in glaciation rate.

This storm produced quarter size (1 in diameter).  MESH underestimated the hail size in this case.  I (as well as the WFO Little Rock) did not issue a warning of this storm thinking the hail size was a bit smaller (closer to pennies – 0.75 in or nickels – 0.88 in).  The environment was characterized by the 12 UTC LZK (Little Rock) sounding below (bottom image) with a freezing level of 6579 ft AGL and -20C level at 15572 ft AGL, conducive for the development of hail.

The ProbSevere seemed to be too low in this case, only with a value of 9%. I would personally estimate the ProbSevere closer to 30 or 40% for this storm, especially considering that the reflectivities 16-17 kft AGL were 55-60 dbz (I typically use 60 dbz or greater at the -20C level as a proxy for issuing severe thunderstorm warnings for large hail.)

1905UTCLZKRefProbSevere12UTCLZKSounding051514Michael Scotten


Tags: None

CIMSS NearCast 900-700mb Precipitable Water Maximum Values in Arkansas – Similar to ThetaE Diff Post

The CIMSS NearCast 900-700mb Precipitable Water product depicted a maximum of values 7 to 9 mm at 19 UTC on May 15 in southwest Arkansas (top image).  The next two images of this variable depicted at 22 UTC and 24 UTC have this minimum area moving east southeast into southeast Arkansas around 22 UTC then northwest Mississippi by 24 UTC.  I wonder if storm development will follow this minimum area for the next few hours.  If so, the NearCast forecast tool would be especially useful in near term forecasting (1-6 hr) and can give forecasters a heads up where and when convection occurs.

This post is very similar to the ThetaE difference post.

19UTCNearCast900-700mbPW051514 22UTCNearCast900-700mbPW051514 24UTCNearCast900-700mbPWMichael Scotten

Tags: None