A CI Update

Remember that screen capture of the 90% probability of convective initiation over Lawrence County, IN at 2130Z? By 2248Z, a decent cell had popped up in the NE corner of the county. Not sure if this necessarily verifies the product or not (after talking with the product’s contact here), but it does instill some confidence on using this product in the future.

2248Z_KIND_ref~Linda

Tags: None

Many False Detections on CI at Night

nighttime_ci

As of around 23Z we have switched over to CI for overnight detection. The false detections appear to increase once this switch happens. There still appeared to be some utility though as it highlighted area over southeast WY that developed, but one would need to use it with caution overnight.

-JB

Tags: None

Simulated Satellite Demise of Storms

simulated_ir_demise

The long-lived supercell that moved from the DEN area into northeast CO appear to be weakening as of 2330Z and the forecast simulated satellite data did well in forecasting not only the initiation of the convection, but also in the early demise in northeast CO.

-JB

Tags: None

Overshoot Top to Indicate Strong Storm

Overshooting top to predict severeI was using the Overshooting Top application and it showed one over the one storm for a couple of updates.  This led me to believe it had a strong updraft and then I looked at Prob Severe and it also trended up so I was going to issue a severe t’storm warning.  Now I want to see if this verifies.  ~ Vollmar


Tags: None

Simulated Satelite imagry from earlier.


WRF Simulated Satellite imagery from around initiation time. Initiation time for the simulation was running about 30 to 60 minutes delayed from reality. Not Good but Not bad if the WRF data arrived more than 1 hours early. I also want to point out that it did capture the main storm of the day and roughly the correct placement for initiation.

May21st 2258Z-1

First hints of initiation in Reality 1915Z.


May21st 2258Z-2

First hints of initiation in WRF Simulation 20-21Z time frame.

Grant H.

Tags: None

LAPS vs. MRMS Reflectivity

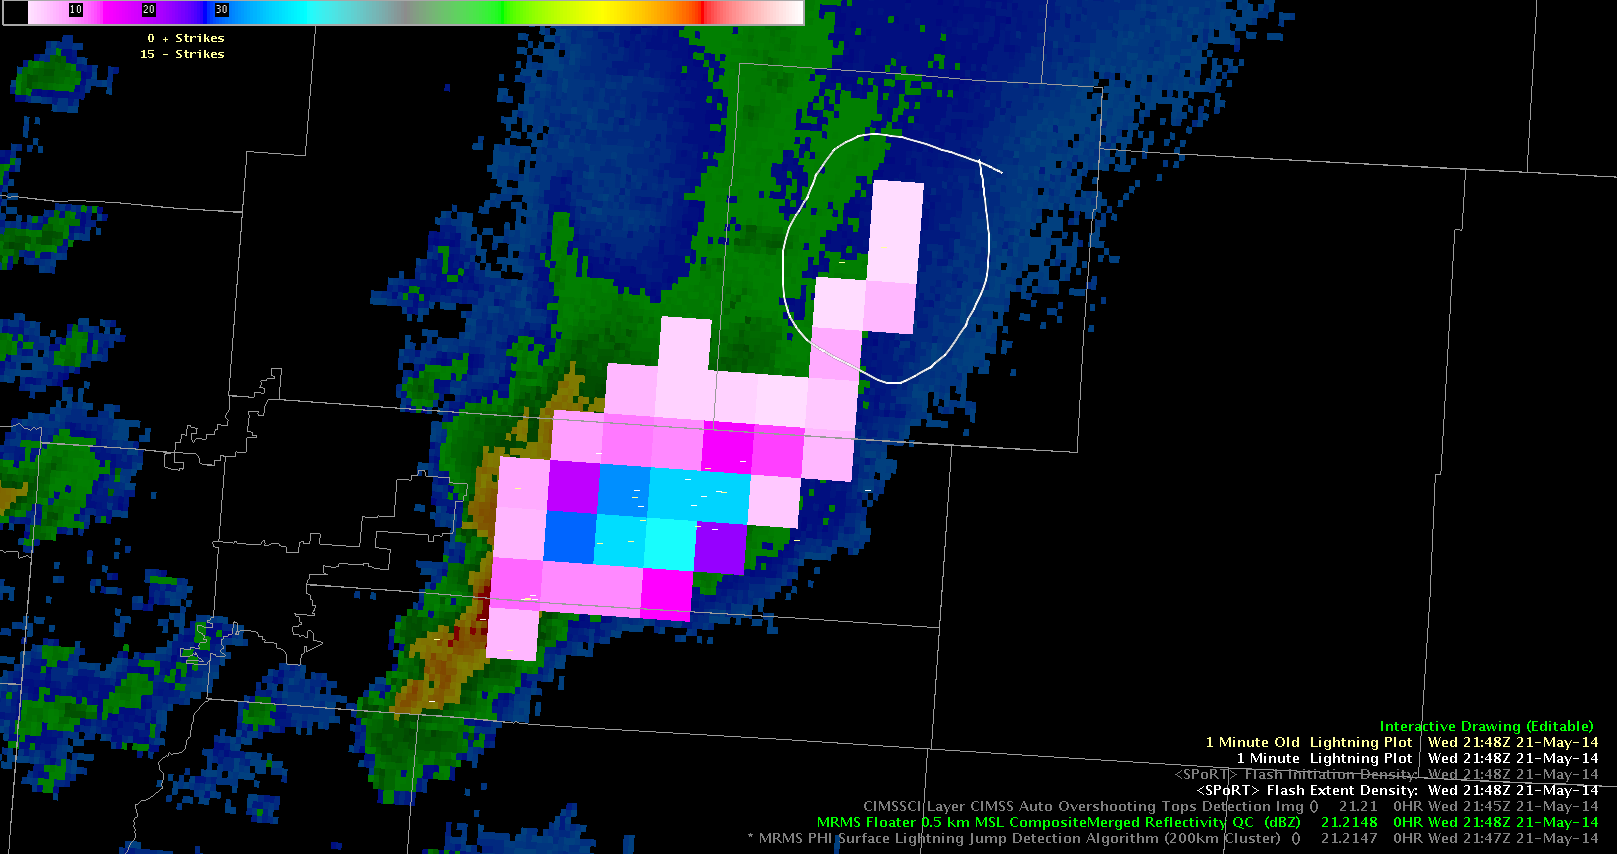
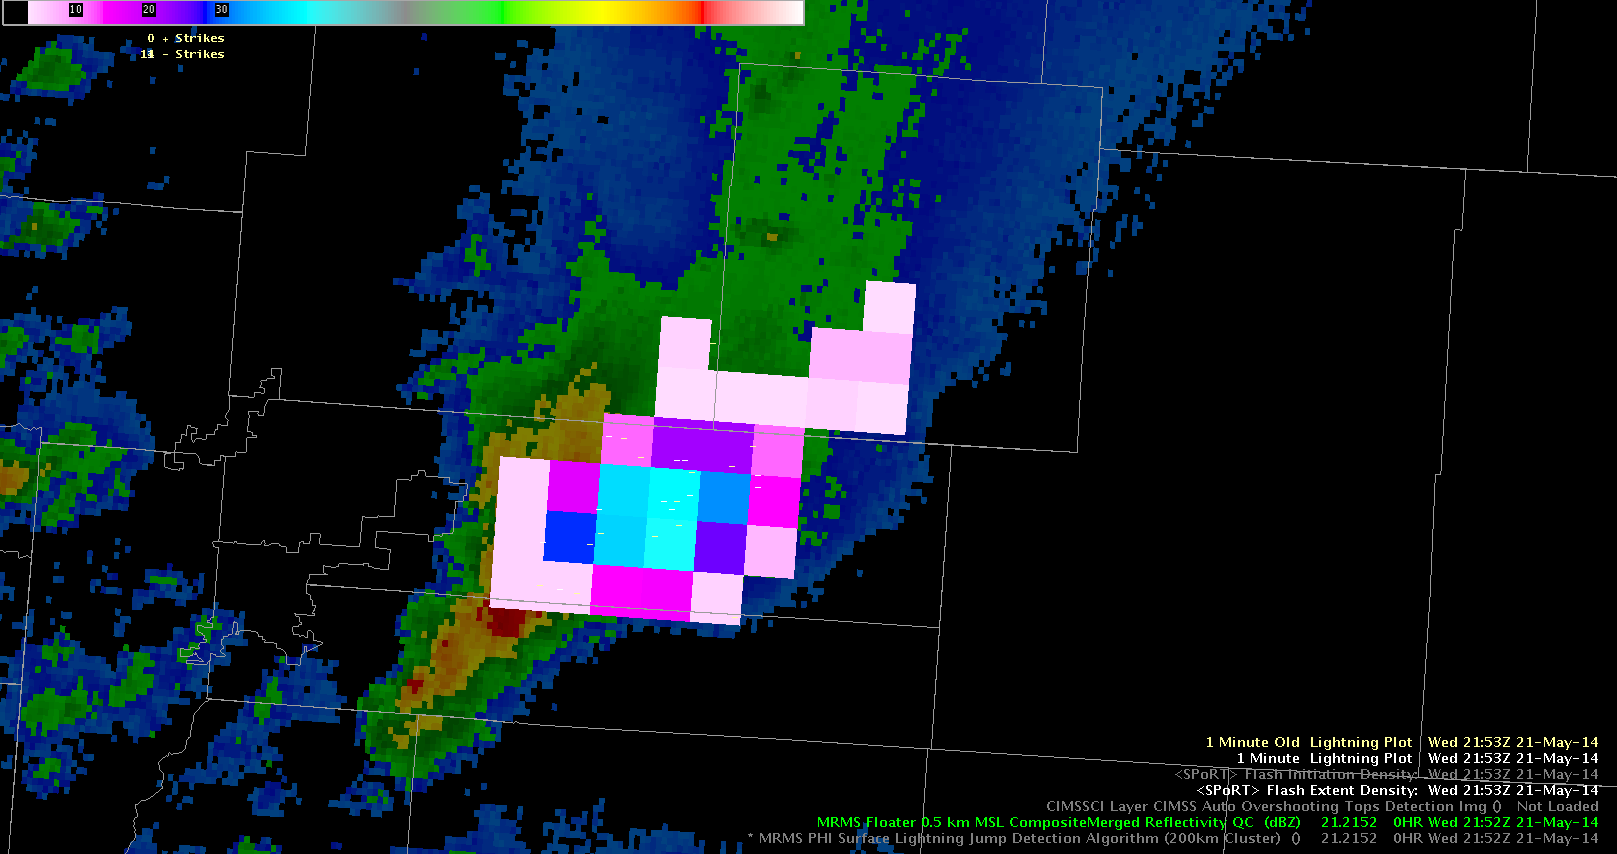
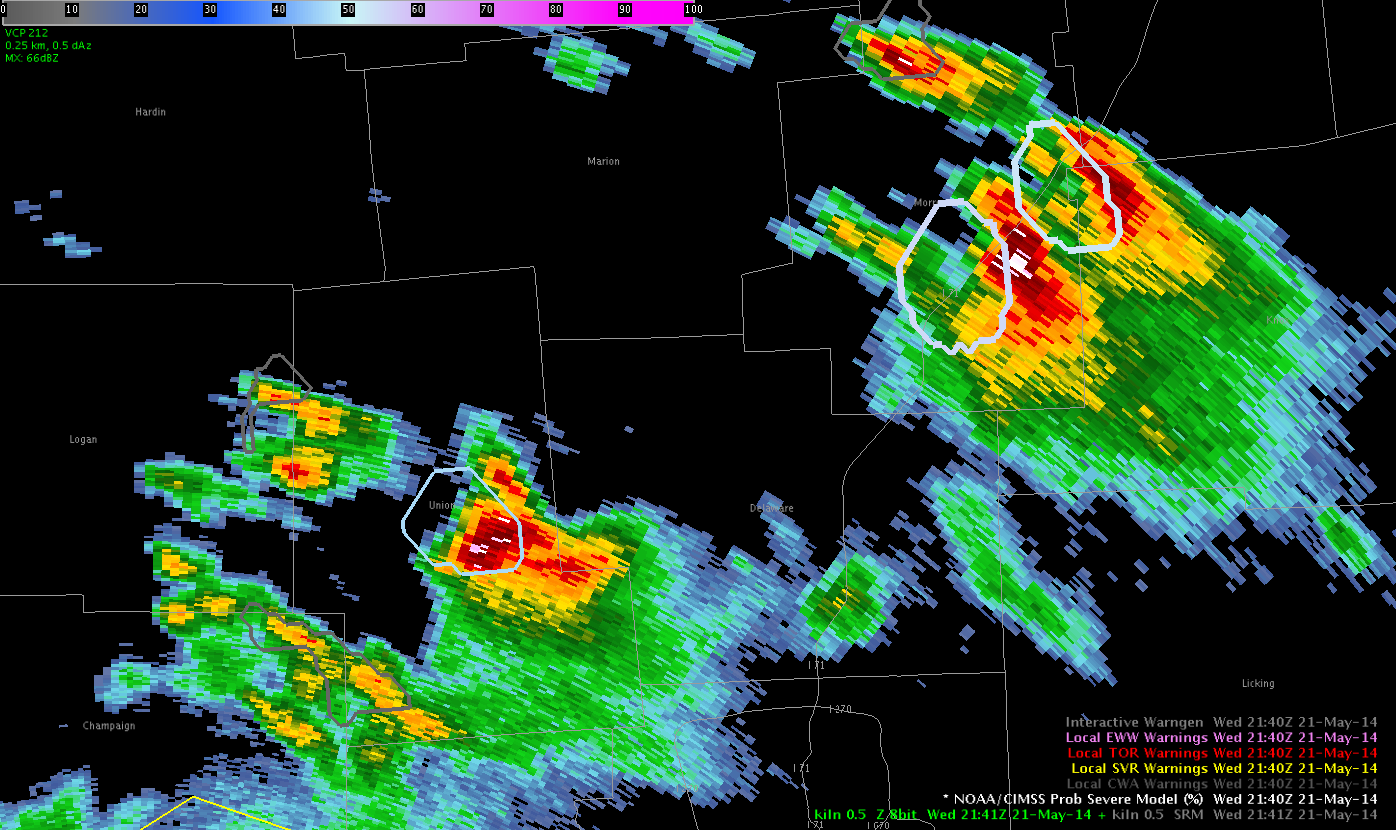
Attempting to give a mesoscale environment update for my warning partner, I pulled up all of the LAPS products available in the 800×800 domain. The 20Z run is the latest available data and the ongoing storms (as of 2230Z) are depicted to be in a decent region of surface CAPE (>2000 J/kg), practically no CIN, and high pockets of surface and 2-5km instantaneous updraft helicity on the front edge of the broken line of convection. When I analyzed the LAPS’ max base reflectivity product and compared it with real-time MRMS composite reflectivity, it does okay in the 2.5-hour forecast in depicting a general region of convection stretching from east-central Illinois ESE toward the IN/OH/KY borders. The model is spatially displaced slightly but at least captures the general overview of the current setup.

2230Z_LAPS_maxref2230Z_MRMS_compref

Moving forward to the 4-hour forecast (00Z), LAPS forecasts the following:

00Z_LAPS_maxref

If LAPS data is to be used to enhance near-term mesoscale forecasting, I personally would like to see some additional fields, such as wind, etc.

~Linda

Tags: None

Tracking tool. Just not ready for prime time.

May21st 2234Z

Gave the tracking tool a second chance today.  Bad results. It appears to be a computational issue. I had loaded a 60minute Composite Reflectivity off of MRMS for it to compute. It allowed me set up the circles nicely… however when it started graphing it would only display 2 minutes of difference on the graph initially. About 3 to 5 minutes later It was displaying  4 minutes, 3-5 minutes later it was displaying 6 minutes. So 2 minute increments.

All panes were active while I was grabbing this first screen shot. However, while realizing that both panes were not in the shot; I went back to grab screen shots of the meteogram itself, and discovered that all panes had locked up. A couple minutes later All of CAVE had crashed as if the system had run out of memory.

Grant H.


Tags: None

Anvil Flashes in PGLM

circle_2148UTC2552_fed_anvil_wnldn

Here are two examples (2148 UTC and 2153 UTC) in northeast CO of how PGLM can be used to detect flashes that propagate long distances into the anvil of storms.  Above is 0.5 km reflectivity, with flash extent density (FED; colored boxes) and NLDN strokes (minus signs).  The highest concentration of flashes is near the updraft core (42 flashes min per pixel), however, note how the flash extent extends well into the anvil region of the storm.  This highlights a region where lightning potential exists.  In the top panel, two NLDN flashes occur in the circled area and in the bottom panel, extensive anvil flashes are noted, but no NLDN information exists in the region where the PGLM shows flash propagation.

Chris S.

Tags: None

Warnings based on Prob Severe

ProbSeverewithRadar


I used the Prob Severe tool today and watched the trends for some of these storms.  It was intensifying the storm each update by 10% and once it got above 60% I warned it.  Sadly the next two updates the storm weakened and so I feel a little let down by Severe Prob.  I may not have needed to issue in the first place.

Tags: None

Missed Hail Event: PROBSVR and MRMS Data

1 inch hail was reported in Union County OH around 2130Z.  The PROB-SVR maxed at 47% a few minutes later and was about 30% at the time of the vent.  MEHS briefly peaked at .7 inches.  However, numerous signatures within both of these products have moved over populated areas without producing severe weather reports.  It seems to be fairly tricky today to get a bead on the severe/non severe thresholds for various experimental products within the ILN CWA.

21May2014-2140Z-PROBSVRBR1

– JRM


Tags: None