Pickles – 5-18-2015 21z

Increasing moisture and heating to the south of a cold front across western texas (Fig1)…and 35-40 kt 0-6km shear making for an increasingly favorable environment for some strong to severe storms to develop off the mountains. These are being fed by a low-level se flow feeding in MUCAPE’s ranging from 1500 to 3000 J/KG from se portions of the CWA towards mountains. This trend is noted in GOES R derived moisture/instability products. Note: The discontinuity in the GOES R instability fields…likely due to the product below being disturbed by cloud cover from convection. (Fig2) Latest GOES R CI prob are showing greater than 60 percent prob for convective initiation for severe cloud elements(Fig 3)…while Latest NOAA/CIMSS prob severe model showing greater than 90 percent severe potential for shown storms east of radar. (Fig4) So…prepare for increasing potetnial for severe storms over the next couple of hours.

FIG1screenCapture

FIG2

CAVEDrawing

FIG3

CSI

Fig 4.

pronsvr model


Tags: None

Nearcast Model Aids Destabilization Situational Awareness

In assessing the Midland, TX forecast area destabilization forecast, the Nearcast model differential theta-e product provided a good visualization of the next several hours. Low-level southeasterly flow over srn TX was forecast to bring higher dewpoints (10-12F) into the srn Midland TX forecast area through the day. The Nearcast model provided another opinion/visualization of the advective process, as well as both the relative magnitude (geographically) and the northern extent of the instability through 02Z.

As a forecaster, this 1) added to the confidence of destabilization 2) allowed me to better visualize the 3D atmospheric changes expected on this day and 3) concentrated my SA to the srn forecast area.

NearcastMay18_18z

Rocky Balboa

Tags: None

EWP Week 2 Summary (May 11-14, 2015)

The second week of the EWP is in the books with forecasters participating from the San Diego, Eureka, Huntsville, Sterling and Norman WFO’s, as well as a broadcast meteorologist from NBC4 Columbus, OH. In the early part of the week, forecasters were fairly spread out across the country with operations in Sterling, Tampa Bay, Pocatello, Wilmington, and Louisville. With the ridge building in the center of the country, our operations domain became much smaller as we moved to Texas for the latter part of the week. The WFOs worked in Texas included Houston, San Antonio, San Angelo, Midland, and Lubbock. Overall, forecasters had a good mix of forecasting/warning on convective modes and time scales. Similar to last week, we were able to evaluate the entire product suite of GOES-R and ENI products.

Below is a synopsis of feedback for the GOES-R products:
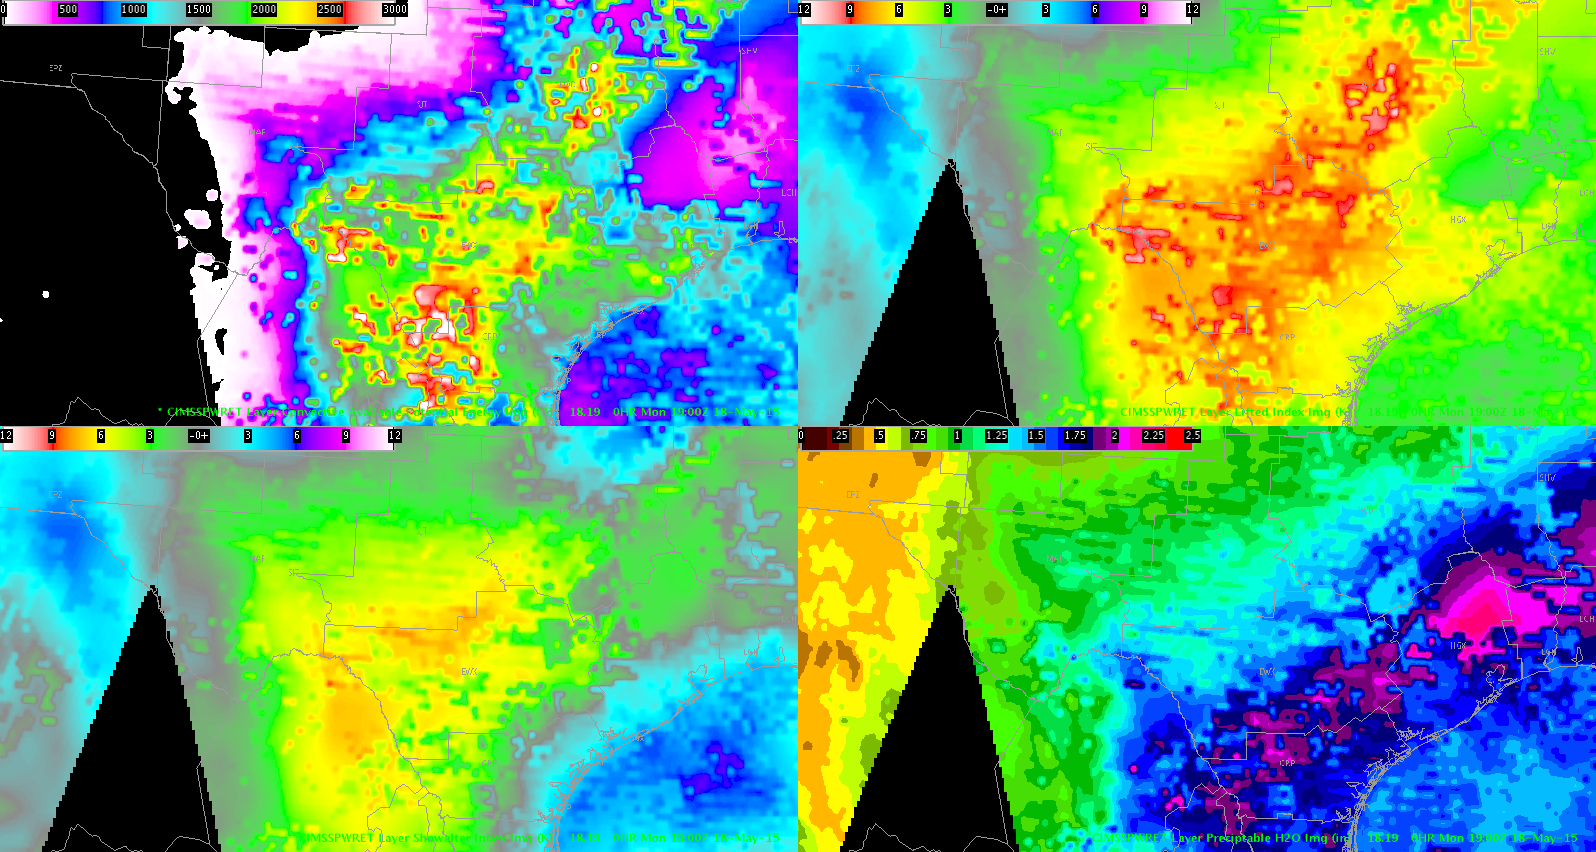
GOES-R LAP
– The striping and blotchiness/unnatural extreme gradients lower my confidence in these products. It would be great if this issue could be resolved.
– At the beginning of shift yesterday, the CAPE and PW gradients seemed to match up well with the dryline via surface obs.
– The cell that developed behind the dryline in a stable atmosphere as indicated by LAP CAPE remained sub-severe.
– I wouldn’t use it by itself, but I would compare and contrast to SPC meso page and LAPS to boost confidence.
– It was most useful to pay attention to the gradients and trends in the fields. Most often, convection developed along these boundaries and in areas of increasing instability/moisture.
– The PW fields, including the three layers, were nice to have. I had most confidence in this field.

NUCAPS
– It was cumbersome to have to modify the surface conditions with most profiles. It would be nice if this process was automated.
– QC flags would be helpful to have so we know with confidence which profiles to trust.
– It would be nice to have the ability to sample the green dots for information such as QC, instability, moisture, etc, giving you some quick information about those soundings.
– The profiles are smoothed out, but they still give you unique information about the environment.
– I liked that it is observed sounding information
– The timing is great (between 12z and 00z RAOBs).
– I see this having utility for my office over ocean on west coast.
– We would definitely use it in our office.
– I look forward to using this during the winter season
– There were a couple cases throughout the week where the NUCAPS soundings showed instability, and convection developed/strengthened as it moved through that area
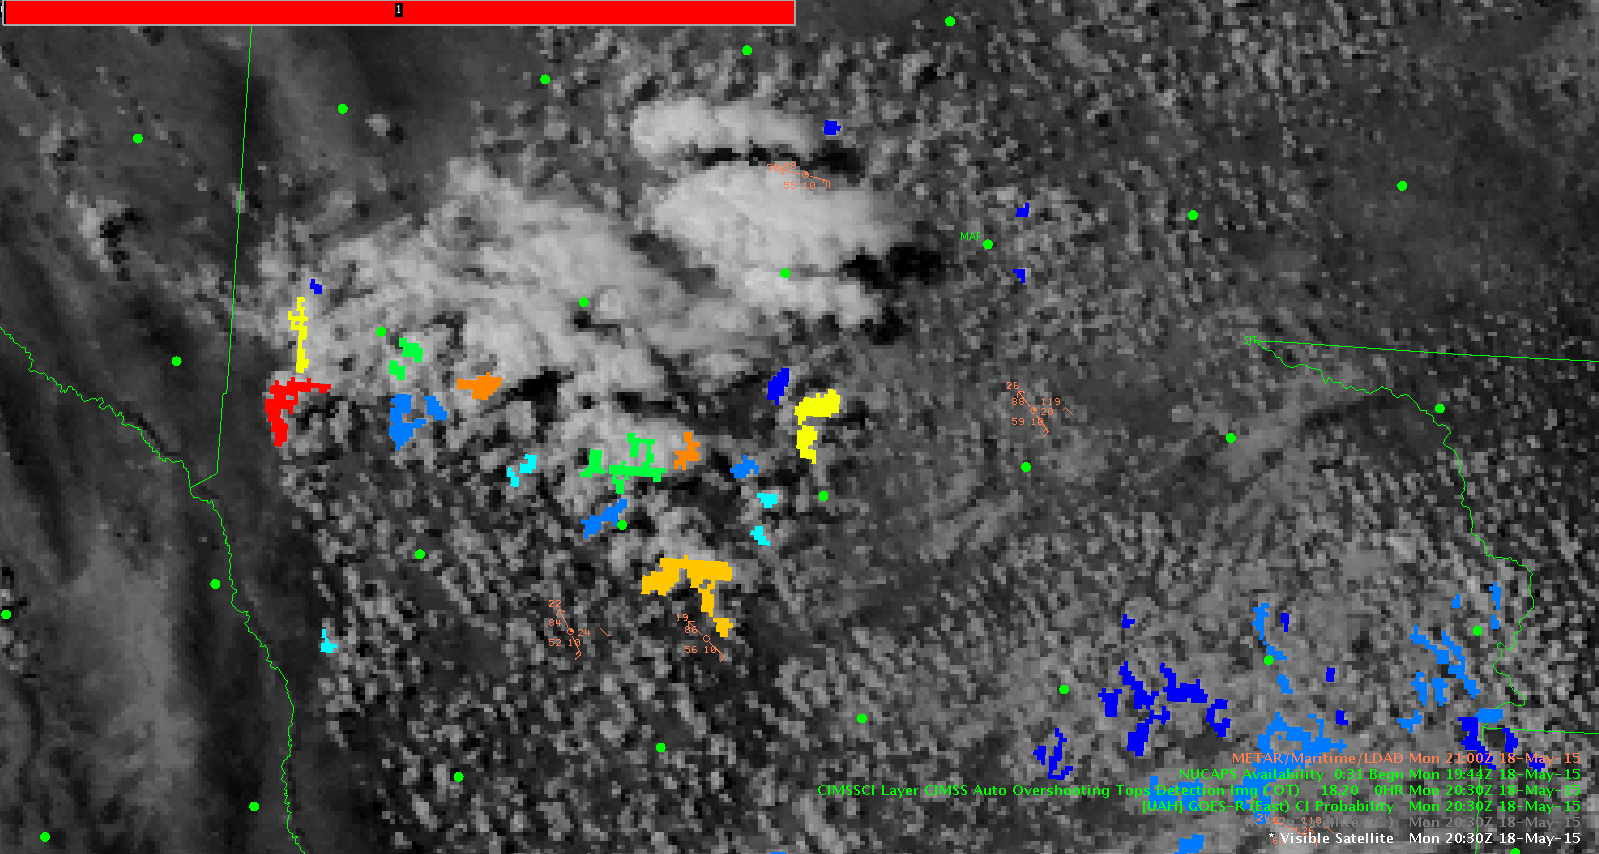
GOES-R CI
– I wish it was better through cirrus
– I would like it if you could somehow signal why the probability is going away. Is it because the storm has reached the necessary degree of maturation, or because that cloud is no longer expected to initiate?
– I look forward to using it with routine 5-min imagery in the GOES-R era. I think that will definitely make the algorithm more useful and display less messy.
– For me, broadcaster, it was the most useful tool. It gives me a quick look at where convective activity is most likely in the near future
– I provides information we don’t already have
– I was most useful when I monitored trends over a certain area, as opposed to trying to track individual cu
– I think it could even be put on tv
ProbSevere
– SigTor might help with tornado environments, DCAPE for high wind.
– Having a time series would be helpful to see changes in probabilities through time. It is pretty easy to follow as is, but a times series would just add to it as an alternative method of visualizing past tendencies
– Definitely performed best as a hail predictor
– We had slam dunk, hail days this week, so it will be interesting to evaluate it with lower end and non-hail days
– In Florida, I used it to indicate a wind threat with a collapsing cell by looking at decreasing probabilities in probsevere. The storm did result in some wind damage. If you know environment might be conducive to microbursts, and see probsevere falling, you might want to have elevated awareness for an imminent damaging wind threat
– I am a fan of the descriptive words in the readout (weak, mod, strong).
– Satellite input field’s added lead time when we had the satellite information previous days. Lead time was lessened when we didn’t have the satellite information because of cirrus yesterday.
– A different color scale might be necessary for WR, where probabilities were much lower.
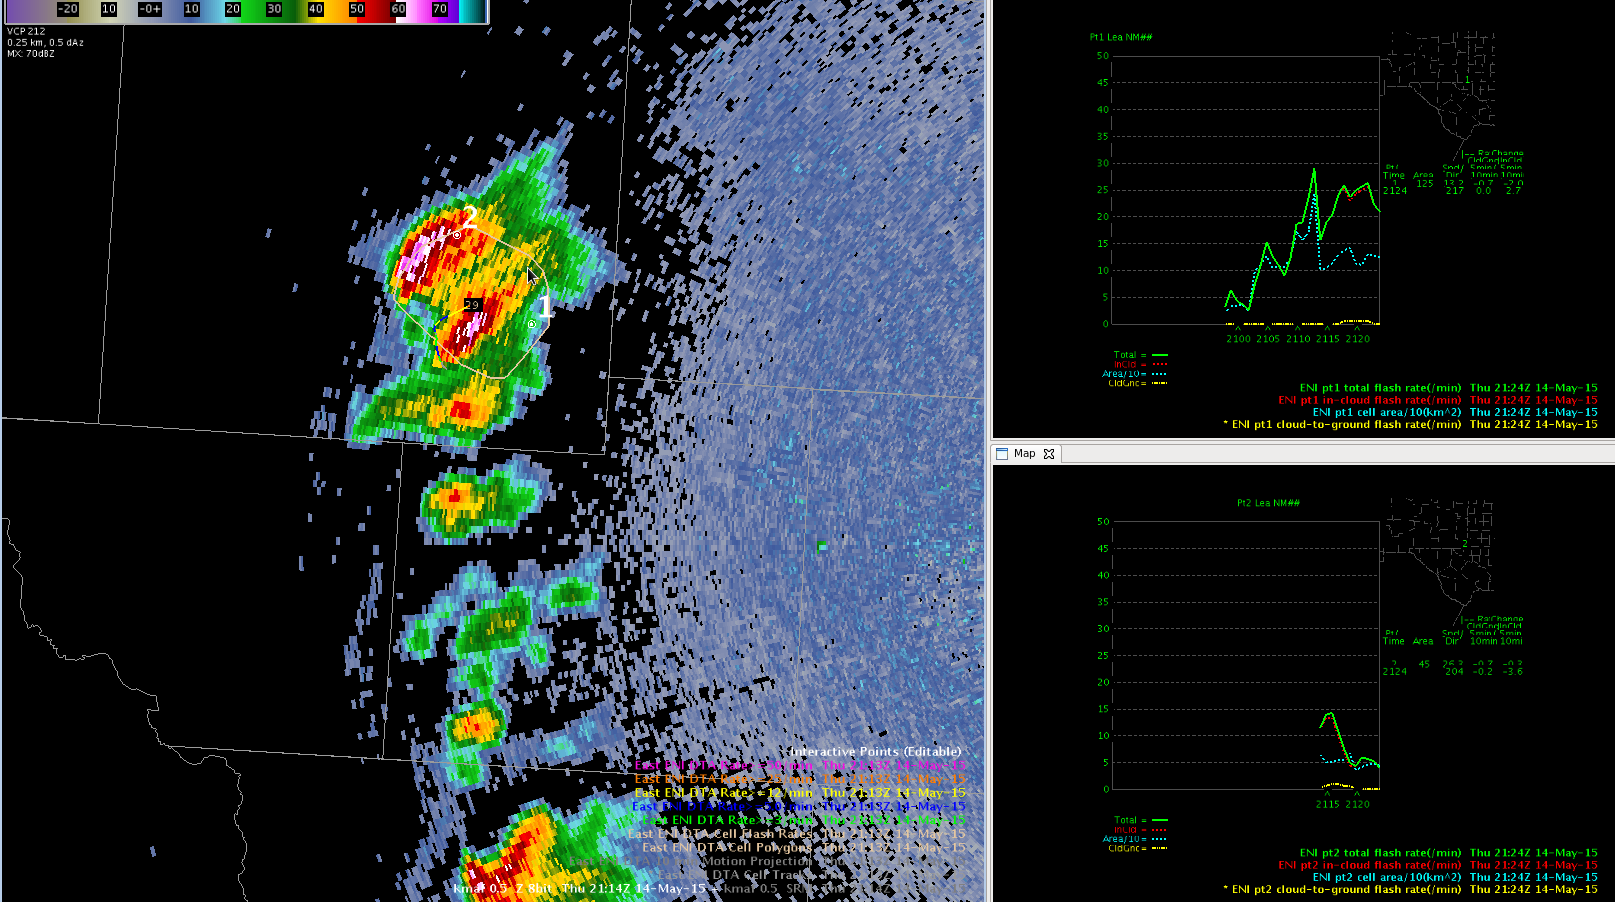
Lightning jump
– Worked great for us yesterday, it was often the first indication that a storm was intensifying. It signaled us to interrogate radar data for a given storm.
– One example yesterday, there was not much originally on radar at lowest level, then we had a jump, so we looked at the storm more closely, and found good signals in radar dual pol and at upper levels. Storm then strengthened.
– Some sort of colorscale for negative “lightning jumps” would be helpful. Also more research and training on the negative jumps. Do rapid decreases in lightning activity precede rapid storm weakening?
– Overall, display is simple, easy to use, good SA for fast changing event.
– It would be helpful to display the max value for the last 5-6 minutes in LJ, so significant changes would be be more difficult to miss.
– I really started to pay attention when jumps were to 4+
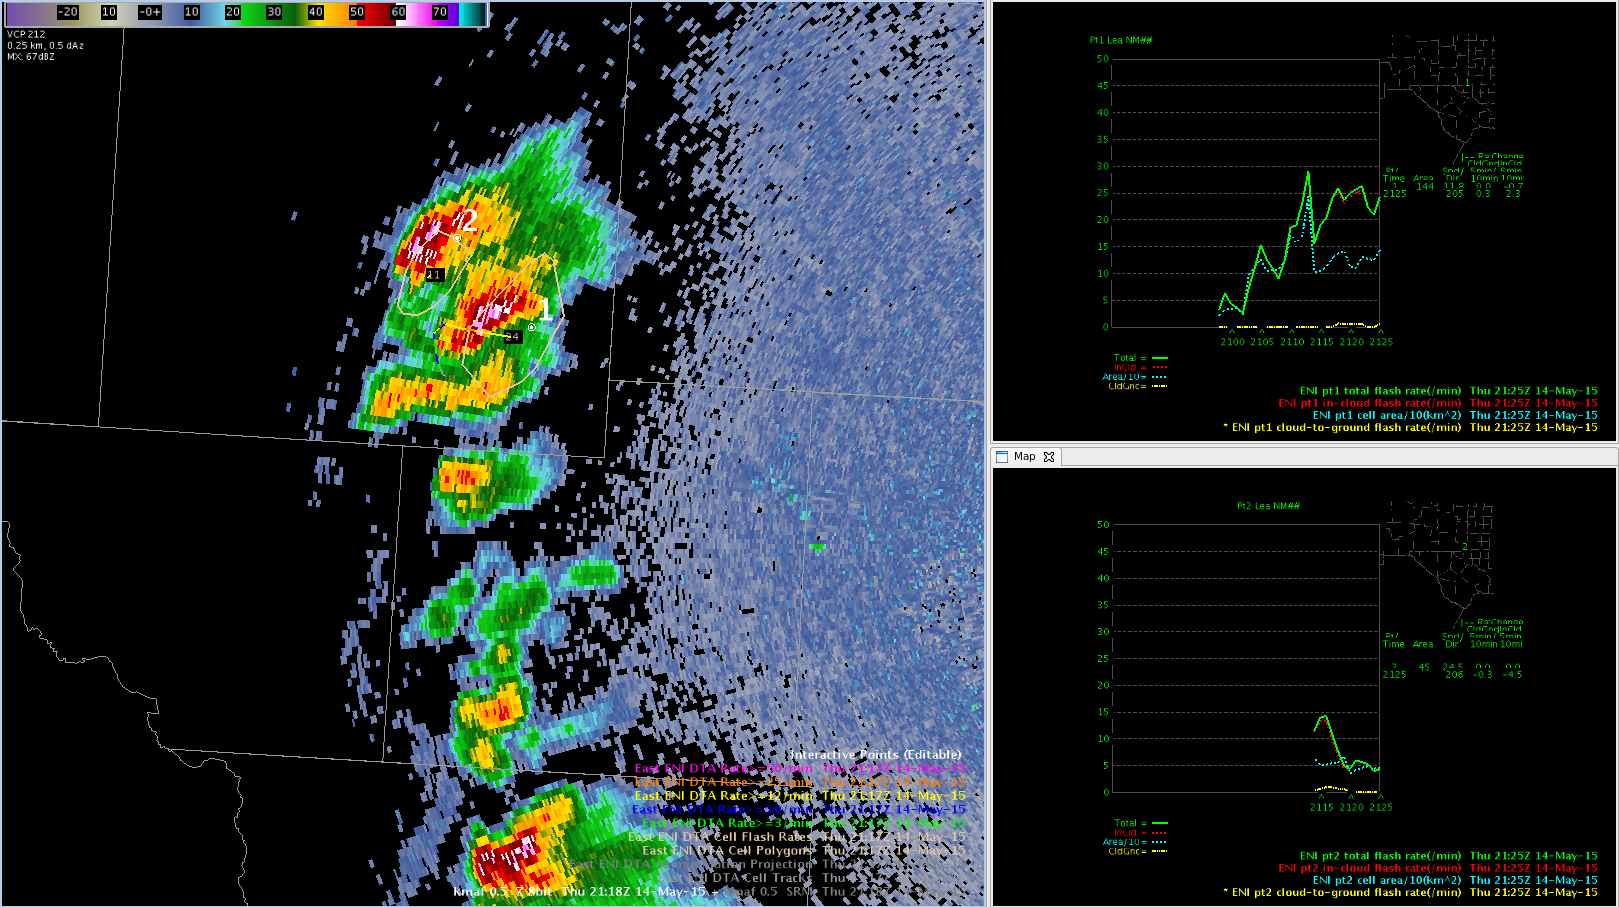
PGLM
– Flash extent density was awesome, and it has science behind it which is good
– The 6-min summation product needs to have a higher color scale.
– Yesterday, it did a great job of pinpointing strengthening storms as they intensified
– Shades of blue at low end of color scale I was using is helpful for more marginal cases, while a different color bar may be more applicable for storms with much increased lightning activity.
– It will be nice to have uniform detection efficiency across domain with GOES-R GLM.

-Darrel Kingfield, CIMMS/NSSL Research Associate & Week 2 EWP Coordinator

Tags: None

CAPE LAP helped with confidence

Here is an example where having the hourly CAPE LAP data helped with environmental awareness. Some storms were forming to the SW of the main storms and at first glance, you may think they will go severe since all the other storms have as well. This is especially true if you weren’t really looking at the current environment.

Take a look here at the 21z analysis and specifically at the lightning that is circle. There was a line of moderately strong thunderstorms developing here. You can see it is clearly outside of any CAPE analysis. I was fairly confident with this that the storms wouldn’t go severe. To note, the dry line was also to the east at this time.


CAPE21zfixed

At 22Z, the CAPE has continued moving east and the convection is still there but not severe.

CAPE22zfixed

Between about 2222z-2232z the ProbSvr did increase to the 60-70% range but nothing higher than that and that was in two different cells. Again, looking at this hourly LAP data helped confirm to me that these storms likely wouldn’t amount to much.


Lauren13

Tags: None

Lightning Jump Max product

Someone probably already mentioned this, but it would be helpful to get a product for the lightning jump that displays the max jump value over a time period. The jumps can come and go so quickly with the 1-min data that you can miss large, but quick jumps if you’re not watching it constantly. A 5 or 6-min max value product might be more useful for warning operations when you are typically looking at several things at once and don’t have time to constantly monitor the one Lightning Jump 1-min data.

~Regina Phalange

Tags: None

LJDA/pGLM First Experimental Products to Capture Intensification

Had an example where the lightning jump detection algorithm and the pGLM flash extent density did an excellent job of capturing rapid intensification of a new cell (the one on the right) in the southern part of our CWA. The lightning jump detection algorithm had a 4-5 sigma jump at the same time that the flash extent density showed a nice cluster of flashes.These features are seen at the very end of the gif loop below. Just a quick color map note: the default color map for the pGLM data looked the best for the high flash rates. The other two color maps were too messy to be of use.

PGLM
Press to loop

When we noticed this, we quickly looked at All Tilts base data and observed a Zdr column extending well above the freezing level. Using these two pieces of information we issued a warning on the storm. Shortly after, ProbSevere and MRMS MESH/Z above -20 increased rapidly.

ProbSevere
Press to loop

Ertel/Regina Phalange

Tags: None

CI Prob Day in Review

CI Prob really struggled today in MAF. It struggled to indicate much convection at all. There was a layer of clouds over the cwa that persisted through the forecast period. This was the most disappointing performance for CI during this workshop. It was not a useful tool today. Satellite data, Prop Severe and radar were more effective in that order…as development on satellite was very easy to distinguish before reflectivity appeared on radar.  UFFSU

CI recap for day

Tags: None

Splitting Lightning Cell Tracking

Here is an example with Earth Networks Cell Lightning Cell tracking where a single cell split into two.

In the image below, there is a single cell detected by the tracking algorithm:

beforesplit_croppedA few minutes later, the single cell splits into two:

aftersplit_croppedThe top right panel is the time series of lightning at point 1; the bottom right panel is the time series of lightning at point 2.

Note the lightning and area of point 1 decreases substantially around 2115 UTC. This is coincident with data coming into point 2. This shows the importance of taking into consideration the area when seeing trends in lightning. In this case, the decrease of lightning was because the cell at point 1 decreased in size and split into a second cell at point 2. This is why a time series began appearing for point 2 at the same time there was a decrease at point 1.

Polarimetric Researcher

Tags: None

New Warning Help

While watching the storms redevelop…I utilized a screen with the -20C MRMS data, the ProbSvr model  and the ENI thunderstorm alerts. I had a TimeSeries on another plot as well.

2258Z.. Focus on the pink circle in the middle. This is where it first pulsed from 27-74%.

newwarning-1

2300z the ProbSvr pulsed to  82%

newwarning-2

2302Z…ProbSvr was 82% and I saw the -20C reflectivity jump to 62dbz.

newwarning-3

at 2304Z… probSvr was 95%

newwarning-4


The SVR went out at 2306. And ProbSvr remained at 95%.


I could have look at this a little earlier and probably warned at 2302 looking back. But for the record, once I looked at it.. all I did was look at the display that is in the screen captures and only went through the all tilts once. So in reality.. I would have had to maybe wait a scan or two in all tilts to process before issuing. Where here, with the MRMS data and ProbSvr I was confident issuing quicker than I would have with legacy abilities.


Lauren13

Tags: None

East/West Lightning Data Confusion

Working in west TX, it was a nightmare trying to use the lightning data because the line cut through 1/3 of the CWA.  The east data was used in the bottom right screen (4-Panel) and the west data was used in the bottom left screen (4-Panel).  A better boundary has to be chosen that’s more friendly for these CWA’s.

32 34

-Champion

Tags: None