

Several years ago (in 2005), we hosted our first user group workshop on severe weather technology for NWS warning decision making. This workshop was held at NWS headquarters in Silver Spring, MD, and was attended by NWS management, severe weather researchers, technology specialists, and a “user group” of meteorologists from the field – local and regional NWS offices. The main objective of this workshop, and the second one that followed in 2007, was to review the current “state of the science and technology” of NWS severe weather warning assistance tools, to identify gaps in the present methodologies and technologies, to gain expert feedback from the field (including “stories” from the front lines), to discuss the near-term and long-term future trends in R&D, and for field forecasters and R&D scientists to help pave the direction for new technological advances. Our invitations sought enthusiastic attendees who were interested in setting an aggressive agenda for change. We invited Dr. Harold Brooks (NSSL) to give a seminar at the workshop about how the NWS might go improving the system it uses to verify severe weather warnings. Many of the ideas I will present were borne out of Harold’s original presentation, and I will build upon them.
So, to start, let’s look at how NWS warnings are verified today. As many of you know, the NWS transitioned to what is now known as polygon-based warnings about four years ago. Essentially, this means that warnings are now supposed to be drawn as polygons that represent the swath in which the forecaster thinks severe weather will occur during the duration of the warning, without regard to geo-political boundaries. In the past, warnings were county-based, even though severe storms don’t really care about that! It’s better to call the system “storm-based warnings”, since after all, counties are just differently-shaped polygons.
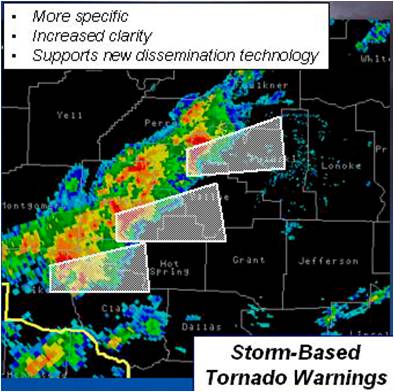
But what really changed was not the shape of the warnings, but how warnings were verified. No longer was it required that each county covered in a warning received at least one storm report. Now, only one storm report is required to verify a single polygon warning. This sounded attractive since it meant that if a small storm-based warning touched several small portions of multiple counties, that there was no need to find a report in each of those county segments, reducing the workload required to gather such information. But, as I will show, there are flaws in that logic.
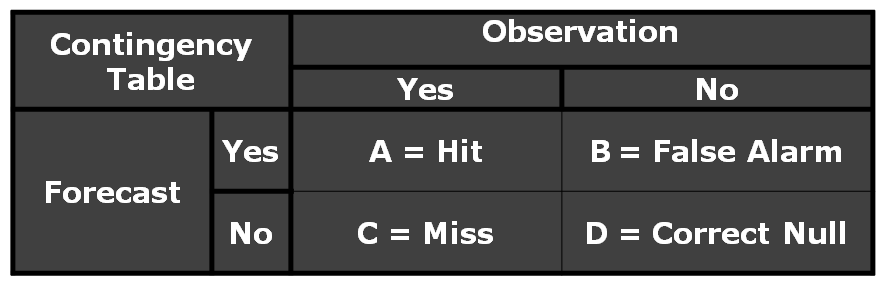
How are forecasts verified for accuracy? One of the simplest ways to do this is via the use of a 2×2 contingency table. Each of the four cells in the matrix are explained: A verified forecast is called a HIT (cell A), and represents when an event did happen when the forecast said it would happen. An unverified forecast is called a FALSE ALARM (cell B) when a forecast was issued, but an event did not happen. An event that went unforecasted is called a MISS (Cell C). And finally, wherever and whenever events did not happen, when there was a forecast of no event (or no forecast at all), that is called a CORRECT NULL (Cell D).
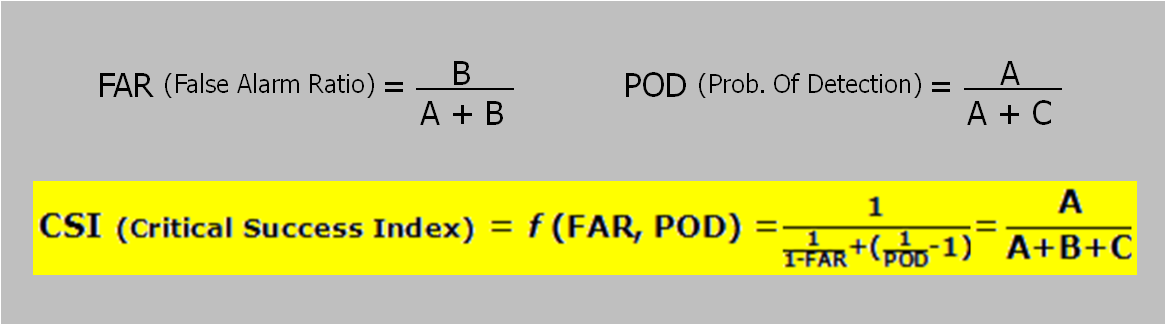
Also from this table, one can derive a number of accuracy measures. The first is called Probability Of Detection (POD), which is the ratio of verified forecasts (HIT) to the number of all forecasts (HIT + MISS). Another is the False Alarm Ratio (FAR) or Probability Of False Alarm (POFA), which is the ratio of false forecasts (FALSE ALARM) to all forecasts of an event (HIT + FALSE ALARM). Finally, one can represent the combination of both POD and FAR into the Critical Success Index (CSI), which is the ratio of HIT to the sum of all HIT, MISS, and FALSE ALARM. CSI can be written both as a function of A, B, and C, and through algebraic manipulation, a function of POD and FAR.
In the next post, I will explain how NWS warnings are verified today, and how they use the 2×2 table and the above measures to derive their metrics.
Greg Stumpf, CIMMS and NWS/MDL