An official website of the United States government
Here’s how you know
Official websites use .gov A
.gov website belongs to an official government
organization in the United States.
Secure .gov websites use HTTPS A
lock (
) or https:// means you’ve safely connected to
the .gov website. Share sensitive information only on official,
secure websites.
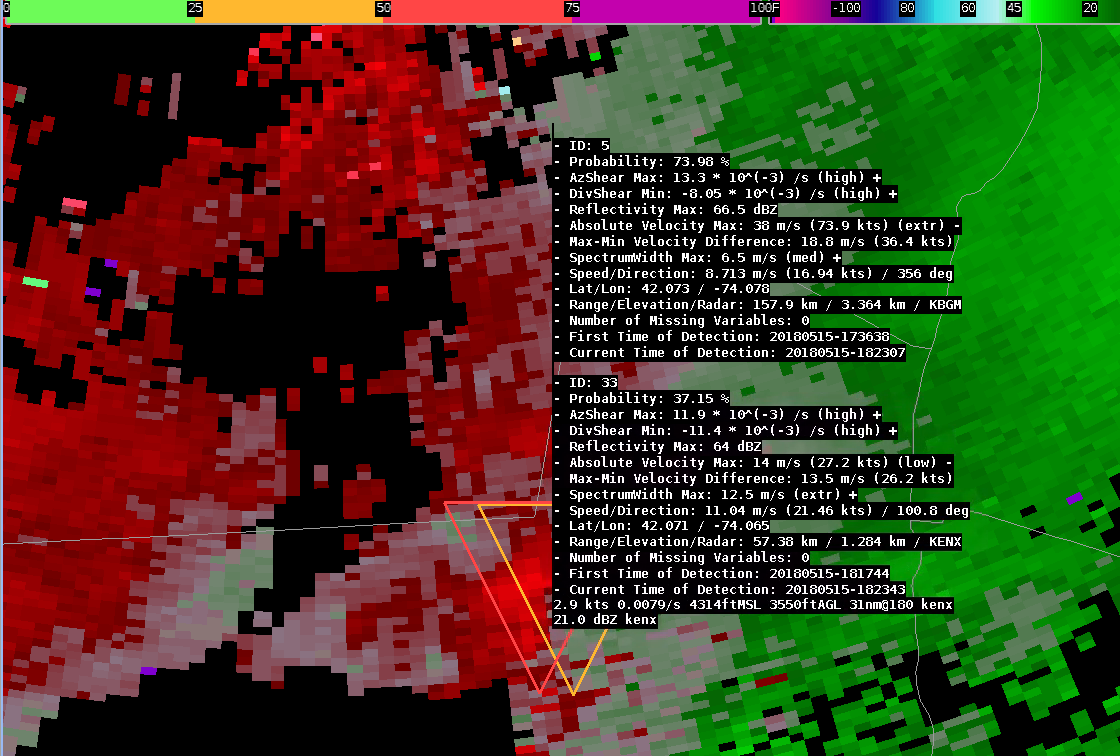
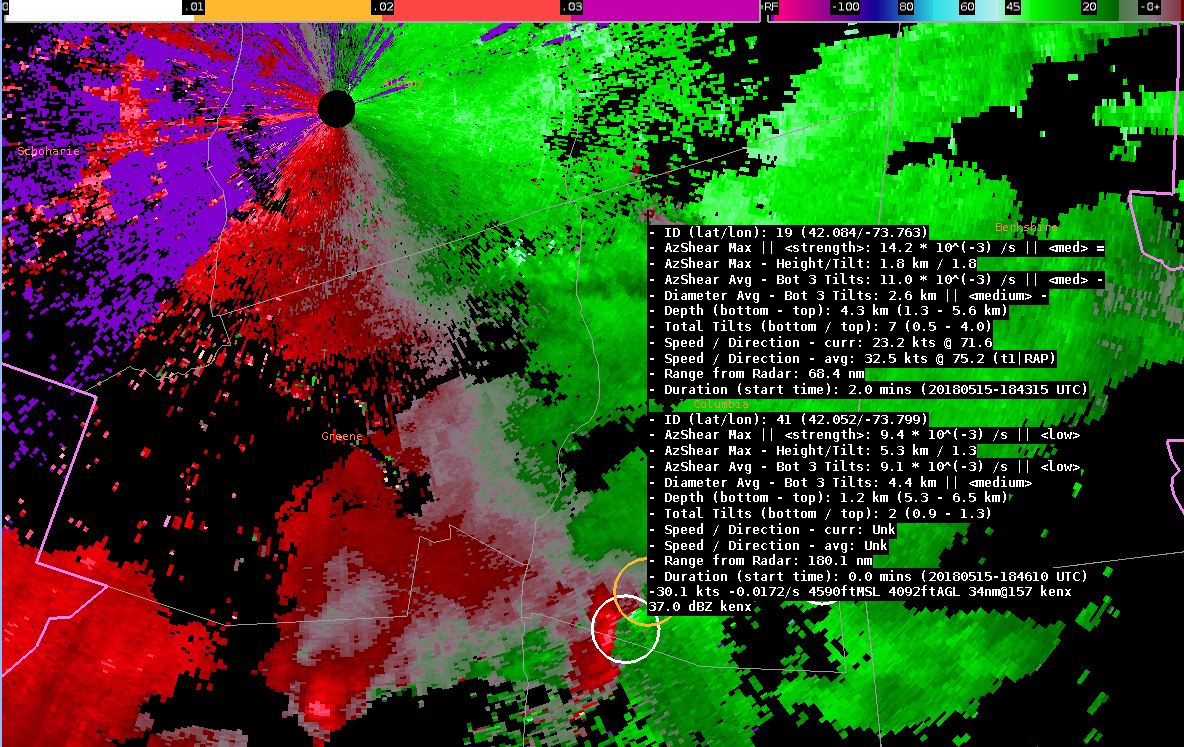
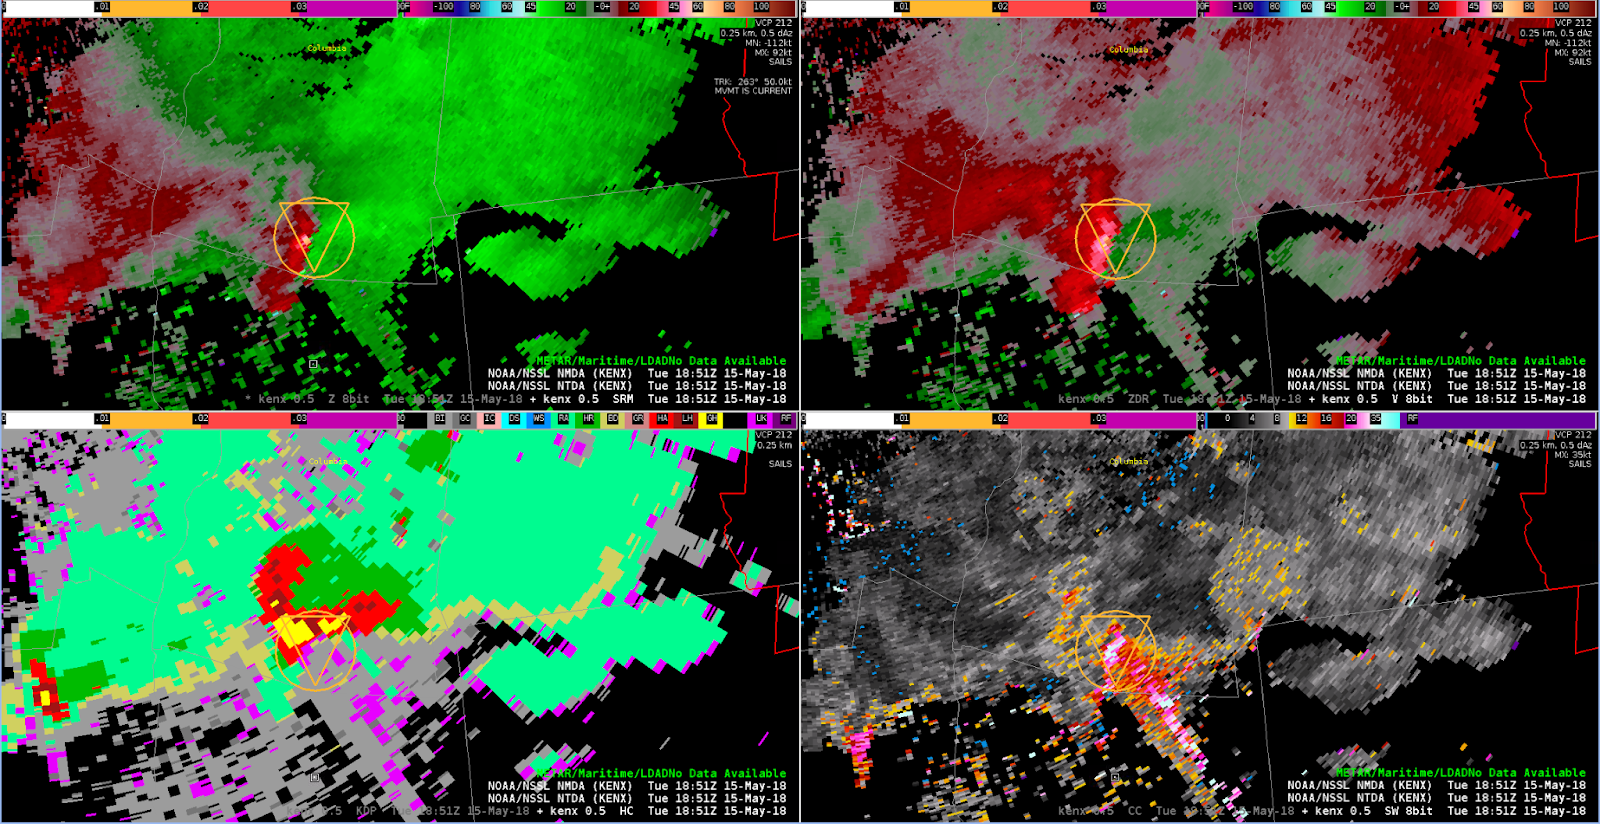
This about as good a hail spike you’ll see anywhere, let alone the Northeast. No surprise given the close proximity to radar and reports of 2” – 2.75” hail. For the NTDA detection, both the azshear and divshear values are in the “high” category. The probability was 40%. The NMDA detection extended only up to the 1.3 degree slice. The 1.8 cuts are shown to the right above. It’s asking a lot of any algorithm to make sense of velocity data in cases such as these, which is a good reminder in general when dealing with hail spikes, non-uniform beam filling, etc.
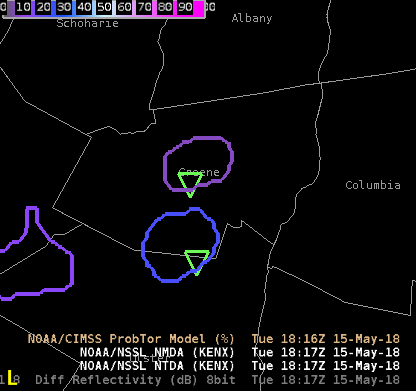
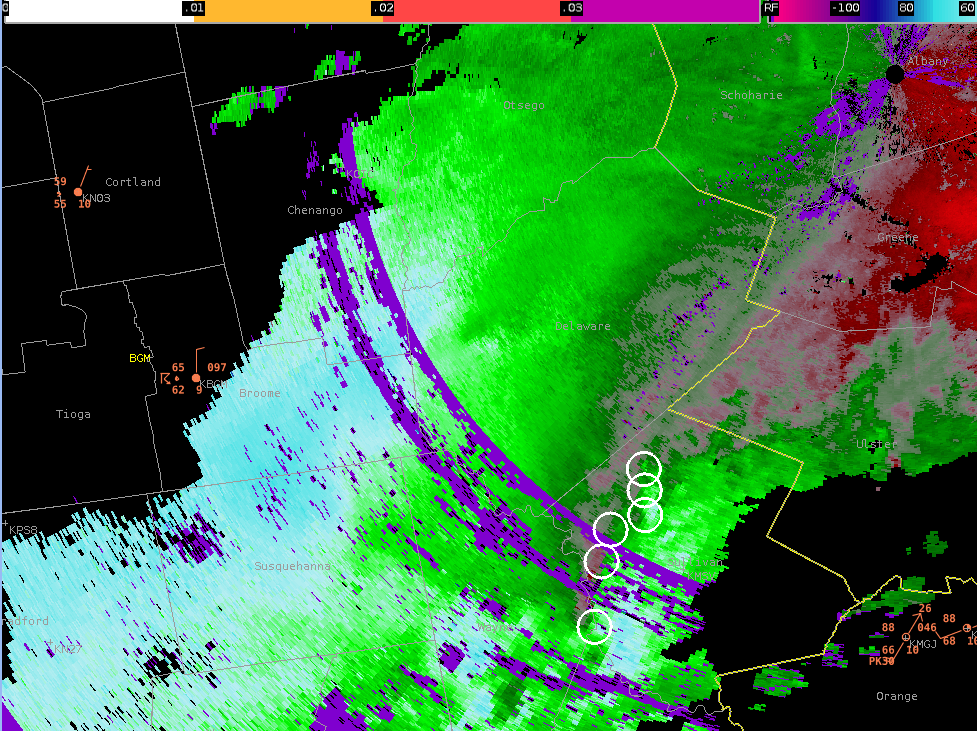
Looking below at another time (1817 UTC), it’s interesting to compare ProbTor with NTDA probabilities. Agreement between the two in terms of placement has been consistently good. There have been many times where the probabilities are similar, which is very surprising given that ProbTor is looking at coarser gridded azimuthal shear (1km?) as opposed to native resolution used by NTDA. Probably a coincidence. This is more the exception than the rule; most of the time NTDA is giving greater probabilities as one might expect.
I like the idea of overlaying multiple algorithms from multiple radars, as this give a more rounded view of a cell sometimes, especially if equidistant from RDA’s. I would like an ID from which radar I am looking at more apparent. With the NTDA there is an ID but it is difficult to see and find. With the NMDA there is no ID at all.
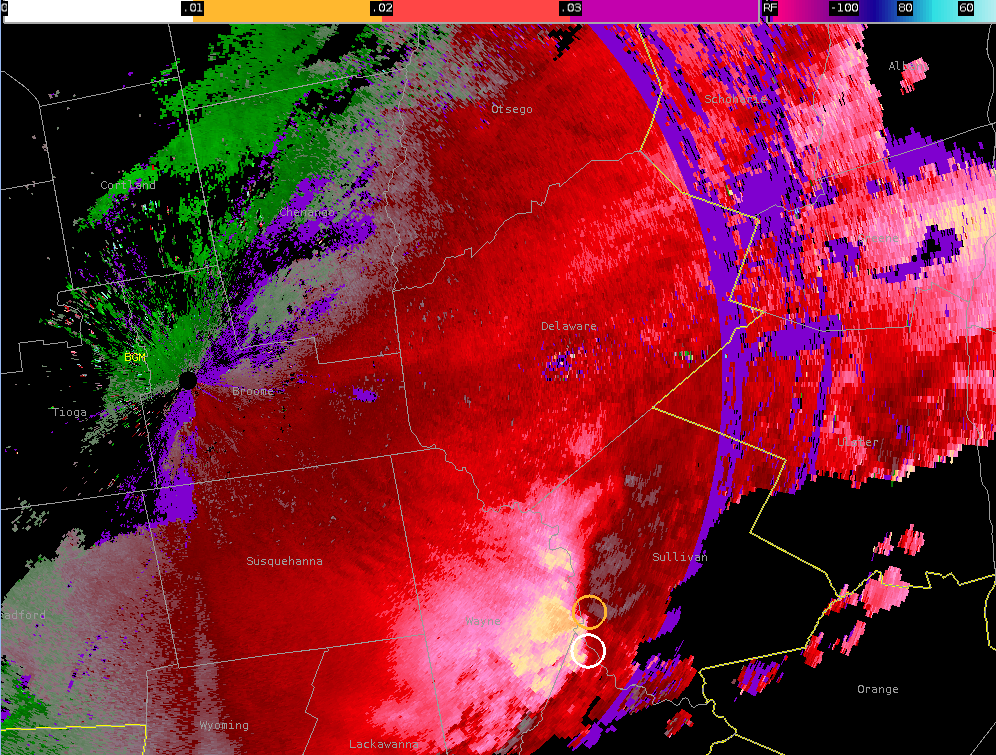
NTDA from both BGM and ALY overlaid on the KENX (Albany) radar.NTDA (relatively) high from both KBGM and KENX before tornado touches down in Sullivan County.NMDA from both BGM and ALY overlaid on the KENX (Albany) radar.NMDA from both BGM and ALY overlaid on the KENX (Albany) radar.NMDA from KENX (Albany). Many weak detections from a severe QLCS parallel to the RDA.NMDA from KBGM (Binghamton). Several detections from a severe QLCS perpendicular to the RDA.NTDA from both KOKX (NYC) and KENX (Albany) overlaid on KOKX radar.
Wanted to make a note about the visualization of the NTDA/NMDA algorithms when loading them on a 4-panel (all-panel rotate) AWIPS display. In this example, the algorithms were loaded onto all four panels. The first image shows that some adjustments were made to the settings on the panel displaying the V product — including a slight downsizing of the icon size, and unchecking option for scientific notation.
KBGM algorithm detections on the V panel of a 4-panel display.
However, on the panel displaying the SRM product, these options were not changed. The end result is that despite both of these displays being in the same overall AWIPS pane, the visualizations for NTDA are different between the two.
KBGM algorithm detections on the SRM panel of a 4-panel display.
I definitely expect that forecasters will have a desire to make changes to the default settings, in terms of which variables are displayed, how the units are displayed, and the size of the icons. For ease of use, it would probably be best to have the changed settings carry across all panels in the current AWIPS display, or else the settings will have to be changed four different times.
–Insolation
1842Z
We are examining a supercell in central Susquehanna County, Pennsylvania. At 1830Z, this cell had an NMDA detection (ID 34) beginning at the 0.9° slice and continuing through the 1.8° slice (3 total tilts).
KBGM V / algorithm detections at 0.9° at 1830Z.
However, it was noted that the mesocyclone on this cell continued much higher than the 1.8° tilt, as seen on the image below. So, it is worth noting that the algorithm probably did not continue going up through the storm as much as it could have.
KBGM V / algorithm detections at 5.1° at 1830Z.
Jumping ahead to the next full volume scan (below image) we see that an NMDA detection continues to be associated with this storm, and the depth has now increased to a total of 5 tilts. However, this is actually a new detection (ID 35), suggesting a problem with tracking as the supercell did not have any obvious changes that would have required assigning a new object ID.
KBGM V / algorithm detections at 0.9° at 1835Z.
While this detection does show greater depth than the previous detection, ascending to the 3.1° tilt, again it does seem to be under-doing the true depth of the mesocyclone. The image below is an example of the strong mesocyclone persisting through at least the 5.1° tilt.
KBGM V / algorithm detections at 5.1° at 1835Z.
–Insolation
1901Z
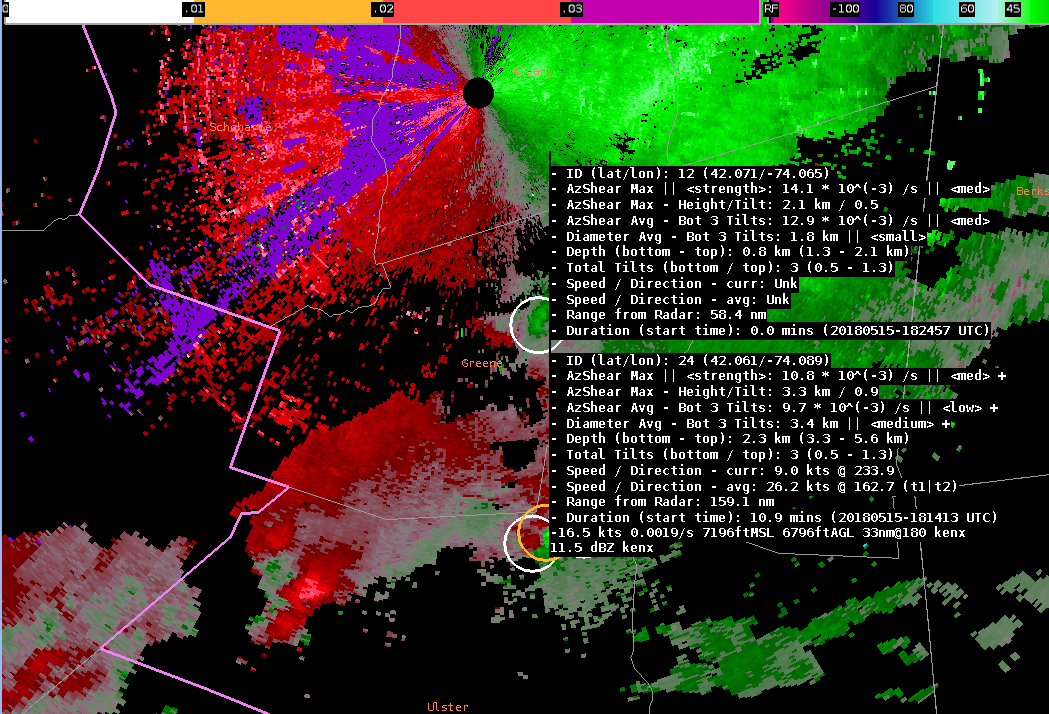
A QLCS evolution in Susquehanna and Lackawanna counties in Pennsylvania has provided an opportunity to examine the tracking of several features. In general, the NMDA detections along the line have been somewhat jumpy on KBGM. There was even a case in which one southeast-moving feature was sort of re-assigned the ID of a different NMDA object. Object ID 29 had been tracking fairly well from 1843Z to 1851Z, but suddenly on the 1854Z scan, this feature (a kink/meso within the QLCS) was assigned Object ID 16, which had previously been at a different location within the line.
It is also worth noting that this feature has had a consistent NTDA detection (ID 30) which has been tracking very nicely throughout the duration of this feature’s lifecycle, so the tracking problem did not extend to the NTDA algorithm.
KBGM V / algorithm detections at 0.5° at 1851Z. The feature in question is the co-located detection at the immediate bottom-left of the sampling data. At 1851Z, this feature had NTDA ID 30 and NMDA ID 29.KBGM V / algorithm detections at 0.5° at 1854Z. The NTDA feature remains consistent, but the NMDA detection has been changed to ID16. Note the very erroneous speed/direction values as well.
–Insolation
1915Z
Two well-defined QLCS circulations have developed in Wayne County PA. The main issue to highlight here is that the northern circulation did not generate an NTDA detection, despite a very tight circulation with a 30-35 knot Vr as determined from velocity data. This is problematic given that a TDS ended up occurring from this circulation. At 1918Z, several scans after the feature developed, an NTDA object was finally assigned (ID 40) but this was much too late to catch the touchdown.
The southern circulation may have also produced a tornado, and NTDA was making detections on it, if perhaps a little lower on the probabilities than would have been ideal.
A tertiary note on this setup is that problems with NMDA ID tracking continued, as discussed in the previous blog post.
KBGM SRM / algorithm detections at 0.5° at 1910Z. The NTDA feature did not make a detection on the northern circulation, which did produce a TDS.
–Insolation
1940Z
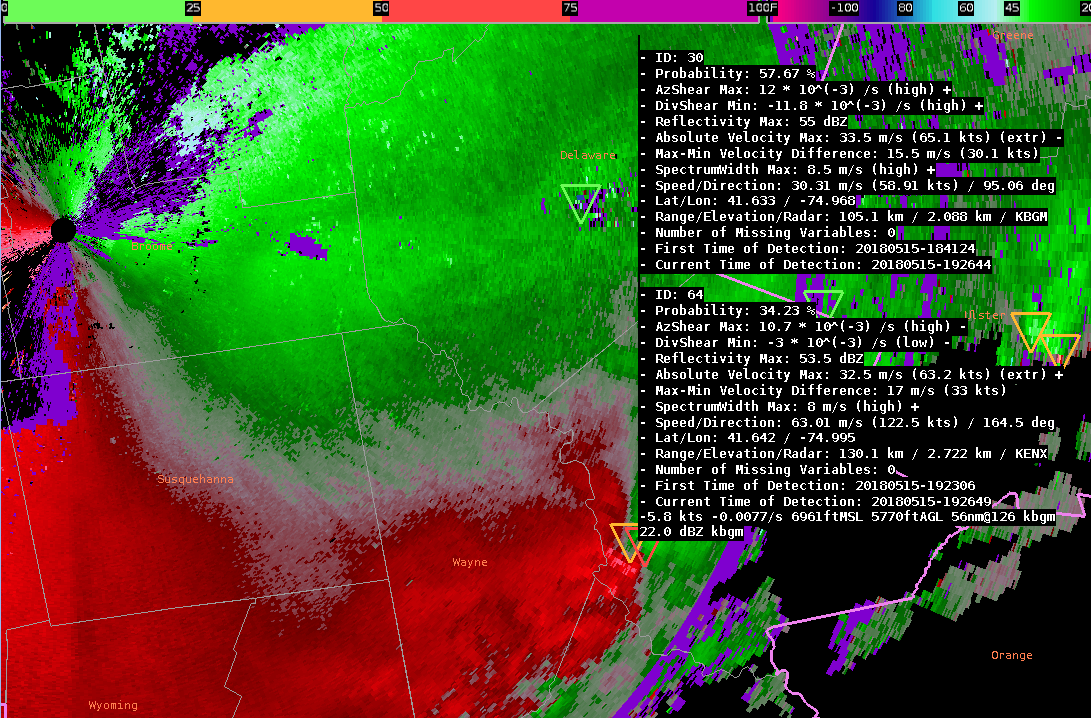
This is a follow-up to the above post about what was originally referred to as the northern circulation in Wayne County. It was noted in that post that an NTDA detection on that feature eventually occurred. Although the initial touchdown and the first 10 minutes or so were missed, the subsequent NTDA detection (ID 30) has been consistent and accurate, correctly detecting a tornadic circulation (per spotter reports). This consistency is noted especially because the storm is not only getting quite far from the radar, but it is crossing the ring of range folding. On the other hand, the NMDA detections remain jumpy, with this feature oscillating between two different NMDA IDs (16 and 29) for no evident meteorological reason.
KBGM SRM / algorithm detections at 0.5° at 1939Z. The NTDA feature shown here has remained consistent, even as the storm has crossed into the ring of purple.
–Insolation
2008Z
An interesting case is unfolding on the Ulster/Orange county border, as an area of rotation within a QLCS is now intersecting an area of beam blockage on the KOKX radar. Within the beam blockage, reflectivities are much lower, and the velocity data is showing signs of spurious / possibly-erroneous values. Nonetheless, this does remain an area of meteorological concern, and the algorithms have been consistently tracking the feature. NTDA (ID 5) has been more consistent with the tracking than NMDA, as has been the case for most of the event.
KOKX 0.5° Z / algorithm detections at 2010Z. The NTDA has been consistently tracking this feature and its probability has increased to 83%, but note that the feature is moving through an area of beam blockage.KOKX 0.5° V / algorithm detections at 2010Z. Note the spurious velocity data (also present on the previous two scans) that may have led to the very high probability with the detection.
As the feature exited the beam blockage, it did appear that the circulation was not quite as intense or tight as the 2010Z images might have suggested. It is tough to say with certainty, given that this remains a strong part of the convective line and some tornado potential is possible, but it appears that some of the spurious velocity values may have tripped NTDA too high in this case.
As of 2013Z, a similar NTDA detection (ID 10) was made on another part of the line just to the southeast (not pictured).
In the ALY case, a TBSS adjacent to a weak hook caused the NMDA marker to be displaced south of the meso. On the next scan, once there was a space between the hook and the TBSS, the marker jumped back north to the correct position, co-located with the NTDA marker. The NMDA ID remained consistent even with this jump.
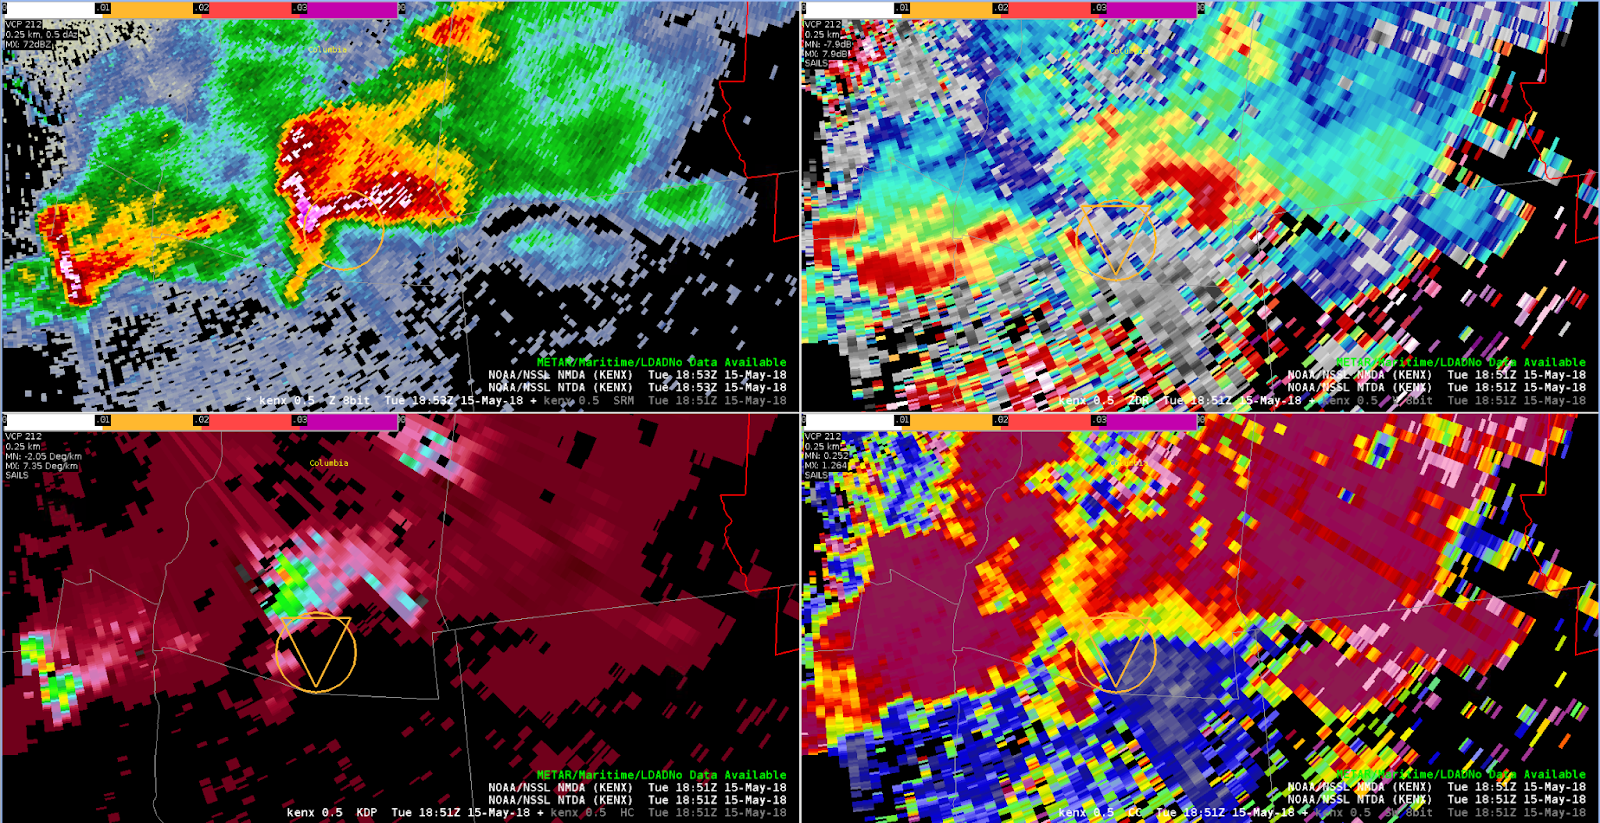
L to R, top to bottom: 0.5 / 0.9 / 1.3 deg SRM, 0.5 deg Z with NMDA and NTDA0.5 deg SRM with NMDA and NTDA
A well developed supercell was moving ESE south of Albany. The radar is not in a great location for this storm; while close, it is having to shoot through a very significant hail core. This is creating a very large TBSS coincident with the location of the low level mesocyclone. The NTDA is showing probabilities generally less than 60% (and in many cases, between 30 and 40%), but I expected to see higher numbers. Suspect the lower probs are due to velocity issues related to the TBSS. Subjectively, I would definitely have a Tornado Warning out for this storm.
This was a less than ideal 0-3 km shear orientation for this QLCS overall, but a section of the line to the northeast of KDGX (Jackson, MS) did have a slightly more favorable orientation.
Above we see an initial NMDA detection at 2039 UTC associated with the tightening couplet. There is NTDA detection to the northwest associated with a broader cyclonic circulation that may at first looked like a developing bookend vortex, but this didn’t last given semi-discrete storm mode.
As the couplet starts to pivot anticylonically and tighten a bit, we see agreement in placement with the NMDA and the NTDA. The >20% shown in the NTDA legend refers to a slider setting to filter out lower probabilities. Having the filtering feature is great and made even better by having the legend provide that extra information.
The next available time shows accurate progression of the NTDA detection with respect to the now even better defined couplet (note: the NMDA had not updated since the previous image).
Starting to see more discrete circulations that are most likely very shallow and probably too small to be well resolved at much greater range than this. The example suggests utility in having the NMDA and NTDA icons displayed together because in this situation they’re basically identifying the same features while bringing different information to the table.
For example, the NMDA is looking at the 0.5 through 1.3 cuts while the NTDA uses multiple moments (including dual pol) at the 0.5 cut and then draws upon a set of a analogs to calculate probabilities. Using the NMDA/NTDA in this fashion is sort of like using a “two model ensemble” to build confidence in detections.
A QLCS is moving across far northeastern Mississippi. The KGWX radar is shooting parallel to the gust front on a lengthy segment of this QLCS, which has a fairly well-defined (if not overly sharp) leading edge / shear axis. This is a case in which the NMDA is suggesting that there are multiple weak mesocyclones lined up along this shear axis, when in reality this is (mostly) just a line of forward propagating convection. At the time of this screen capture, the one NMDA detection with a higher AzShear value (in orange) does appear to be legitimately associated with a mesocyclone.
KGWX detections at 2029Z.
On the other hand, a tight circulation did develop along another QLCS segment further south, where it was intersecting the outflow from the northern segment. NTDA picked up values >50% here, and did so in advance of the circulation tightening up to the extent that it can be likely called tornadic. This was a good detection for sure.
2052Z
A weak/shallow circulation developed in Oktibbeha County MS, on a kink in the line. This feature is just to the right of the word “Oktibbeha” in the image below. However, despite there being a number of false alarms on the NTDA algorithm (including one just to the north), this feature did not generate a detection on either the NTDA or NMDA. Forecasters in our group thought that this feature, while probably unlikely to be actively producing a tornado, was probably the kind of thing you would want the algorithms (or at least the NTDA) to put some kind of small probabilities on. For the purposes of NMDA, it should be noted that this weak circulation did extend through the lowest 3 or 4 slices on KGWX.
The supercell cluster coming into Wayne County, Indiana, is exhibiting solid rotation on the lowest slice. NTDA from KIND/KILN are both showing values in the 80% range. Both radars are also indicating two separate mesocyclone detections, and a qualitative analysis of the storm does suggest two separate updrafts and storm cores. As one would expect, the southern core (the newer development) is driving the NTDA detection which matches with the location of the southern NMDA detection. This makes sense conceptually, as the tornado potential will be much greater with the unimpeded inflow associated with the southern core.
KIND detections of NMDA/NTDA in NW Wayne County, Indiana.KILN detections of NMDA/NTDA in NW Wayne County, Indiana.
0157Z
A broken cluster of supercells is now entering the state of Ohio. Radar data is largely quite mottled and the majority of the NMDA detections are weak, but there are a lot of them — including in places where conceptually you would not really expect a circulation to exist. There are data artifact issues, related somewhat to the distance from the KILN radar, and also perhaps related to the complex interaction between different parts of different supercells and storm clusters. This would likely be a case where extremely weak / transient detections might be desired to be toggled off under a certain threshold. NMDA detections on the strongest circulations have not necessarily been stronger detections, but NTDA detection probabilities have been tracking fairly well with where tornadoes appear most likely to occur.
KILN detections of NMDA/NTDA at 0155Z.
0237Z
Both the NTDA and NMDA are making high-end detections in Miami County, Ohio, near West Milton. The NTDA has had values >95%, and at times >99%, with this tornado. Perhaps more interesting is that this is the first case I have yet seen in which the NMDA has shown such a consistent, high-end, well-tracked detection across a span of 10-15 minutes — with extreme (>0.03) values of AzShear. Overall, the NMDA algorithm doesn’t seem to trip into the higher values very frequently, so it really calls your attention to it when it does.
KILN detections of NMDA/NTDA at 0234Z.
0302Z
A messy storm evolution has occurred in Auglaize County, with some kind of hybrid QLCS / supercell structure based on Z/V data. Although qualitatively, the velocity data is not particularly impressive, the NTDA has done a very nice job at consistently detecting a tornadic signal from around 0241Z to 0251Z. A tornado did occur at this location, including a TDS that was apparent along the same track of the NTDA detection just a few minutes later. This is a very good detection by NTDA, correctly identifying a tornado in an area where eyeballing the velocity data would not yield as much certainty.
Now looking at ILN radar, Here we see several detections that are associated with a complex velocity pattern. The alternating inbound/outbound velocity pattern suggests gravity waves are propagating northeastward. This is in the evening, so perhaps a nocturnal inversion is helping to duct these waves. Not surprisingly the NTDA appears to have some false detections with the 2D shear.


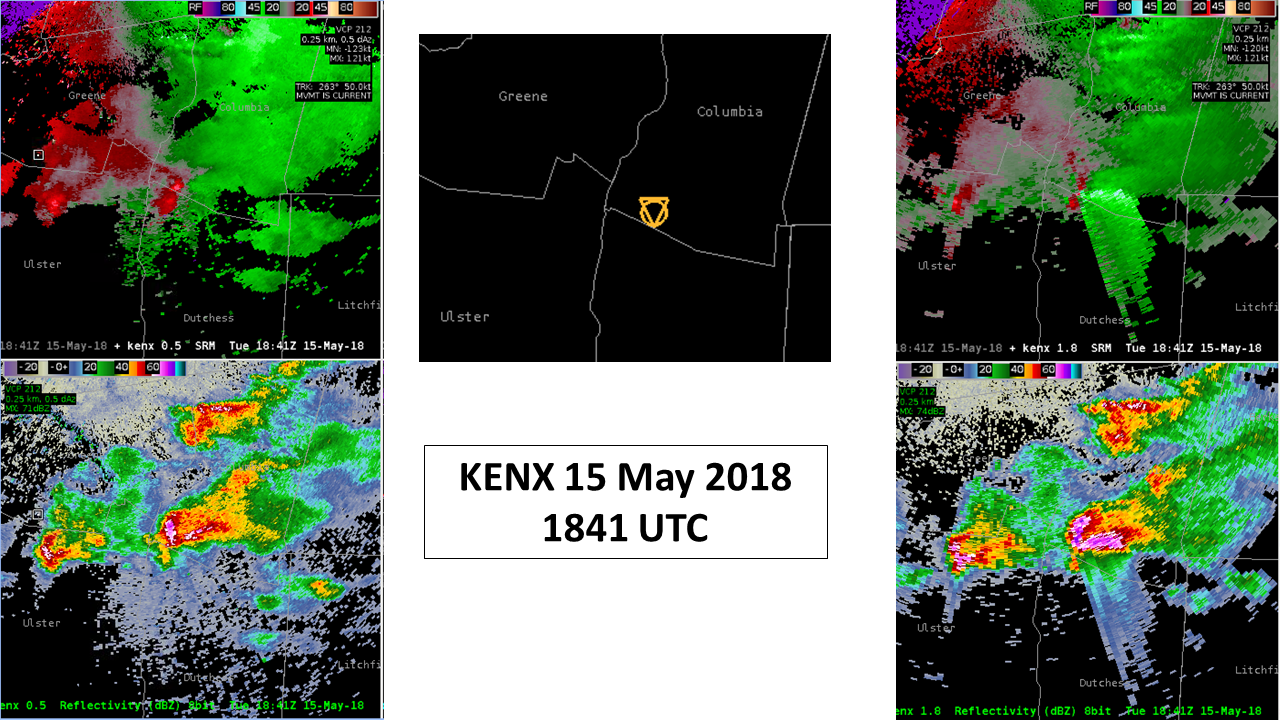 This about as good a hail spike you’ll see anywhere, let alone the Northeast. No surprise given the close proximity to radar and reports of 2” – 2.75” hail. For the NTDA detection, both the azshear and divshear values are in the “high” category. The probability was 40%. The NMDA detection extended only up to the 1.3 degree slice. The 1.8 cuts are shown to the right above. It’s asking a lot of any algorithm to make sense of velocity data in cases such as these, which is a good reminder in general when dealing with hail spikes, non-uniform beam filling, etc.