2055Z
In southern Jasper County, IA, a supercell is moving ESE. A small/tight circulation developed, associated with a tornado that was moving at a bit of a deviant motion (more like SE or even SSE).
NTDA correctly identified this tornado at first with ID 20, which had previously been used spuriously to identify some transient rotational features in the same general area. NTDA continued to briefly track this tornado as it moved toward the Marion County line, but suddenly, at 2049Z, ID 20 was erroneously re-assigned to another (weaker) circulation a few miles to the north. In fact, no NTDA detection continued for the tornadic circulation entering Marion County at all.
Ideally, you would want to continue to use the same ID to track the tornado until it dissipated, and perhaps assign a new NTDA element to the other circulation further north. I might speculate that the tornado’s deviant motion, compared to the overall storm-scale motion, might have had something to do with this issue.


–Insolation
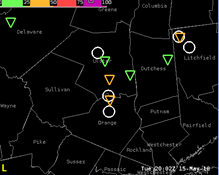
2136Z
A tornadic supercell in Marshall County IA has developed a tight, intense couplet on KDMX radar. The NTDA algorithm has performed fairly well from a qualitative sense, but some of the underlying numbers are not exactly as expected for such an obvious tornadic signature. The first image is from the 2132Z scan, which was the first scan to show a tight gate-to-gate tornadic couplet.
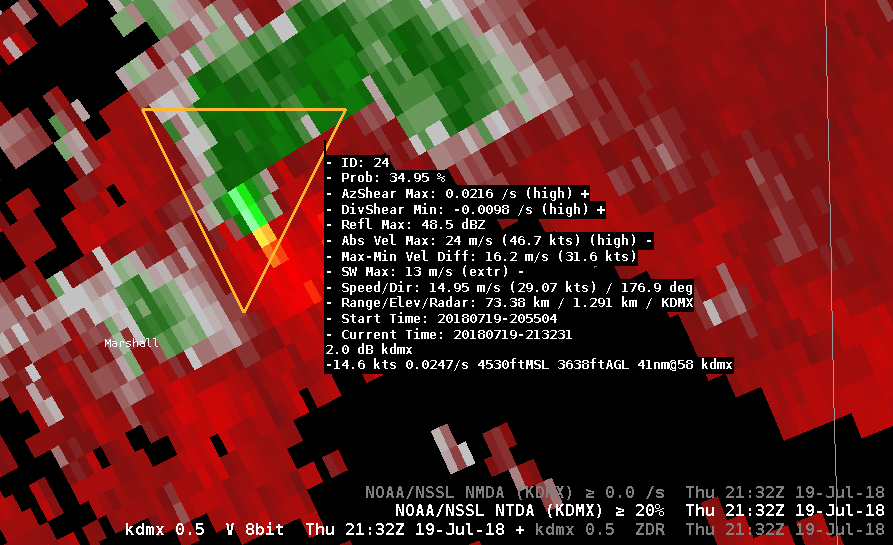
It is notable that despite high/extreme categorizations on several variables, the probability is only about 35%.
This changes significantly just one minute later.

At 2133Z, the probability has increased to about 95%. In the opinion of our group, this storm absolutely warrants very high probabilities, so the 2133Z NTDA detection appears to be the better of the two.
The big question here is why the NTDA changed so much from 2132Z to 2133Z, because the underlying statistics (as displayed in the sampled readout) do not change significantly from one minute to the next. We were very curious as to why small changes in these calculations led to such a big change (yet a very good change) in the tornado probability.
Another item of note from this example is that the Abs Vel Max and Max-Min Vel Diff statistics do not seem to be capturing the highest values of velocity when sampled by hand bin-by-bin. Using the 2133Z time step as an example, there is a 69.0 knot outbound velocity, but the Abs Vel Max only lists a maximum value of 47.6 knots. The Max-Min Vel Diff (Vr) calculations are similarly affected.
–Insolation