Total Optical Energy vs. Flash Extent Density…the steel cage match.

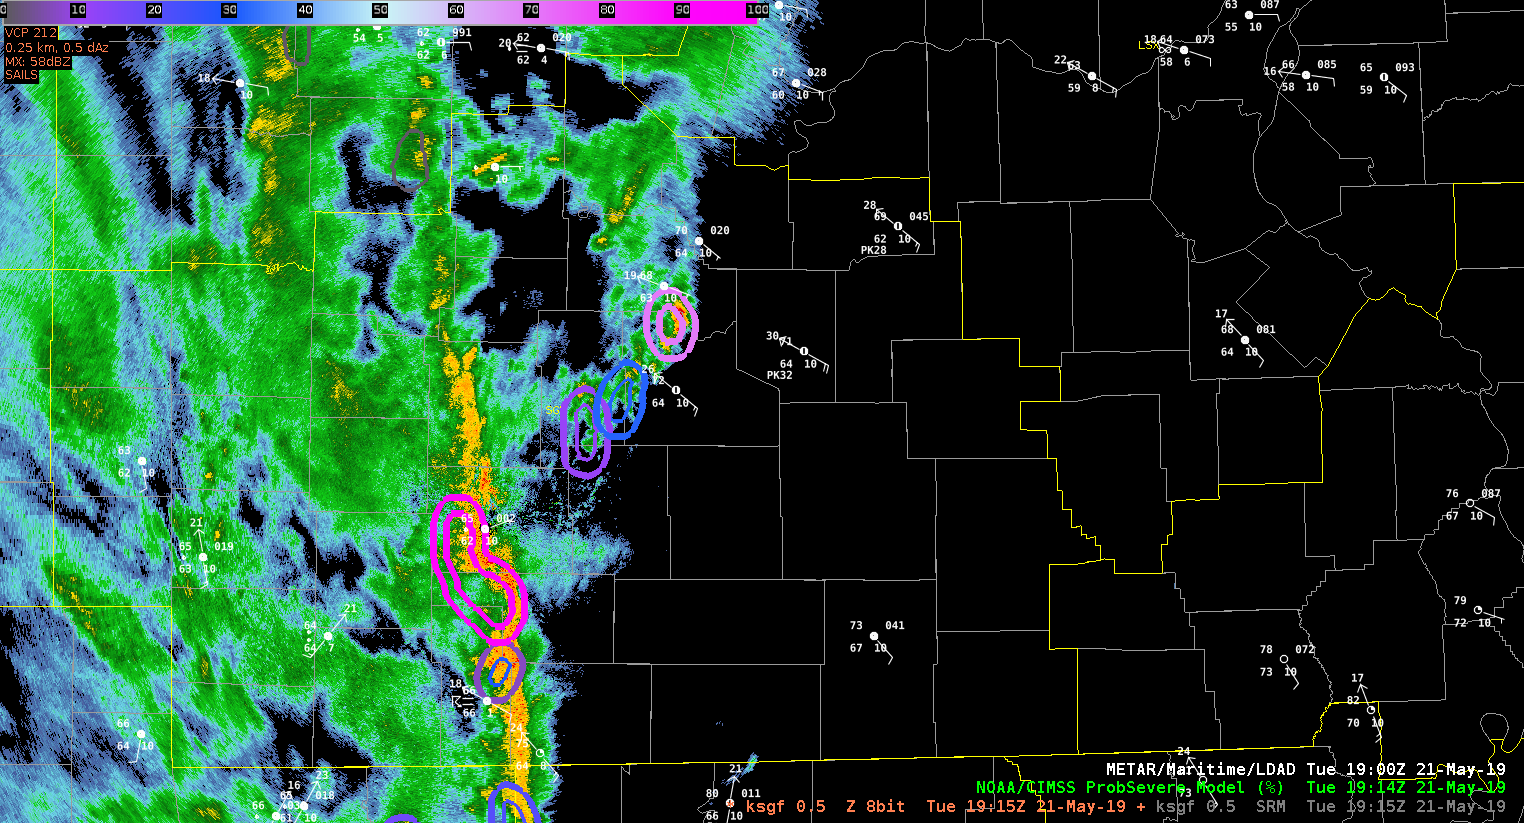
On the afternoon of May 21, portions of the Wichita (ICT) and Topeka (TOP) CWAs were under a Severe Thunderstorm Watch. To give one of the new GLM products a run through, I wanted to compare two cells of differing strength to see if GLM trends were helpful in nowcasting the cells. See the loop below.

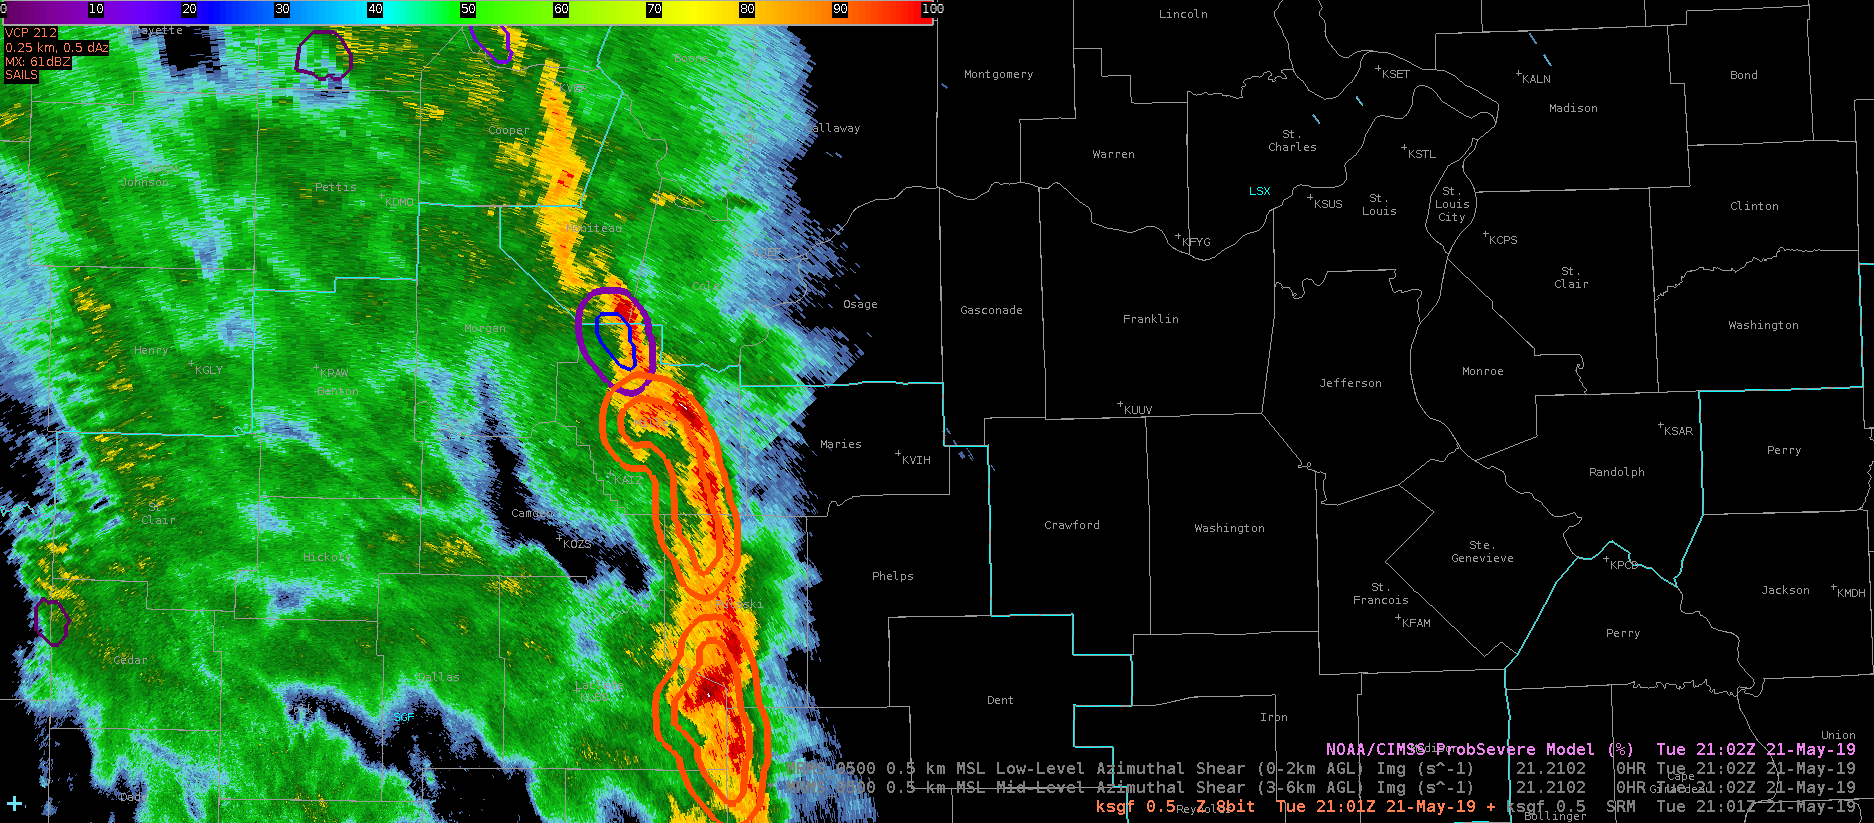
The first cell of note was in Dickinson County (TOP CWA), and the second  was in Rice County (ICT CWA).  At the initial time of 2131Z, the storm in Dickinson County was already severe, and the Prob Severe Product supported this assertion with 68% prob wind and 76% prob tor. Meanwhile, the cell in Rice County was much weaker, with 50DbZ topping out below the -20C level (not shown), and prob hail/tor values of 2/1 % respectively.

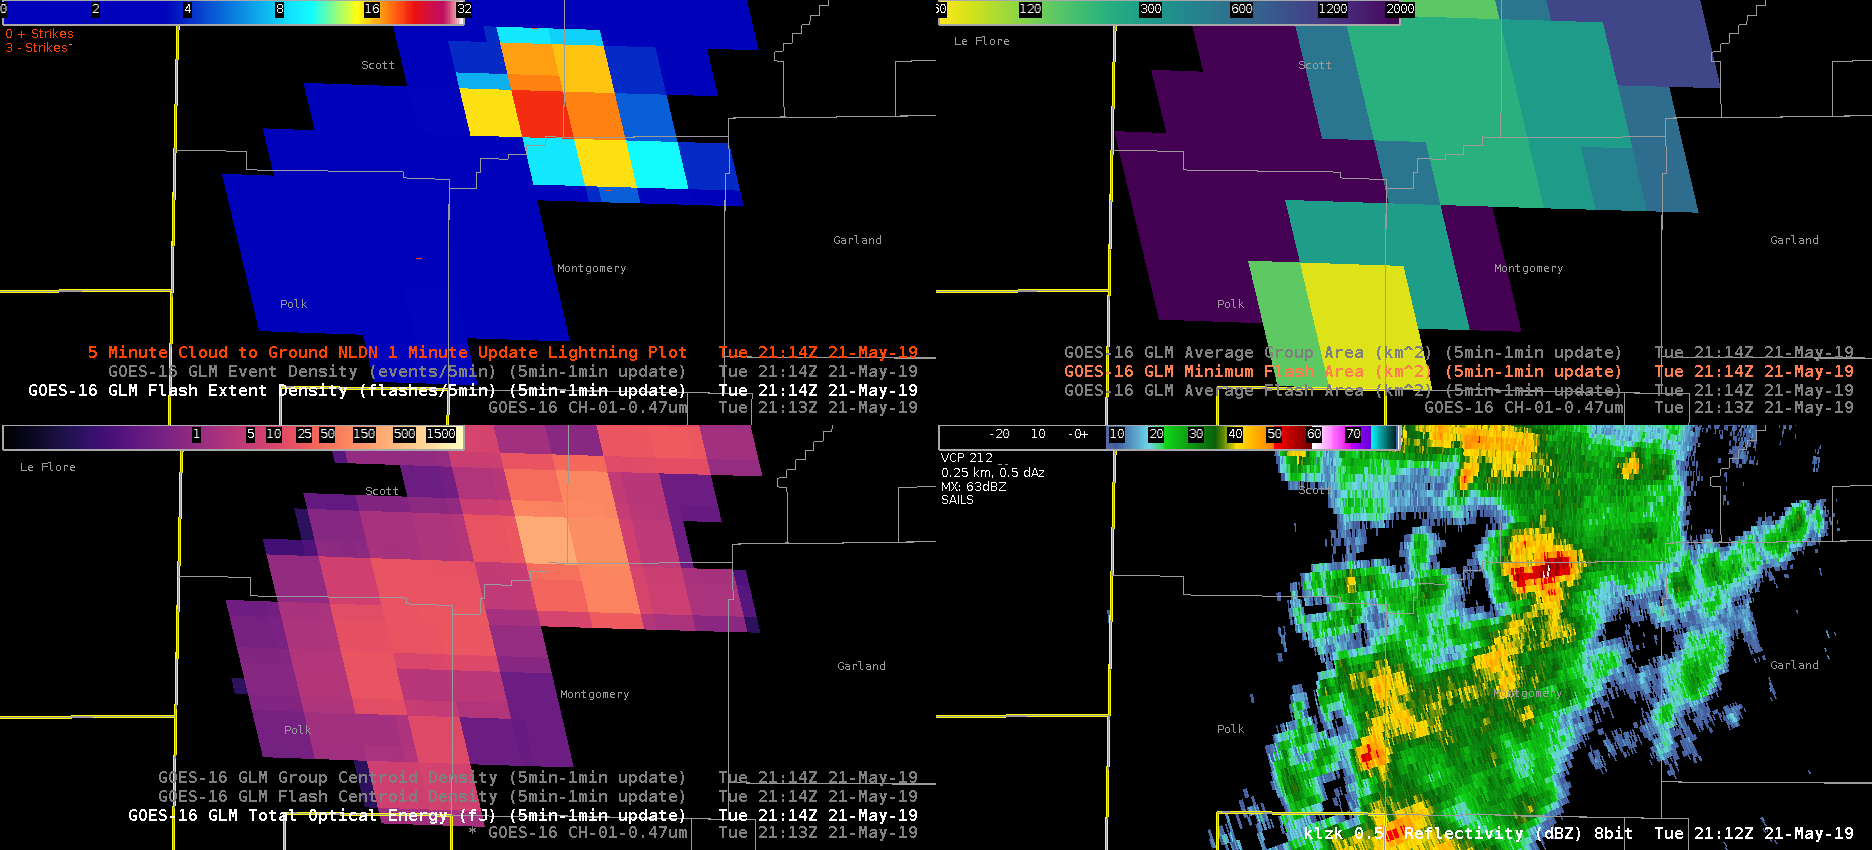
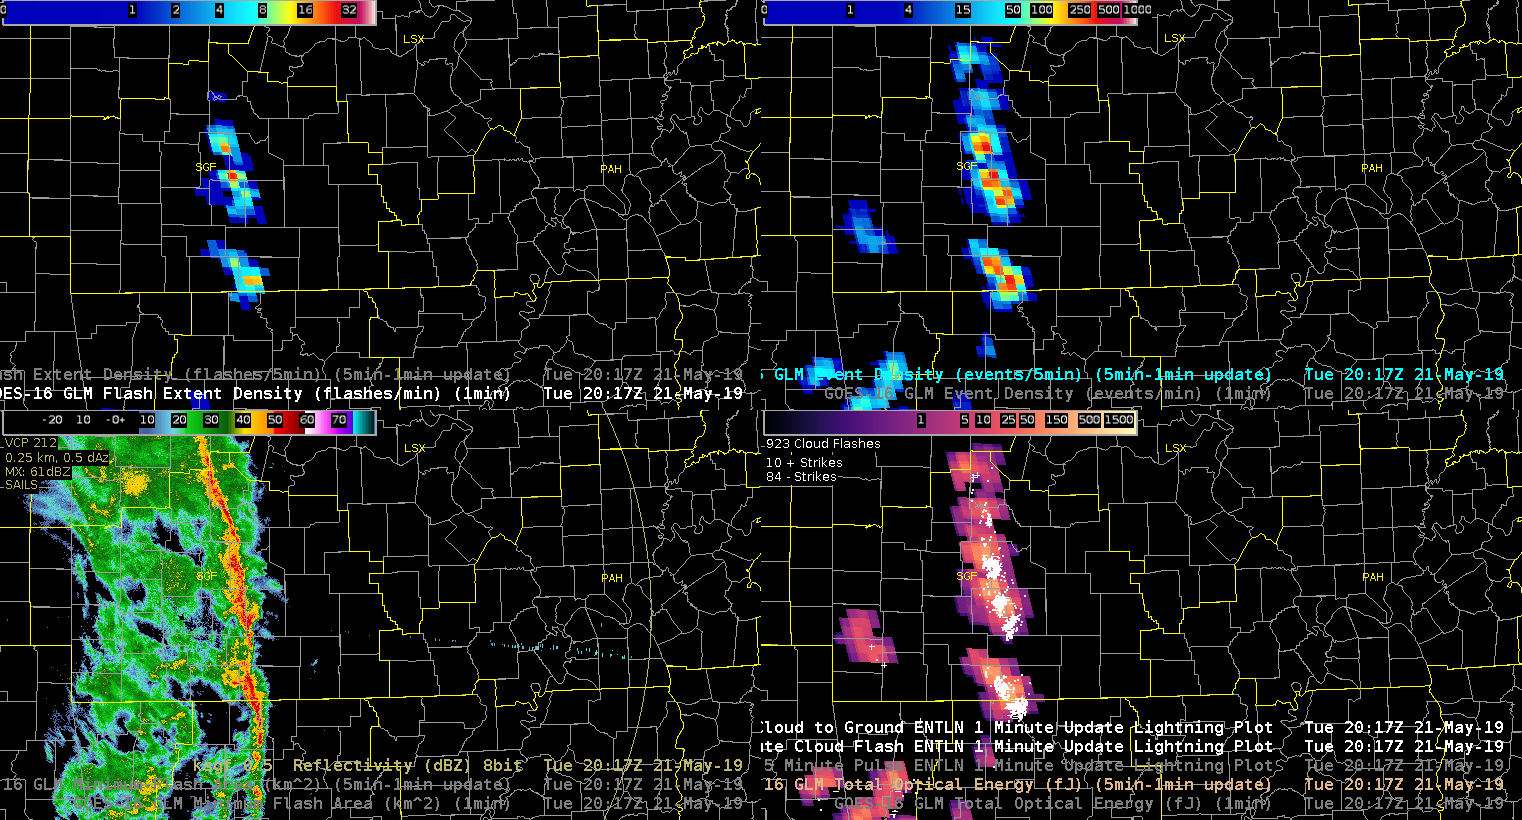
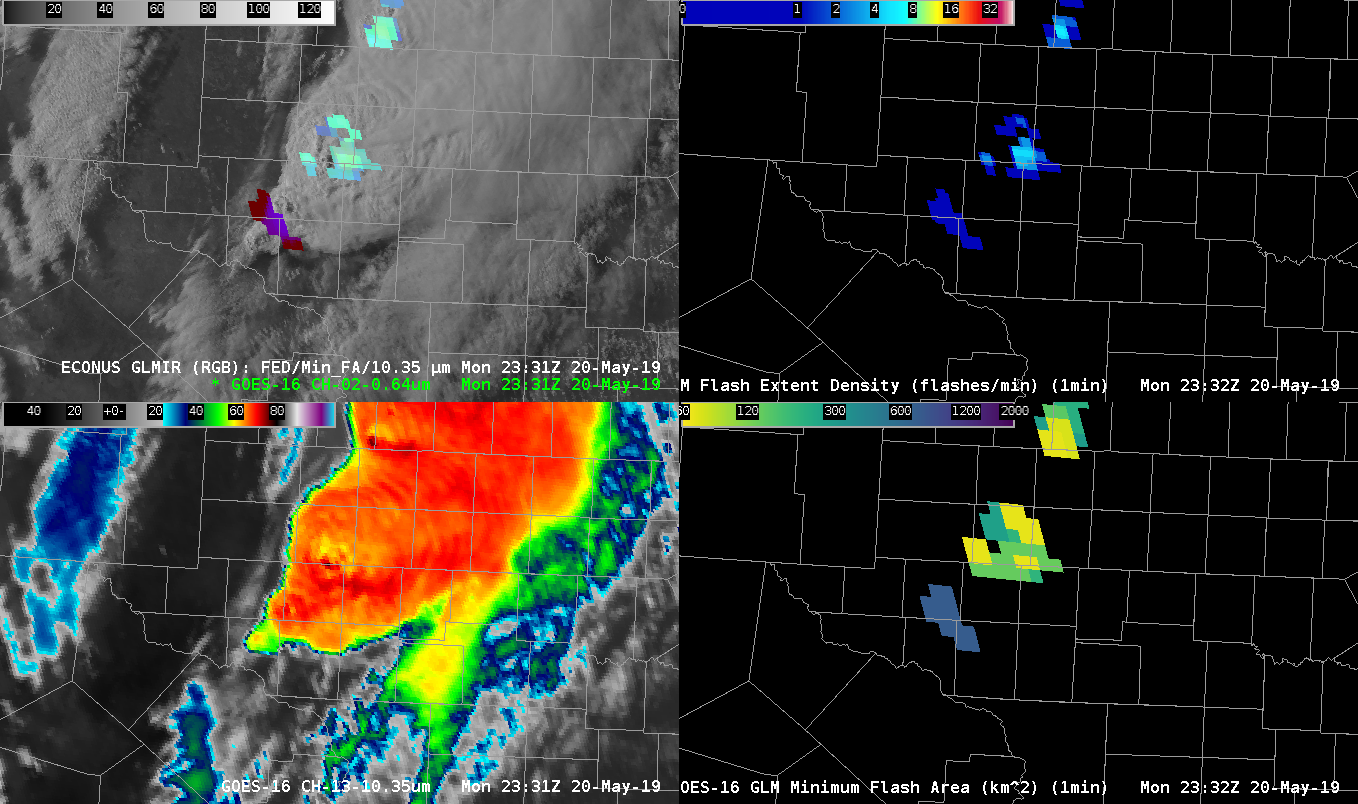
At that time, the 5 minute flash extent density showed a little enhancement (max of 32), but the total optical energy was actually less (63 fJ) than several other, weaker storms in the area. Meanwhile, the storm in Rice county showed very modest flash density values (max of 9), but more significant TOE (144 fJ).

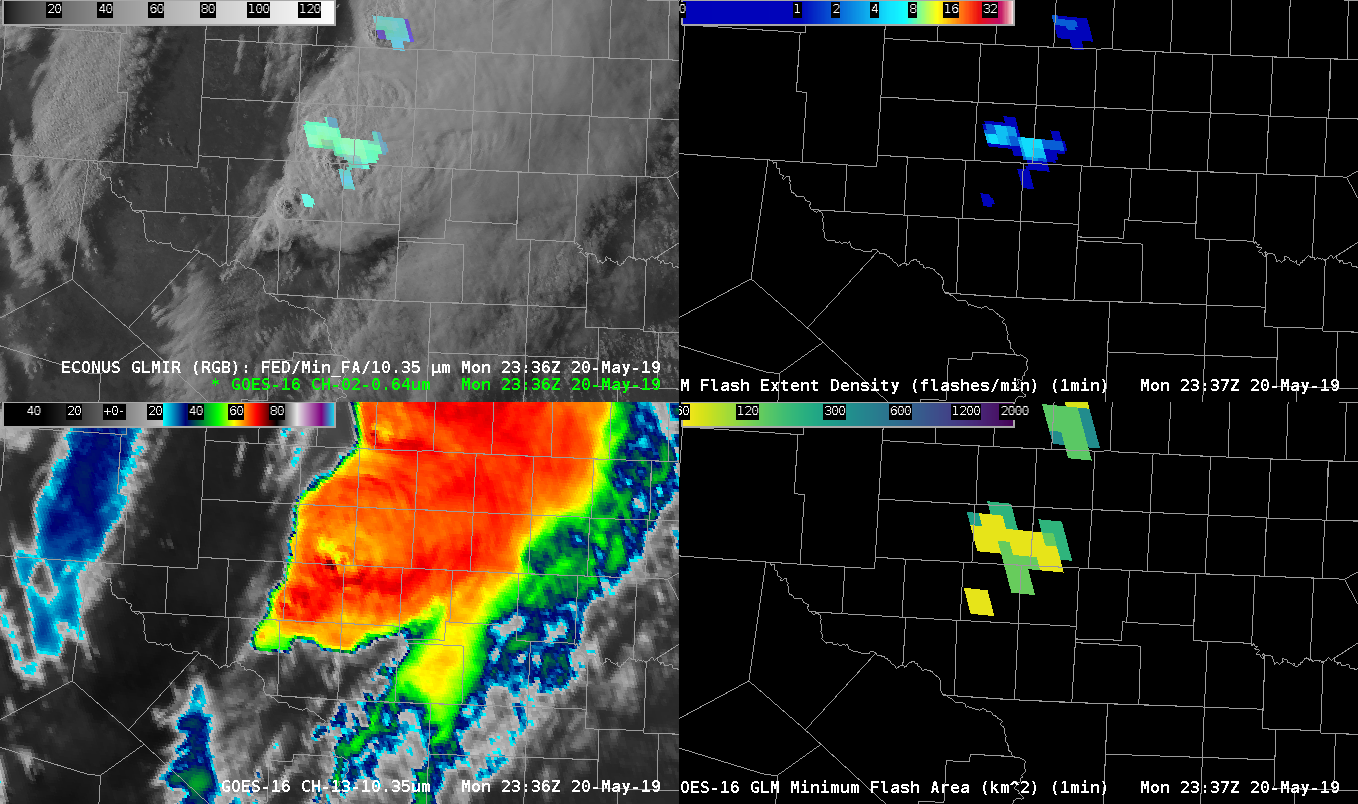
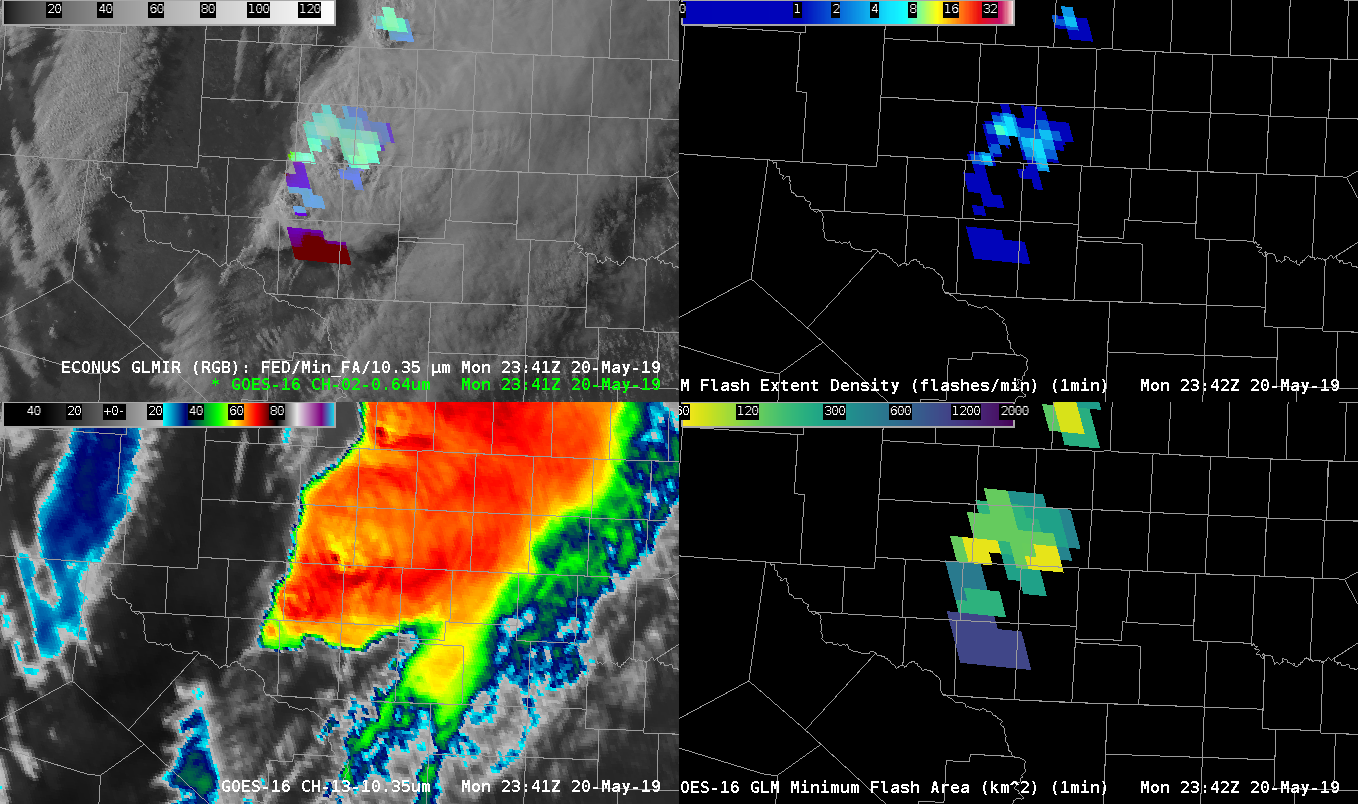
As the loop continues through the next 40 minutes, the intensity of the Rice County storm steadily increases as it moves northeastward, reaching Prob Hail values of 34% by the end of the loop (prob tor was still very low).  meanwhile, the storm originally in Dickinson County remained fairly steady state, with Prob Wind/Tor both at 68%.  It’s obviously conjecture at this point, but maybe the TOE product on the Rice County storm was signaling some type of intensification. hard to tell from just this one case, but interesting to note nonetheless.

Thorcaster


Comparing GLMIR to regional radar

The GLMIR imagery is doing a nice job this afternoon pinpointing the most active portion of the line of convection moving into eastern MO, highlighting this area in cyan. It also picked up on a region of lightning which developed within the stratiform region to the north (shaded in purple).

-64BoggsLites

Difficult Warning Decision as Storms Enter LSX CWA

The northern extent of a line of storms that has produced sporadic wind damage is approaching the LSX CWA from the south. One of these storms has good reflectivity structure with a tight front reflectivity gradient and a rear inflow notch. However, these storms appear to be entering a more stable airmass. This is reflected in the ProbSevere probabilities of the storm in question compared with one just a bit further north:

The northernmost storm with the cool contours has only a 22% ProbWind and is in an environment of only 715 J/kg MLCAPE (per the sampling feature). Meanwhile the storm in question to the south in the warmer contours has a 90% ProbWind with 1220 J/kg MLCAPE. These storms are moving to the northeast toward the more stable air. Incidentally, the All-Sky LAP CAPE does not depict as sharp of a gradient in the CAPE compared with the RAP-derived ProbSevere values:

I am not sure which is more accurate but I suspect the model-derived values are more accurate in this situation.

Furthermore, a weakening trend in the Flash Extent Density is observed on the northern end of the line:

This storm still deserves a warning, but we will see how quickly it weakens.

Ron Dayne

GLM Storm Intensification

Storms are trending sub-severe across most of our CWA at this hour, but 1 cell behind the initial line started getting its act together. Here is the GLM Flash Extent Density (top left), GLM Minimum Flash Area (top right), GLM Total Optical Energy (bottom left), and KLZK base reflectivity (bottom right) before the cell started intensifying:

The large FED and MFA bullseye imply the updraft is intensifying on this storm. This proved to be a useful proxy because this was the result 8 minutes later:

This suite of products has a lot of utility for pulse severe events and DSS on-site weather events. -Atlanta Braves

Lightning Jump in GLM Products

GLM flash extent density product did a good job showing a jump in lightning activity over north central Kansas Tuesday afternoon. The flash extent density (upper right) increased some 10-15 minutes before the strongest reflectivity (upper left) was seen at the surface, showing that the lightning jump could have been used to get a lead time on potential hazards such as hail, etc. Also of note, there is no easily discernible change in the total optical energy (bottom right) product despite the detected increase in lightning activity. The average flash area product (bottom left) also exhibited little change.

Dave Grohl

Increase in lightning activity across SGF CWA

GLM flash extent density (top left) and flash event density (top right) have shown increasing trends over the last 20-30 minutes across southern Missouri, within the broken line approaching the LSX CWA. Both of these products help to identify locations within a linear feature where updrafts are maximized. Additionally, the total optical energy product seems to be matching up well with respect to trends when compared to the ENTLN cloud flashes and CG strikes.

-64BoggsLites

ProbSevere Running Hot in SGF CWA

Looking at convection developing upstream across southern MO, I noticed prob severe had an object advertising 71% for TOR in the northern portion of the SGF  CWA (about a county and a half south of the CWA bondary. This particular cell does not show any rotation in the SGX base data, the Azimuthal shear doesn’t show much, and GLM lightning shows no electrical activity with this cell. I’m assuming the algorithm is keying more on environmental factors than anything else in coming up with this probability?

-64BoggsLites

GLM RGB first view…

So, here’s an interesting concept…GLM data merged with GOES-16 IR (10.3 um) to create an RGB.  I think I like it!  Data fusion concepts like this are increasingly important in data-heavy AWIPS, especially during severe weather events and for situational awareness activities.  So, this RGB uses Flash Extent Density as the Red component, Minimum Flash Area as the Green component, and 10.3 um imagery from GOES as the Blue component.  The RGB has been tailored such that high FED results in increased red values, while Minimum Flash Area is reversed with respect to green colors (lower values equal increased green) and the IR temperatures from the 10.3 um band are also reversed so that lower temperatures result in higher blue colors.  So, for example, the end result is that high FED, low minimum flash area and cold IR temperatures result in brighter colors (near white) that physically indicate intense lightning, collocated with intense updrafts and cold cloud tops.  Meanwhile, anvil-type lightning (cold cloud tops, generally low FED and high minimum flash area result in colors more towards purple.  Colors leaning towards reds, yellows are relatively young, but intense convection in new, warmer convective cloud tops.  This shows up well, watching young convection feeding into an area of ongoing convection at the tail end of the convective complex today.  Ok…I’m writing this at the tail end of activities today, so I had to rush through this.  =)

Kris