GOES Sounder RGB product shows airmass changes/extent of convective development

When you want a visual depiction of what the airmass structure looks like, the GOES Sounder RGB product can fill the bill.  The image below is that product at 22Z, along with RAP13 500 mb winds to show the airmass movement.  You can clearly see the airmass difference along the Red River.  The bluer colors are more typical of midlatitude airmasses, while the greenish red area is associated with a subtropical airmass.   There is even a wind shift line in the RAP 500 mb winds, showing the airmass boundary. The convection over west Texas shows up clearly as the white areas.  These storms are feeding off the better instability and moisture provided from the south.

We think that the increasing midlevel flow provided by the advancing subtropical airmass will help to sustain the Texas convection and allow it to organize into an MCS structure over the next few hours.

CL

GOES_Sounder_RGB_051413_2200

Tags: None

GOESR CIRA/CIMSS Simulated IR/WV Verifies Well

The first image is a GOESR CIRA CIMSS Simulated IR image from sometime 15-18 UTC for 22 UTC on May 14, 2013, while the second image is the actual IR image
at 2201 UTC.  Overall, the simulated IR image did a great job capturing colder cloud tops from convection in west Texas as well as isolated convection over New Mexico.  In addition, warmer cloud tops across south Texas were handled well.  This product may be helpful for importing into GFE/IFPS for forecast updates as well as short range (3-6 hr) public and aviation forecasts.

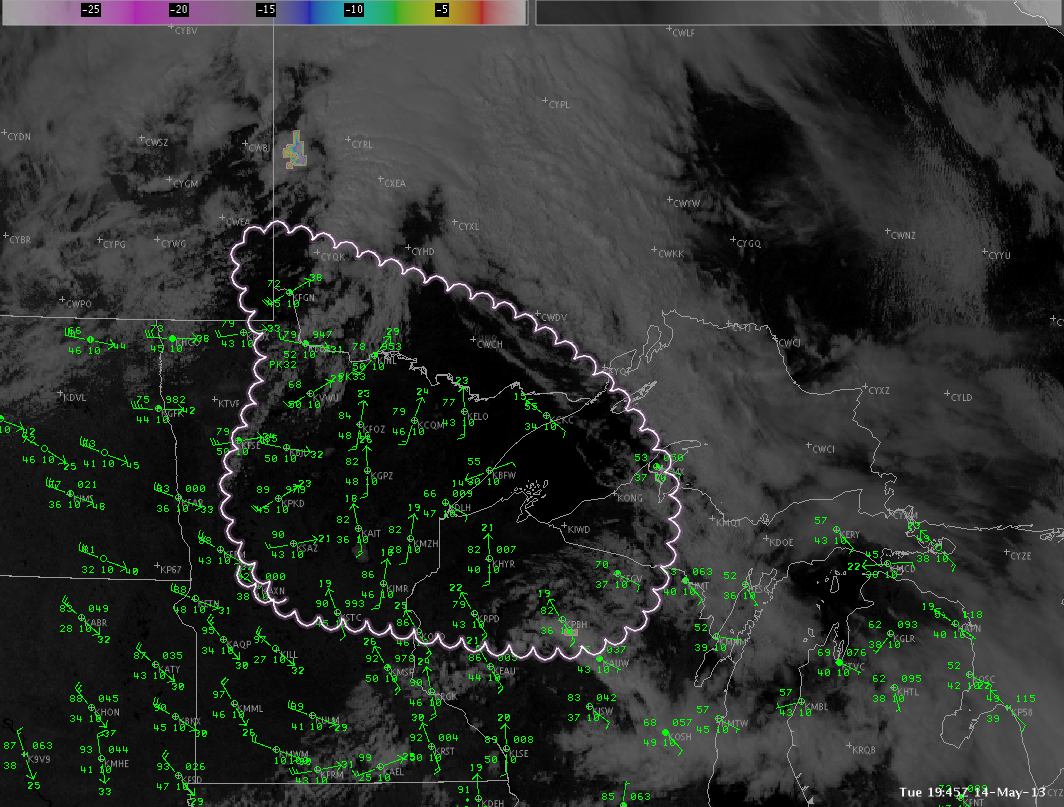
The third image is the simulated water vapor image from 15-18 UTC for 22 UTC, while the fourth image is the actual water vapor image for 22 UTC.  The results were favorable with the simulated WV performing well with convection over west Texas. The ribbon of drier mid/upper level air from the Texas Panhandle to Oklahoma is reasonably well depicted though the simulated image was a bit too far south compared to the actual. The simulated image in New Mexico verified very well showing convection  mainly along the higher terrain across the central part of the state.
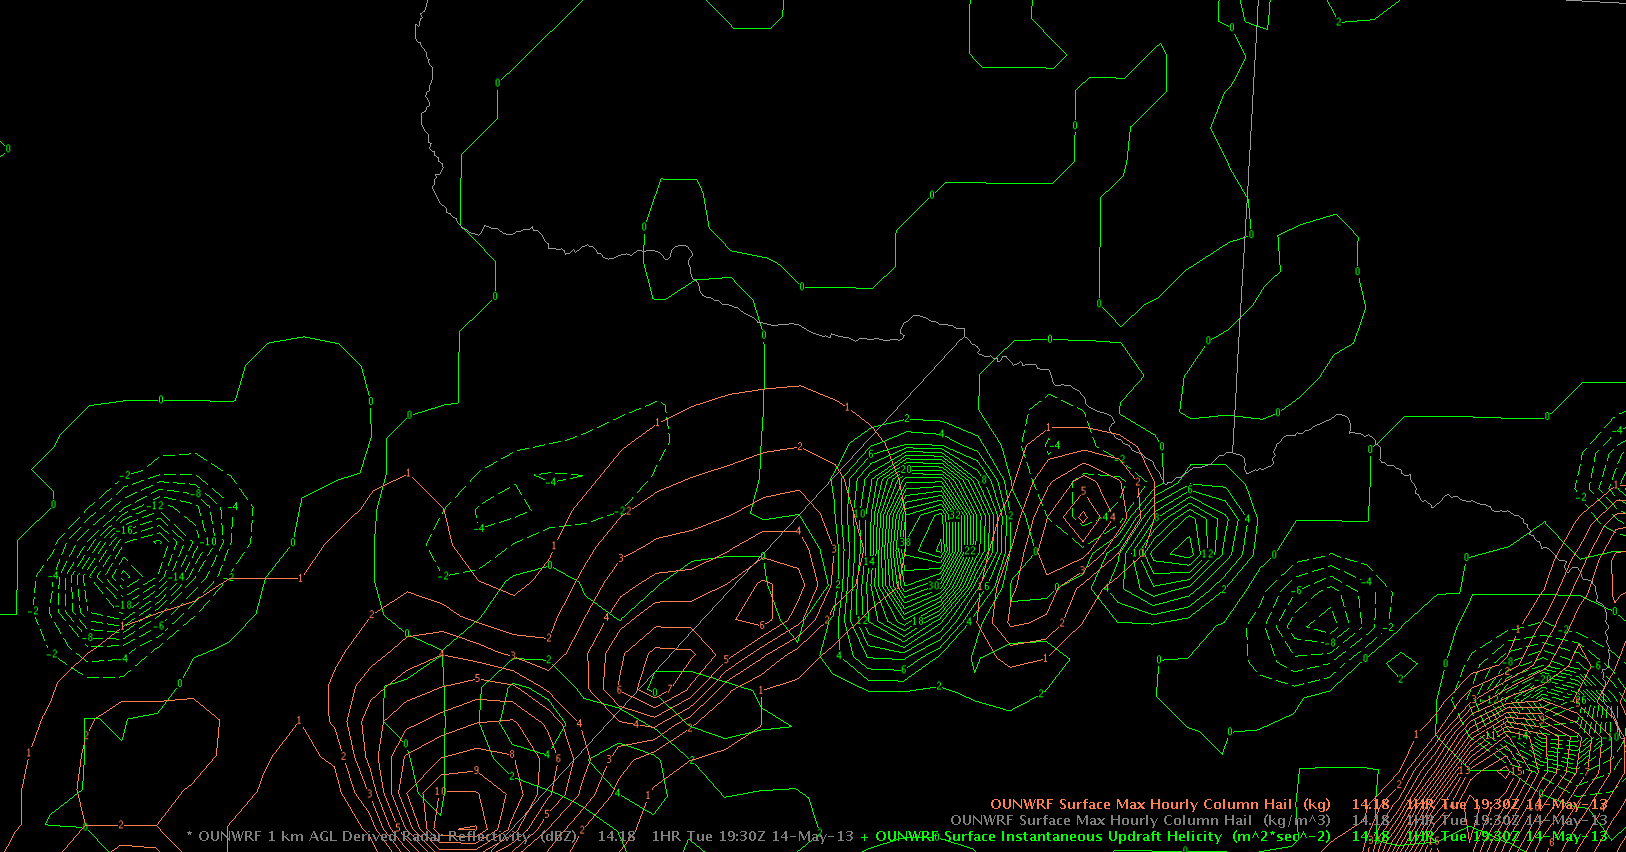
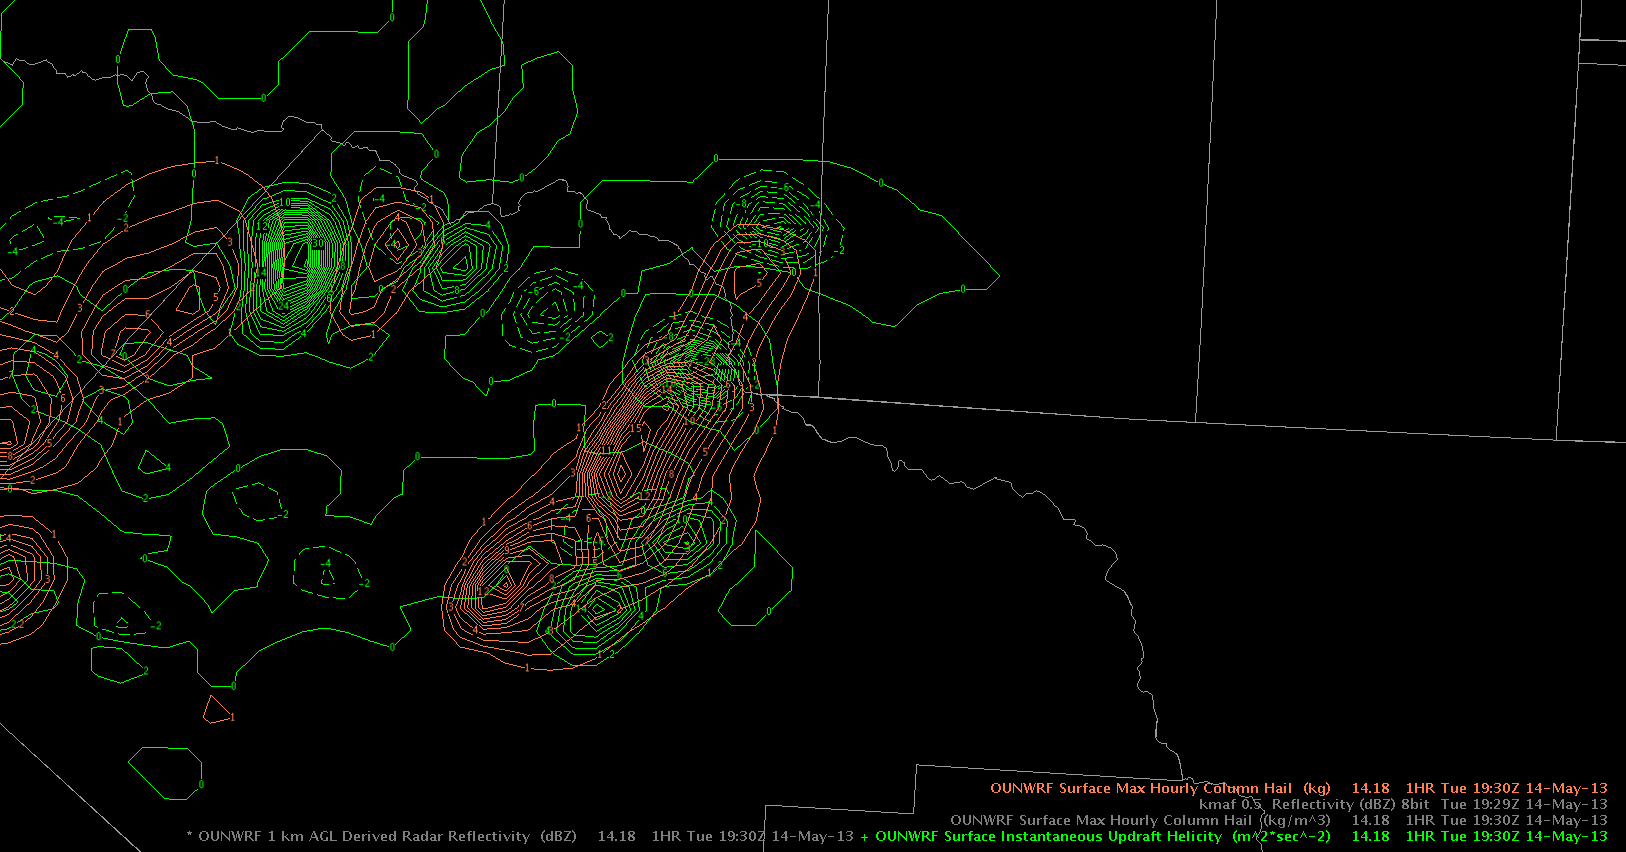
Tags: None

GOESR UAH Convection Initiation Across Far Western Texas

F

Focus on the two red areas above where convection initiation is above 90%.

Both of the red areas, especially the southeast one, depicted an increase in 0.5 Degree reflectivity indicating developing convection.  This product seems to be doing a good job with new developing convection, though much of this convection would not sustain itself likely due to a weakly sheared environment.  I would like to see how this product responds to a more strongly sheared environment. Michael Scotten

Tags: None

LAPS analysis shows off its utility!

The storms over west Texas continue to build, and we expect some strengthening as they interact with a more favorable environment to the east over the next few hours.  Here are a couple of images that show the beginnings of this process, as well as the level of situational awareness that can be provided by the 3km LAPS analyses.  This first image shows the LAPS surface-based CAPE at 1930Z, along with the 0.5 base reflectivity at KSJT at the same time.  Note the strong cell 4 counties due west of the RDA.  This storm is moving towards the higher CAPE areas as noted by the bluer colors on the LAPS analysis.  What will happen when it reaches a better environment?

LAPS_radar_051413_1930

An hour later, we have the answer.  The image below shows that the storm has strengthened considerably after moving into the more unstable regime.  The warning forecaster watching this storm issued a test warning about 15-20 minutes after this image, with MESH values of 1.5 inches being seen.  LAPS definitely helped to explain how this storm was able to build into our first warnable storm of the day!

CL

LAPS_radar_051413_2030

Tags: None

OUNWRF and storms in W-Texas

Referring to the reflectivity/MESH post a few minutes ago, OUN WRF showed some signals of an increase in the severe risk just as storms achieved 60 + dBz cores. Attached below one can see an overlap of instantaneous updraft helicity (green) and surface max hourly column hail (brown). For most of the period until now, both parameters were persistently separated, which is shown below in the first image. Those storms had a pulsating character with relatively weak cores.

ounwrf_helicit_updraft_1930Z_1

It was interesting to see that betimes, OUNWRF produced stronger signals with a a better overlap of both parameters. Eventually storms began to intensify just in this area, finally producing our strong thunderstorms. OUNWRF gave some lead timing and increased confidence to the forecaster that an increase of thunderstorm’s strength could be expected.

ounwrf_helicit_updraft_1930Z_2

Helge

Tags: None

13 May 2013: Day 1, Week 2, Summary

The first day of operations worked primarily as a get to know AWIPS2, the products and the PIs. Forecasters were primarily located in the Missoula, MT CWA, with a late shift for a couple over to the Great Falls, MT domain.  Storms remained marginally severe through the  operational period, with only one experimental warning issued the entire evening. The majority of severe reports occurred post operations as an MCS moved across N.Dakota.

SPC Storm Reports for 13 May 2012.

Even though severe weather was a bit lacking, forecasters were able to explore the GOESR CI /CTC and nearcast products as well as the NSSL MRMS and HSDA algorithms.  The simulated satellite (from NSSL WRF) and CONUS LAPS products were also analyzed during operations.  Forecasters did not have a chance to review the PGLM / SPORT Lightning Tracking Tool, but it still remains a possibility Wed and/or Thurs of this week.

K. Calhoun, Week 3 Coordinator.

Tags: None

14May2013 2000Z Mesoscale Discussion (Area #2 – W Great Lakes)

Monitoring the potential for convective development across W Minnesota / SE South Dakota, and across central Nebraska.

Shortwave trough currently progressing east across S Saskatchewan into E Ontario providing support for some initial development across the Canadian provinces, as seen in IR / VIS / CTC data. Large-scale lift aloft, in association with eastward progressing frontal boundary is supporting a line of agitated cumulus extending south into NW Minnesota. Nearcast difference CAPE product indicates an axis of weak-to-moderate instability (500-1000 J/kg) in front of this boundary extending south into NE and IA. WRF simulated IR fails to develop much of any activity across N Minnesota, keeping all activity developing after dark across the UP of Michigan. Farther south and west, it shows better development across Iowa and Nebraska around 00Z. However, considering best large-scale forcing exists closer to the Canadian border, and model fields were generally overestimating surface dew points farther south (forecast >60 versus AOB lower 50s being observed), thought is that best potential may exist closer to the international border over the next few hours.

If storms can develop, dry low levels and steep lapse rates support a high wind threat from higher based storms. Better wind fields farther north (0-6 km shear >50 kts) and slightly cooler temps also support an enhanced threat for marginal severe hail closer to the Canadian border.

14may2013_2

Picca

Tags: None

Mesoscale Discussion for West/Central Texas

Isolated to scattered unorganized thunderstorms currently over beautiful West Texas will likely increase in coverage through the afternoon and may congeal into one or more MCS by 00z as the storms move east into increasing 0-6 km bulk shear (from 30-40 kt) depected by the RAP13 and increasing MLCAPE (800-1500 J/kg) suggested by LAPS.  The image below shows the LAPS surface-based CAPE…depicting the area of highest instability at present where storms will be favored to develop.

LAPS_CAPE_051413_2000  The 18 UTC OUNWRF model reflectivity depicts the expected scenario.  The first image shows the model composite reflectivity forecast at 2030Z, and the second is for 0200 Z, showing the change in mode from multicells to MCS.  The main hazards will most likely transition from isolated large hail reports to more damaging wind reports as the storms become better organized.  The MCS may weaken with the loss of daytime heating and become more elevated after 02z with a diminishing wind and hail threat.

OUNWRF_compref_051413_2030

OUNWRF_compref_051513_0200

Tags: None

Scattered initiation in far west Texas

Placed beneath the left exit region of an approaching mid/upper jet from the SW, scattered storms evolved in a weakly sheared environment. Latest reflectivity scans reveal a few 60 dBz scans with strongest cores and MRMS MESH pointing to some small hail…still sub-severe. With SBCAPE already exceeding 1500 J/kg in many places, the overall hail and wind gust risk constantly increases during the following hours…however scattered initiation likely causes messy clustering of storms with decreasing diabatic heating. The focus for more severe storms will be east of the Midland area, when storms finally evolve in a stronger shear environment. We’ll look for current storms to send outflow boundaries to the east for initiation in SPC’s SLGT risk area next to forced initiation as the upper trough further approaches.

radar_MESH

Radar reflectivity with MESH atop.

Helge

Tags: None