Tracking Meteogram

trackingMeteogram2While this tool is fun to play with…I’m not sure it tells me anything I can’t already see. However, watching the trends of multiple storms against one another is nice. This product would be most useful for well behaved (non-deviant) mature storms where less user input in required for accurate output. Not sure how the graphs on the right work, as a new one appears each time a new meteogram is added, but there are duplicates. I suppose that if you load a product with more variables, i.e. KDP, CC, etc., there may be less duplication and more valuable information.


-KP

Tags: None

tracking meteogram tool

you can add multiple tracks to the same base image. I think this would be best again for SA and not necessarily the warning forecaster to keep an eye on which storms are growing/decaying.

jason anderson

Tags: None

overshooting tops detection

the overshooting tops detection is very good to overlay on satellite, especially at night over an IR image. I understand it’s a ‘yes/no’ algorithm, but the legend and sampling readouts are not at all useful, even a bit distracting.

jason anderosn

Tags: None

First impressions Day One HWT

My display on AWIPS for Monday 2 June at ~20Z

Being from the broadcast side of things, my familiarity with AWIPS is low, but the HWT folks here have given me a quick course and I am getting quickly used to setting things up for the week ahead.

From the pre-HWTB training moduels, I am very interested in the NSSL WRF sythentic satellite imagery (GOES R PG), the Prob Severe Model and the Convec. Initiation/LAPS.

I already use synthetic imagery from a 4km model (RPM run by WSI in Boston) and have found that it is very good for quickly determining how well the model is performing on a daily bases. You can easily spot errors in convection/cloud precip etc. I have also frequently found that the model will do well but has temporal errors of up to 120 mins. Will I see the see the same thing with the NSSL WRF Simulated imagery this week?? Time will tell and I will look for it. My first impressions today are that it is very similar to my previous experience and will be quite valuable as a model diagnostic tool.

Lightning jump is another thing I will be looking at hard because I have had recent experience in seeing this (albeit only on CG data) with a tornadic super-cell in Delaware that produced an EF1.

Theta e diff fcst for 0030 3 JuneLastly the CIMSS theta E difference seems to have high potential to improve temporal and spatial forecasts of convection. The case studies I looked at during the pre-HWT training were impressive. Am hoping to see it in action this week. Today we are looking at some high theta e diff moving into Southern KS this Monday afternoon. Will see if the convection goes along the boundary we have id’d near Osage Cty Okla.

Dan Satterfield
WBOC TV Salisbury,MD

Tags: None

more nearcast

overlaying the vertical theta-e difference with sfc obs really helps to identify and highlight boundaries and possible convective development. This is conjunction with a satellite image is a real good procedure for SA. Adding the CI product further enhances the areas within the CU filed that may develop further. For pre-planning ahead of convection this could be a real good tool.

jason anderson

Tags: None

Model forecasts are not performing very well today!

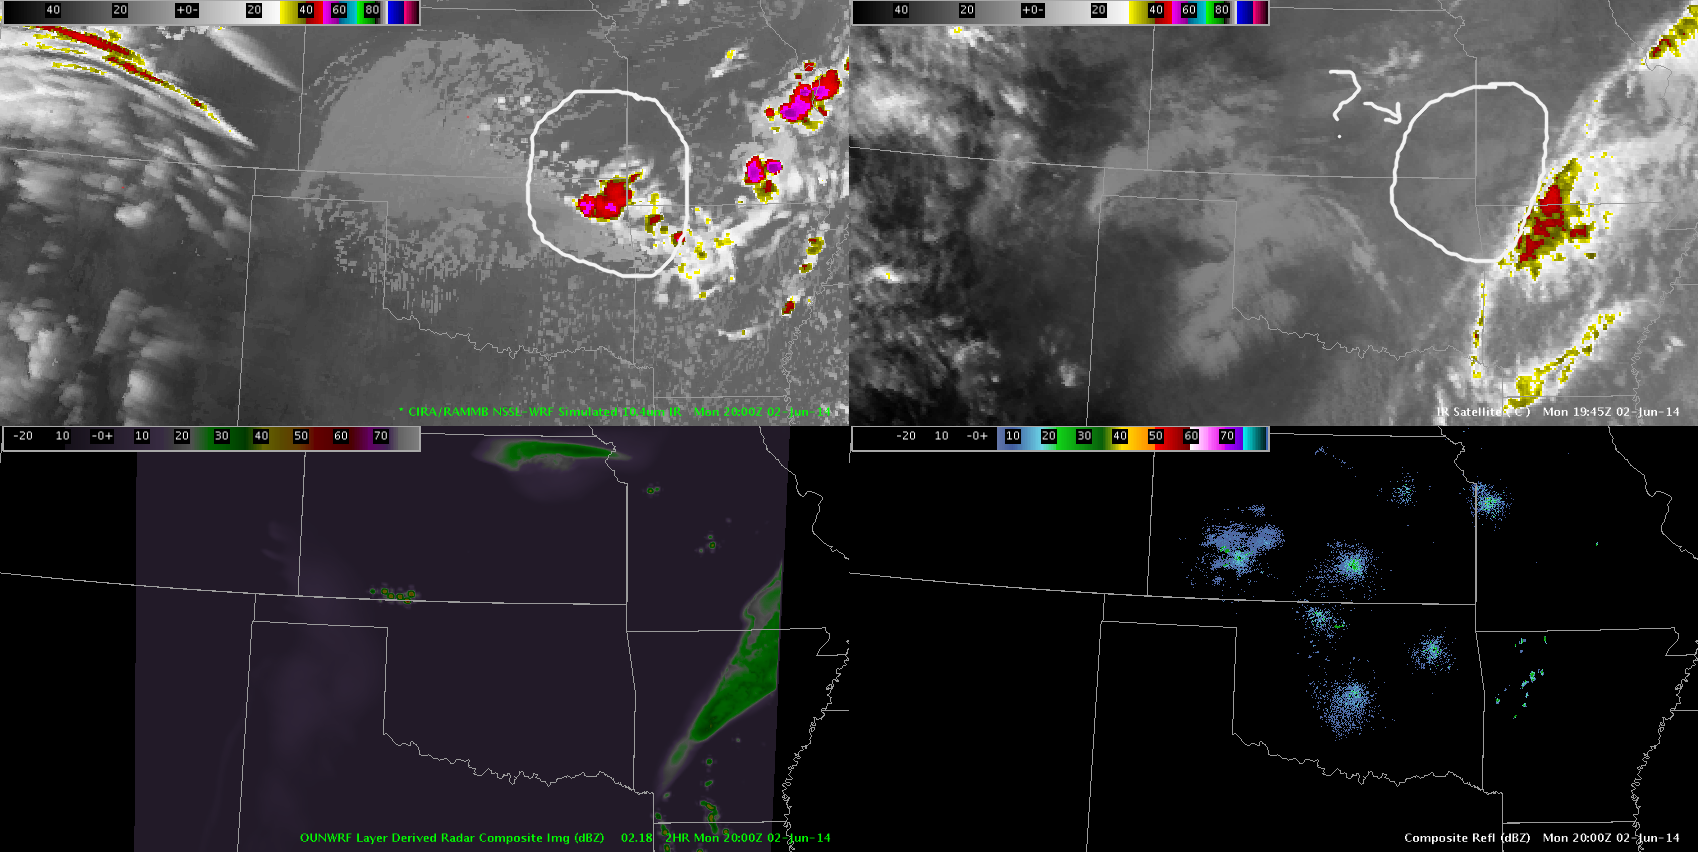
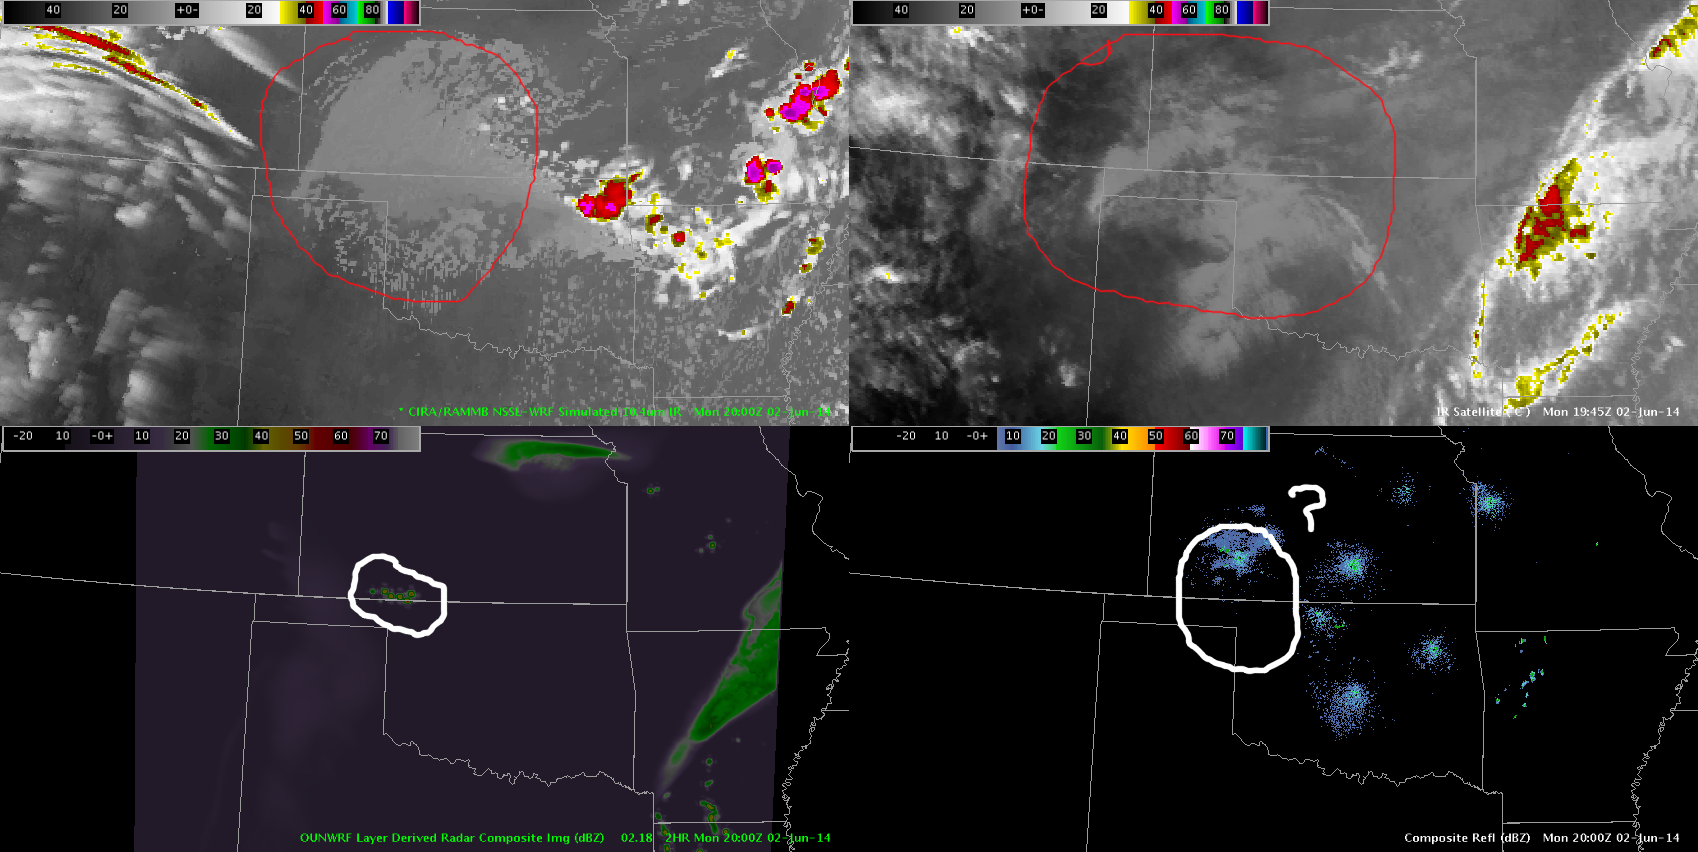
compare_current_fcst_radar&sat2 compare_current_fcst_radar&sat1Forecast satellite from the NSSL-WRF and composite reflectivity from the OUN-WRF on the left, actual IR Satellite and composite reflectivity on the right. In the bottom image, the forecast satellite imagery over the area circled in red is actually doing well, however the radar is not. This indicates that these products are probably not the best forecast tools for convection at this time.


-KP

Tags: None

near cast

not seeing much with the 500 or 780 mb equiv pot temp, but the difference shows a nice gradient in ne OK. there is a CU field in that area so convection is certainly possible. this does not at all lined up with the ounwrf which shows convection developing at the current time (~20z) further back to the west along the ok/ks border where more persistent cloud cover has been.

jason anderson

Tags: None

EWP Operations Update – Monday 6/2 – 2:37 pm

Overview:
Today is the first day of operations for the 4th (and final) week of the EWP Big Experiment.  Thus, we will begin operations in training / orientation mode.

Forecast:

In the upper troposphere, relatively zonal flow exists across the CONUS.  Thus, significant moisture return has commenced, finally solving the moisture problem the Plains has seen this spring season.  Vertical wind shear is relatively weak, but the presence of a strong elevated-mixed layer will augment instability and the associated probability of severe weather – especially west.

Two areas of probable severe convection exist: one in the Upper Mississippi / Ohio valley region and the other in the Southern Plains.  Given the presence of upper cloudiness to the east, and the lack of a lightning mapping array, we have elected to operate in the Southern Plains today.  We have localized the forecasters to two domains: Norman and Wichita.

Gabe Garfield
Week 4 Coordinator

Tags: None

Starting This Monday – The PHI and Big Spring Experiments (Week 4)

Monday 2 June 2014 begins the fourth and final week of our spring experiment of the 2014 NSSL-NWS Experimental Warning Program (EWP2014) in the NOAA Hazardous Weather Testbed at the National Weather Center in Norman, OK.  There will be two primary projects geared toward WFO applications, 1) a test of a Probabilistic Hazards Information (PHI) prototype, as part of the FACETS program and 2) an evaluation of multiple experimental products (formerly referred to as “The Spring Experiment”).   The latter project – known as “The Big Experiment” – will have three components including a) an evaluation of multiple CONUS GOES-R convective applications, including satellite and lightning;  b) an evaluation of the model performance and forecast utility of two convection-allowing models (the variational Local Analysis Prediction System and the Norman WRF); c) and an evaluation of a new feature tracking tool.  We will also be coordinating with and evaluating the Experimental Forecast Program’s probabilistic severe weather outlooks as guidance for our warning operations.  Operational activities will take place during the week Monday through Friday.

For the week of 2-6 June, our distinguished NWS guests will be Jason Anderson (CWSU Minneapolis, MN), Michael Fowle (WFO Aberdeen, SD), Kathleen Pelczynski (WFO Raleigh, NC), John Stoppkotte (WFO North Platte, NE), and Peter Wolf (WFO Jacksonville, FL).  Additionally, we will be hosting a weather broadcaster to work with the NWS forecasters at the forecast desk.  This week, our distinguished guest will be Dan Satterfield of WBOC-TV (Salisbury, DE).  If you see any of these folks walking around the building with a “NOAA Spring Experiment” visitor tag, please welcome them!   The GOES-R program office, the NOAA Global Systems Divisions (GSD), and the National Severe Storms Laboratory have generously provided travel stipends for our participants from NWS forecast offices and television stations nationwide.

Visiting scientists this week will include Alex Anderson-Frey (Penn. St.), Vesa Nietsosvaara (EUMETSAT), and Yuanfu Xie (GSD).

Gabe Garfield 
will be the weekly coordinator.  Matt Elliott (WDTB) will be our “Tales from the Testbed” Webinar facilitator. Our support team also includes Kristin Calhoun, Darrel Kingfield, Bill Line, Chris Karstens, Greg Stumpf,  Karen Cooper, Vicki Farmer, Lans Rothfusz, Travis Smith, Aaron Anderson, and David Andra.

Here are several links of interest:

You can learn more about the EWP here:

https://hwt.nssl.noaa.gov/

NOAA employees can access the internal EWP2014 page with their LDAP credentials:

https://hwt.nssl.noaa.gov/ewp/internal/2014/
Gabe Garfield
CIMMS/NWS OUN
2014 EWP Operations Coordinator

Tags: None