ENI Time Series Data Can Improve Storm Situational Awareness

After working primarily with the ENI data today for the first time, I think one of the things that I can takeaway is that the ENI Time Series showing total, in-cloud, and cloud to ground flash rates can improve the forecaster situational awareness.ENI_timeseries_0101
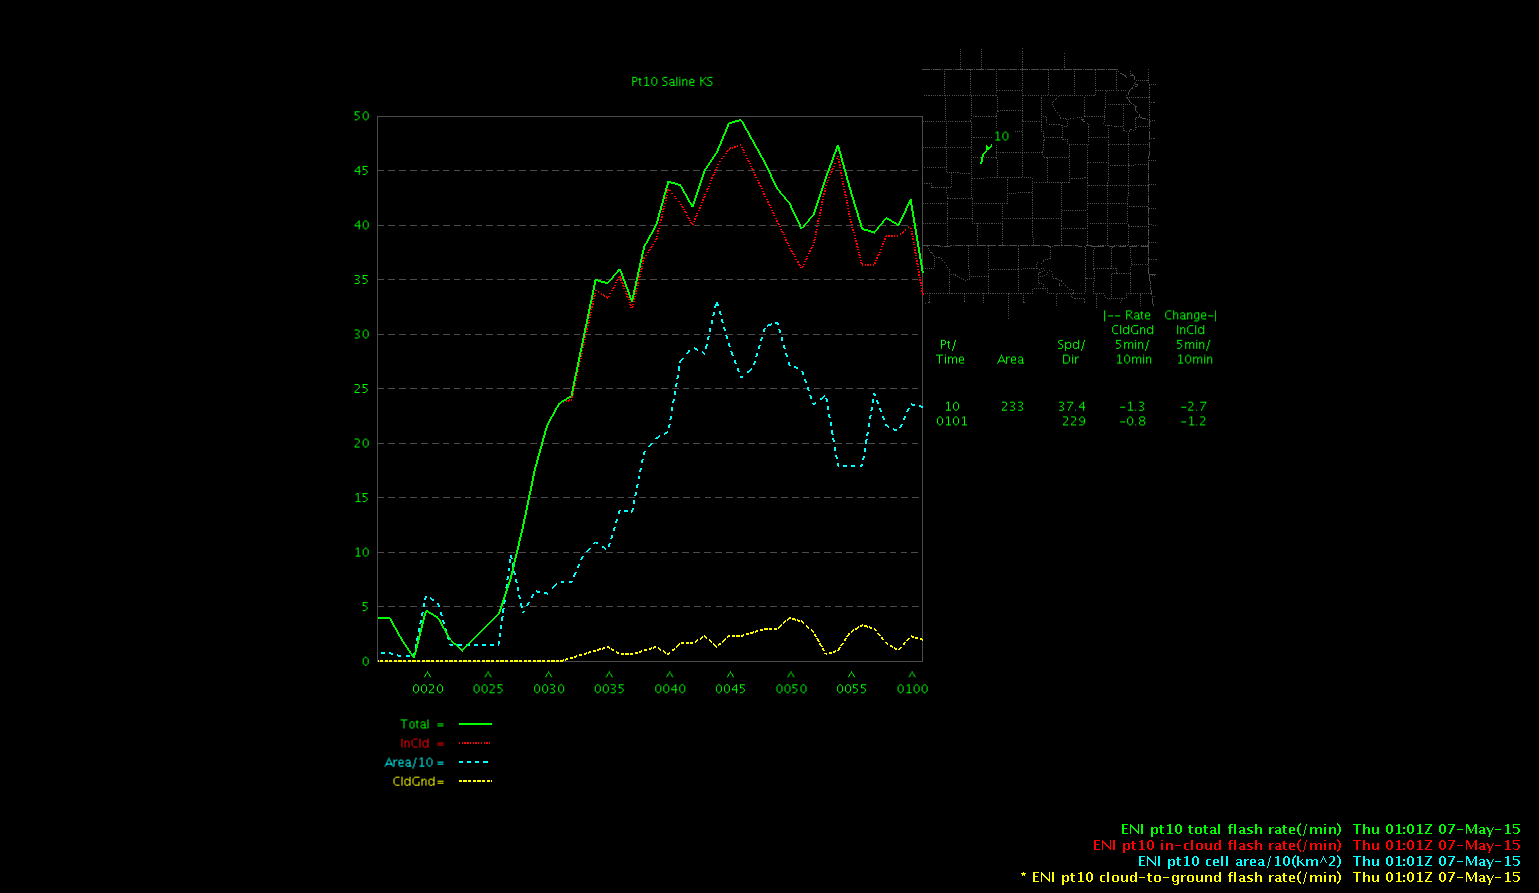
Especially in situations where you are looking a multiple storms within your warning area, the ENI Time Series data can help draw attention to other storms you may not be spending enough attention to.  I don’t think that the ENI flash rates or DTA improved my warning lead time as I found the base radar data still to be the primary warning tool which provided the best lead time but this data does provide confidence in the warnings issued.

Jack Bauer

Tags: None

OUN Wrapup

I should have know a busy day was in store for the OUN area when sitting down and already seeing a storm that needed a Tornado Warning. That continued throughout the rest of the day with numerous TOR/SVR warnings issued (at least 30 and probably over 40). With the quick startup, didn’t get much of a chance to look at the GOES LAP data other than a quick overview to start the shift.

With the size of the OUN area, I was jumping back and forth between 3 different radars and a significant distance between areas made for an overwhelming feeling at times during the shift (especially when trying to look at more than just radar). I used the ProbSevere and lightning jump throughout the shift and found them both to be very useful (especially for situational awareness). In most instances, saw both lightning jumps and rapid increase in ProbSevere before the storms really took off. With as busy as things were, I wish I could have looked at the lightning jump data more in real-time. Unfortunately, there just wasn’t enough screen real-estate to overlay another product (I tried to overlay it on radar data with 50% transparency and it was too much).

All in all, a busy but fun day in the OUN area.

-SRF

Tags: None

A few satellite product observations

Unfortunately we lost GOESR/CIMSS layer CAPE/PWAT products around 22Z. Originally we expected to have a short amount of time to form a mesoscale discussion for GID but quickly transitioned to warning mode, issuing both SVRs and TORs. We were not able to assess the UAH CI product as the area quickly became cloud covered. The Overshooting Top product successfully highlighted the stronger storms, especially those with large hail cores aloft.

GOESCIMMSoutage22_00Z

Brick Tamland/Alexander Darkband

Tags: None

Wrap up for Day 3

I used mainly lightning jump and Prob of Svr.  This was helpful with increasing confidence in issuing warnings but was not a deciding factor to warn. CI was used the first 3 to 4 hours of the shift before the CI shield became to thick to make it useful. Was able to assist the warning operator during the first two hours of the shift of where to be looking for development based on CI from satellite. This would have been more useful with much better familiarization of the CWA.

Saw some impressive hail spikes and deep convection today.

Lynford


Tags: None

NUCAPS and GOES LAP CAPE

The NUCAPS sounding data became available around 19Z.  We chose a point along the Nebraska/Kansas state line in a cloud free region.  Overall, the sounding appeared valid.  However, the surface dewpoint and temperatures were around ten degrees too low (in comparison to nearby METAR), producing too little CAPE.  After modifying the surface data, CAPE increased to around 2000 J/kg.  This was much higher than the 800-1200 J/kg values being observed from the GOES LAP data.  Considering the severity of resulting convection, the 2000 J/kg values were likely most representative of the environment.  The first image capture is the original, the second is the modified.GIDnucapsoriginal GIDNUCAPS2

BRICK TAMLIN/ALEXANDERS DARK BAND…Brick, is that TRIDENT?

Tags: None

ProbSevere and Lightning Jump for SA

I was focused on warnings for two areas of the cwa and completely missed out on this severe thunderstorm. Looking back, using ProbSevere and Lightning Jump data could be useful in maintaining situational awareness while in warning ops.

This first image taken at 2308Z, shows both the lightning jump and ProbSevere not indicating anything significant with this storm.

20150506_2308Z_LJ_PS

But jumping ahead to 5 minutes to 2313Z, there was a 2 sigma lightning jump as the ProbSevere rises to around 50%.

20150506_2313Z_LJ_PS

Then, at 2323Z the ProbSevere was up to 77% and there was a 1 sigma lightning jump.

20150506_2323Z_LJ_PS

The storm likely went severe shortly after that and a warning was issued later. Having a screen dedicated to those products could be useful in maintaining awareness where there were numerous warnings out. -SRF

Tags: None

ProbSevere success with linear storms in GID area

Multicell structure became more linear late this afternoon and although ProbSevere is more successful with individual cells, it still highlighted probabilities over 80% for many scans. Some cells possessed tornadic signatures in velocity/SRM while others contained large hail cores aloft. The higher probabilities definitely coincided with both hail/tornadoes in this line.

ProbSevereLine_2324Z_050615

Brick Tamland/Veronica Corningstone aka Alexander Darkband

Tags: None

Severe Thunderstorm Warning for Ellsworth KS

Issued a severe thunderstorm warning for Ellsworth county storm based on base data showing a 60 dBz core to 29.5kft and 50 dBz core to 37kft which resulted in a VIL the next volume scan of 60-65 kg/m2.  The ENI flash rate was minimal showing only 12 flashes at the time I started to write the warning and the ProbSevere was showing on 12%.  DTA_ProbSvr_2302

About 7 minutes later the ProbSevere jumped up to 81% but was not helpful in issuing the warning.

Jack Bauer

Tags: None