6/1/15: Bismarck CWA Discussion

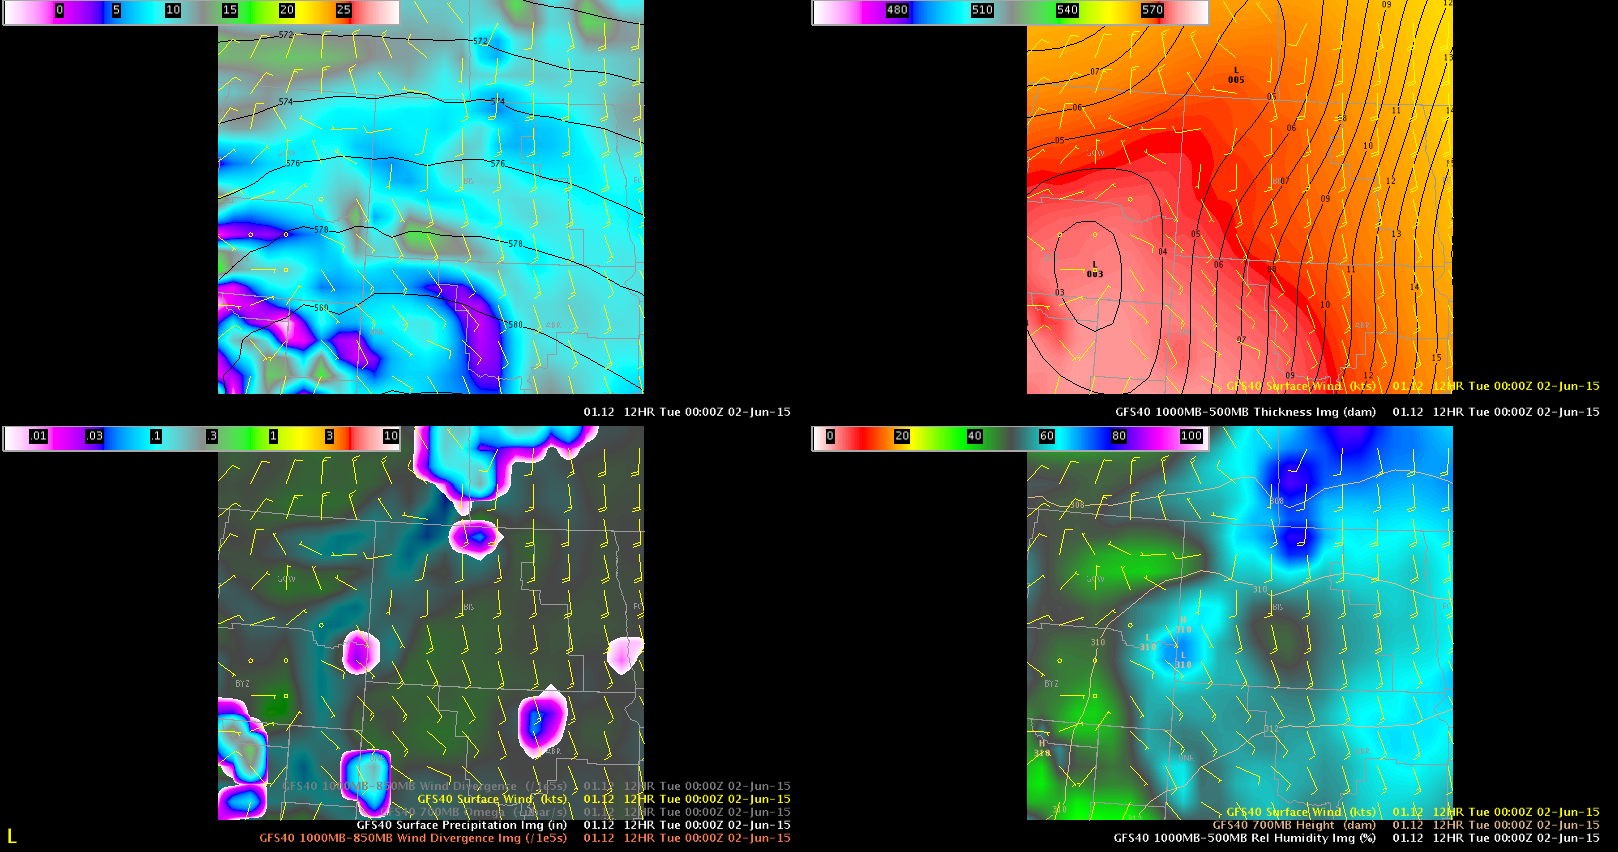
Overview: Main concern in the near term is focused on timing of convective initiation across eastern Montana that will advect into the western Bismarck CWA. Initial synoptic analysis reveals a broad upper low across the Pacific Northwest with mostly zonal flow across the Dakotas and a weak trough over Canada (Fig 1) dipping into the eastern Dakotas.
4panel_Synoptic

Fig 1: 00z Tuesday.

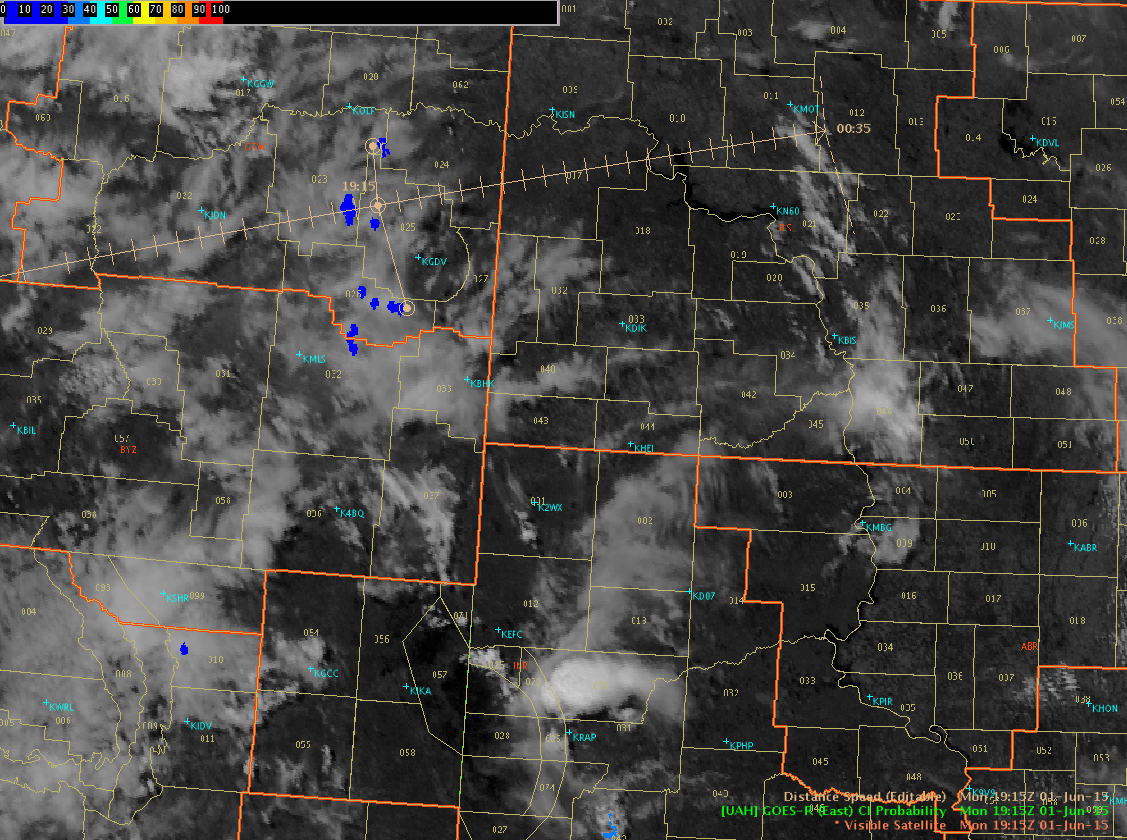
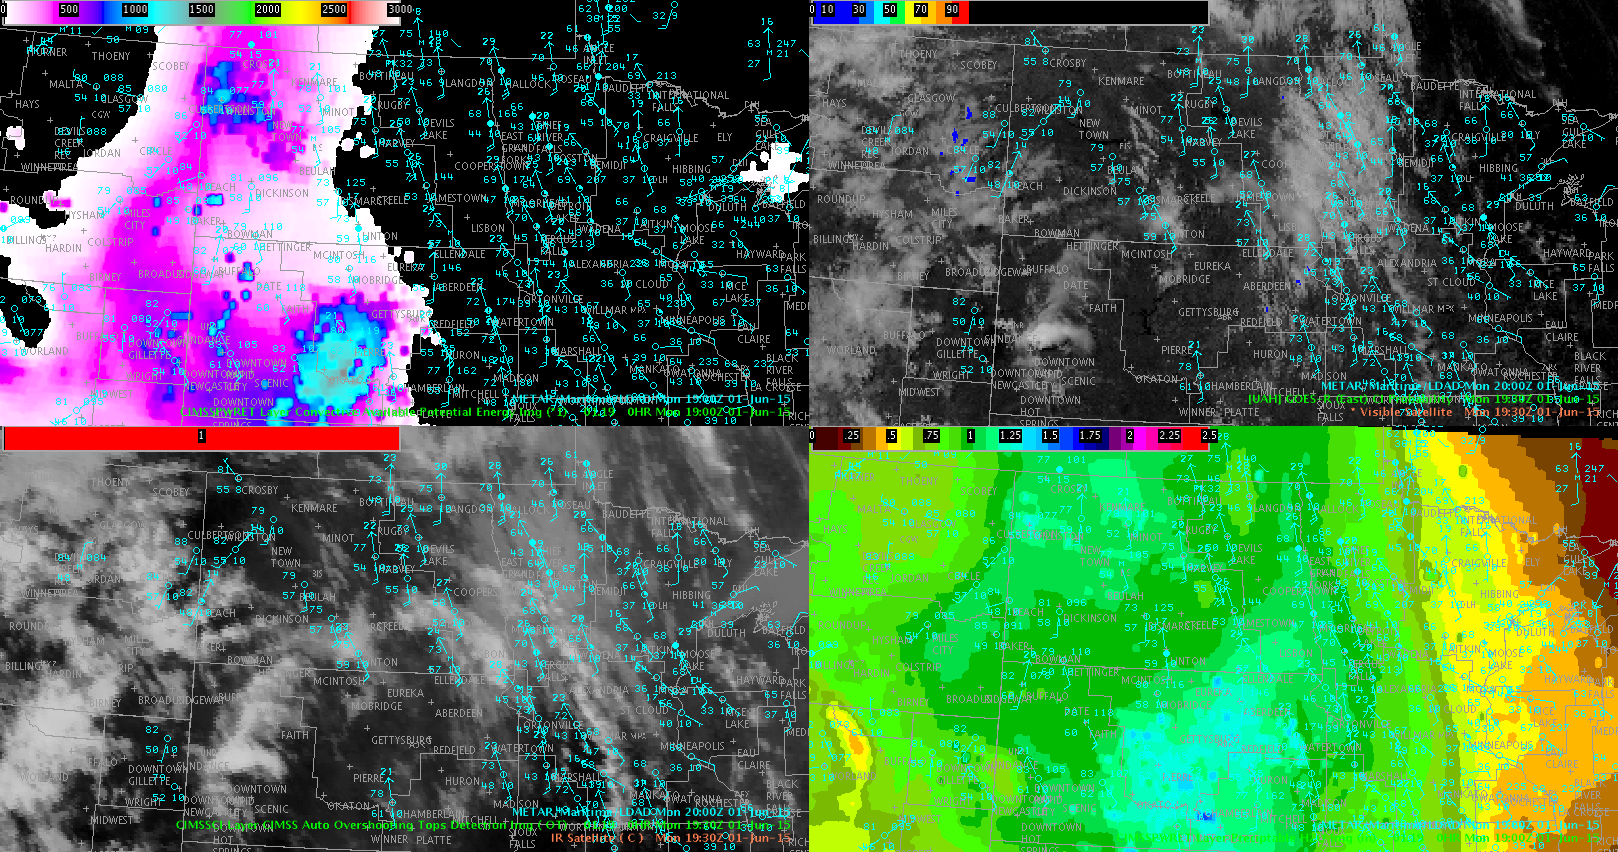
Initiation:  As of this writing, no convective cells of significance have developed. There is a lack of large scale forcing over the next few hours. Will initially focus on surface convergence associated with the surface low coupled with convective heating through the afternoon. CIMSS 900mb PWAT indicates plenty of low level moisture advection with south flow ahead of the surface low.  Surface dew points increasing to near 60 degrees. Inspection of the pseudo GOES-R CI data show about 15-20% as of 1915Z (Fig 2).  Estimating time of arrival into Bismarck’s CWA is estimated at 21Z using TOA tool. This seems in line with HRRR which develops around 22Z.  Also feel with cloud cover increasing across that the CI probabilities may be lower than expected.  CIMSS CAPE analysis (Fig 3) favors what are now cloud free areas and show mid 80s over 50s. If development occurs over eastern Montana and advect into this region we could see rapid development. Better dynamics trail the system making noctural convection appear favorable.
CIProb_1915Z_motion

Fig 2: CI and Vis. Probabilities around 15-20%
4panel_Synoptic_cimss

Fig 3: CIMSS CAPE Metars, Overshooting tops, PWAT, etc.


Monitoring:  Plan on monitoring CI probabilities in conjunction with traditional satellite and radar trends for anticipated development. Once convection forms will turn to experimental lightning, severeProb, etc tools.

Forecasters: Cattywampus/CoonieCatEye
Tags: None

GOES-R Products Aid in Mesoscale Analysis over Pocatello CWA

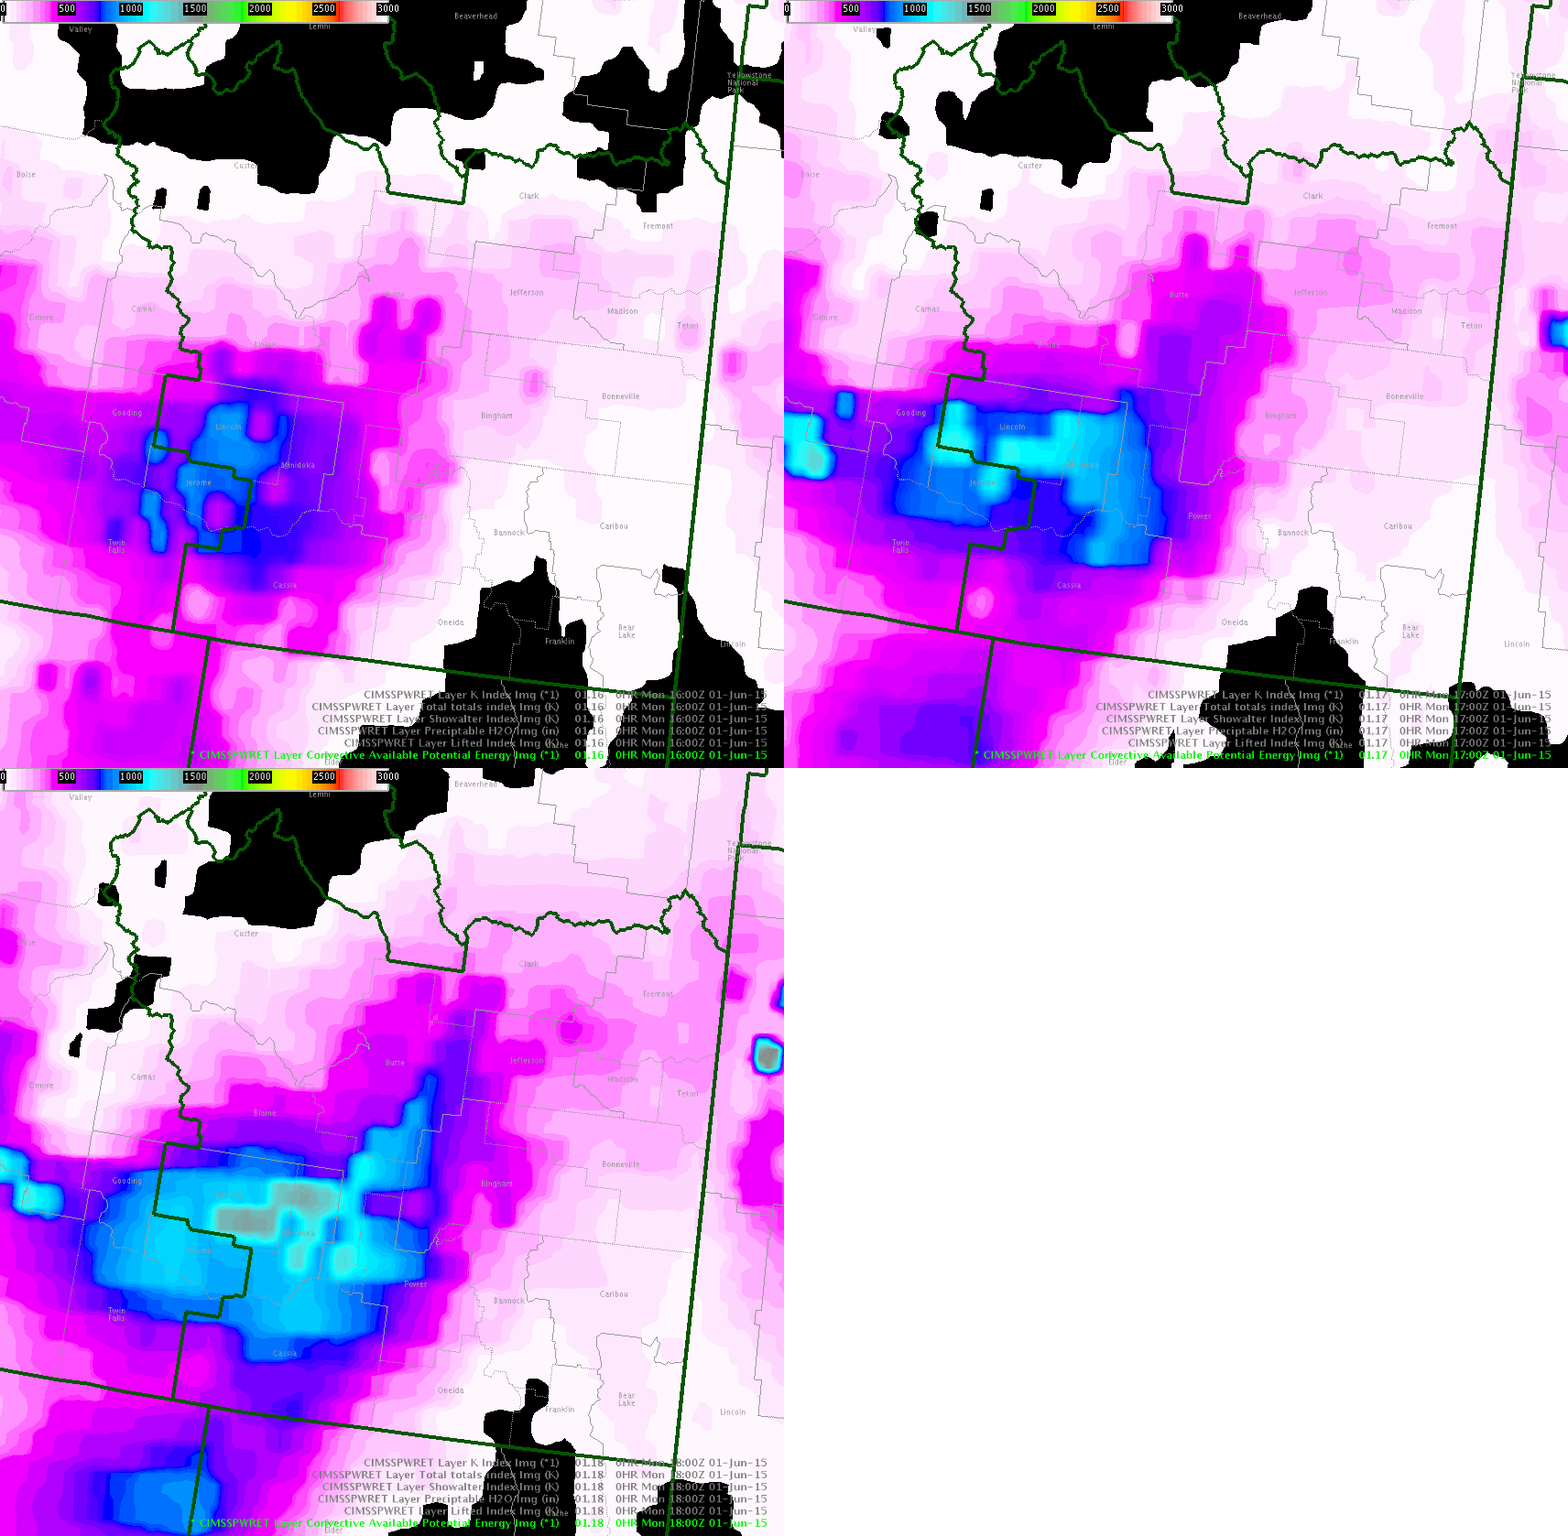
The GOES-R LAP products show an area of elevated CAPE values up to 1500 J/kg in the south-western portion of the Pocatello CWA. The GOES-R LAP PWAT product also shows the highest values (up to 1 inch) over the same area. Looking at some of the LAP products over the past few hours, the instability has increased and the environment has become increasingly more favorable for storm activity. Most of the convection is currently located further west, so expect storm activity to intensify as it moves east into this more favorable environment. The GOES-14-1-Minute visible satellite imagery shows increasing cumulus development over much of the CWA. There is also an area of thicker cloud cover across the northern and western parts of the CWA which may create a differential heating boundary.

LAPCAPE-Helen Hunt

Tags: None

CAPE comparison near Pendleton, OR

61_1931Z

A cu field developed in portions of the Pendleton, OR CWA shortly after 17z. The CAPE derived from GOES is underperforming compared to the RAP CAPE (up to 1800 J/kg). There is a zone where RAP CAPE is 600-1200 J/kg where the GOES estimate is zero. Just to not out-model ourselves, the GOES-derived CAPE does not match up with the cu field’s location.

A positive is that the GOES-R CI has pegged area of possible convection (in a few spots >50%) that lines up very well with where the cu field has developed. The outline of individual cloud elements that is discernible to the eye is also being picked up by the CI algorithm.

Jason Williams and MacGyver

Participants were reminded that the GOES-R CAPE values are CAPE in the layer between the LFC and EL, so to compare absolute values with (MUCAPE here), is not very 1-1. Additionally, these products use a GFS first guess, so if the GFS is way off for whatever reason, the retrievals will likely be off as well, even if they do provide some degree of bias correction – BL

Tags: None

ENI Cell Polygons: Complete Overlap Should Not Occur

The loop below depicts two ENI Cell Polygons completely overlapping  – which seems less than desirable. This overlap is depicted for a tornadic storm below and clearly the fetal polygon can be seen within the womb of the mother polygon (loop image underlay is the 0-2km Azimuthal Shear).

Also seen is the lightning ramp up in the pre-tornadic phase as the cell strengthened.

RockyILMTor_PolyOverlap

Tags: None

ENI data should prove very useful over marine zones

In areas that are poorly sampled by radar data…such as mountainous and farther offshore marine locales..the ENI data should prove to be very valuable. The ENI data could be the confidence factor in issuing or not issuing a special marine warning on a storm that looks to be marginally strong due to poor radar sampling.

Pickles

Tags: None

Utility of 17z NUCAPS sounding in MHX

The NUCAPS sounding has shown to be a realistic supplemental piece of environmental  data the last several days.

In comparison with the 12z sounding (fig 2)…the 17z NUCAPS (fig1) sounding did subtlely pick up on a weak inversion around 700 mb and 850 mb that was evident in the 12z sounding.  The NUCAPS sounding was more moist in the 400-500 mb level than the 12z sounding…which may have been due to the cirrus advecting in ahead of approaching convection. Differences between the 12z and NUCAPS soundings can give a rough and general idea of change in environment.

In comparison…with 17z SPC meso-analysis (fig3)…MU CAPE value were comparable.

So overall…I have been pleased with the utility of this sounding for re-assessing the environment each afternoon. It may be especially useful to sample a few NUCAPS points in an area of concern to get a consensus picture of the environment.

Fig 1 – 17z NUCAPS

17z NUCAPs

Fig 2 -12z MHX


12z MHX sounding

Fig 317z SPC meso

Pickles

Tags: None