
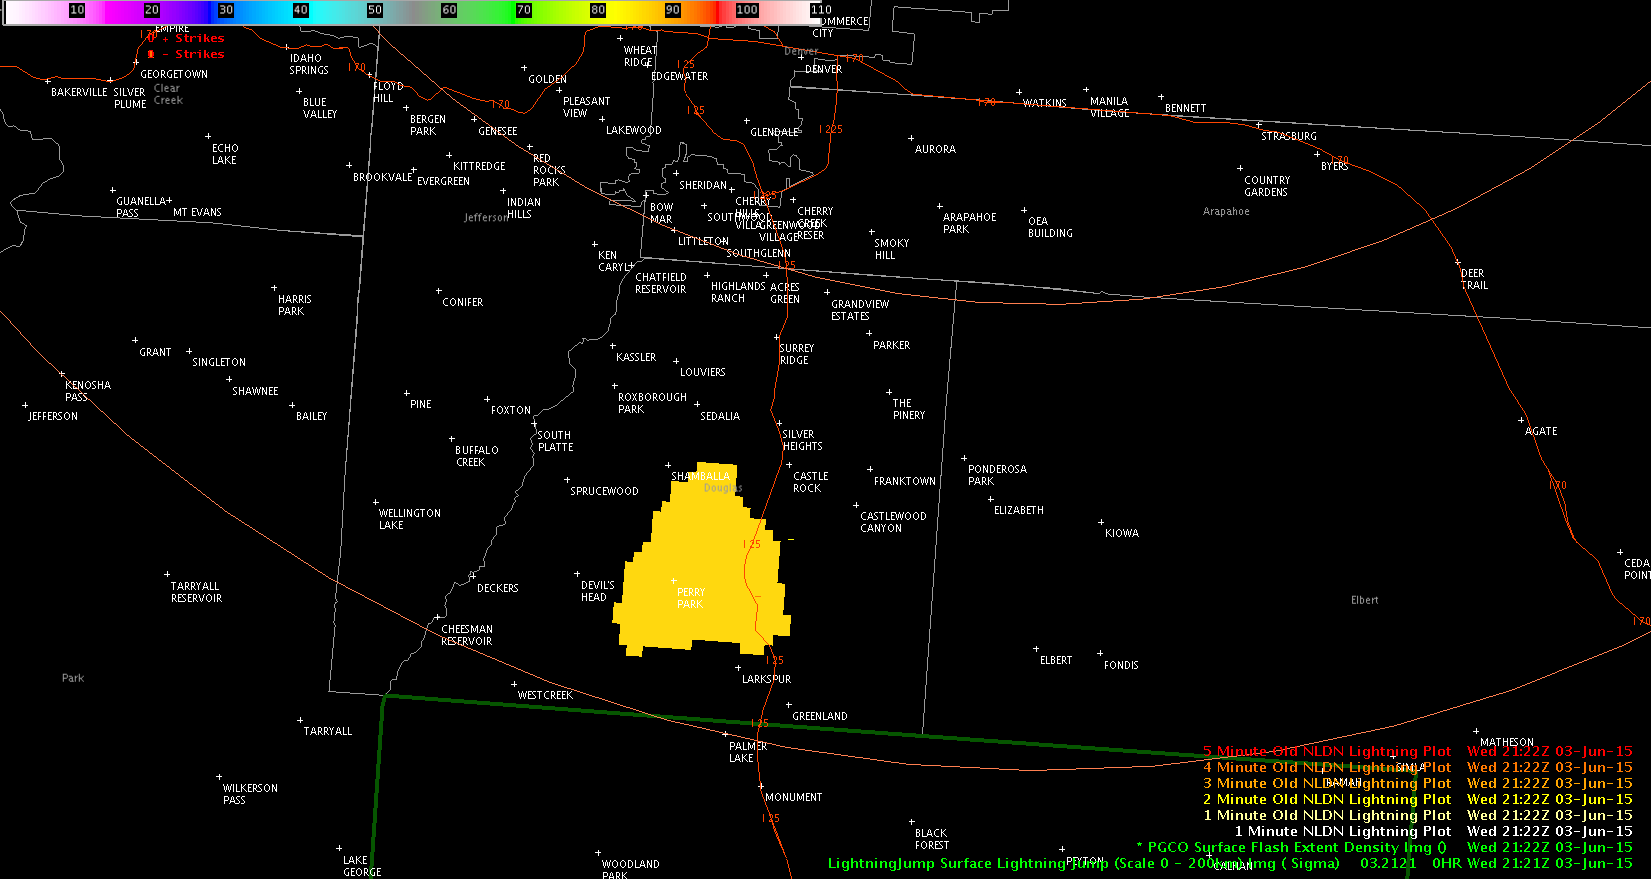
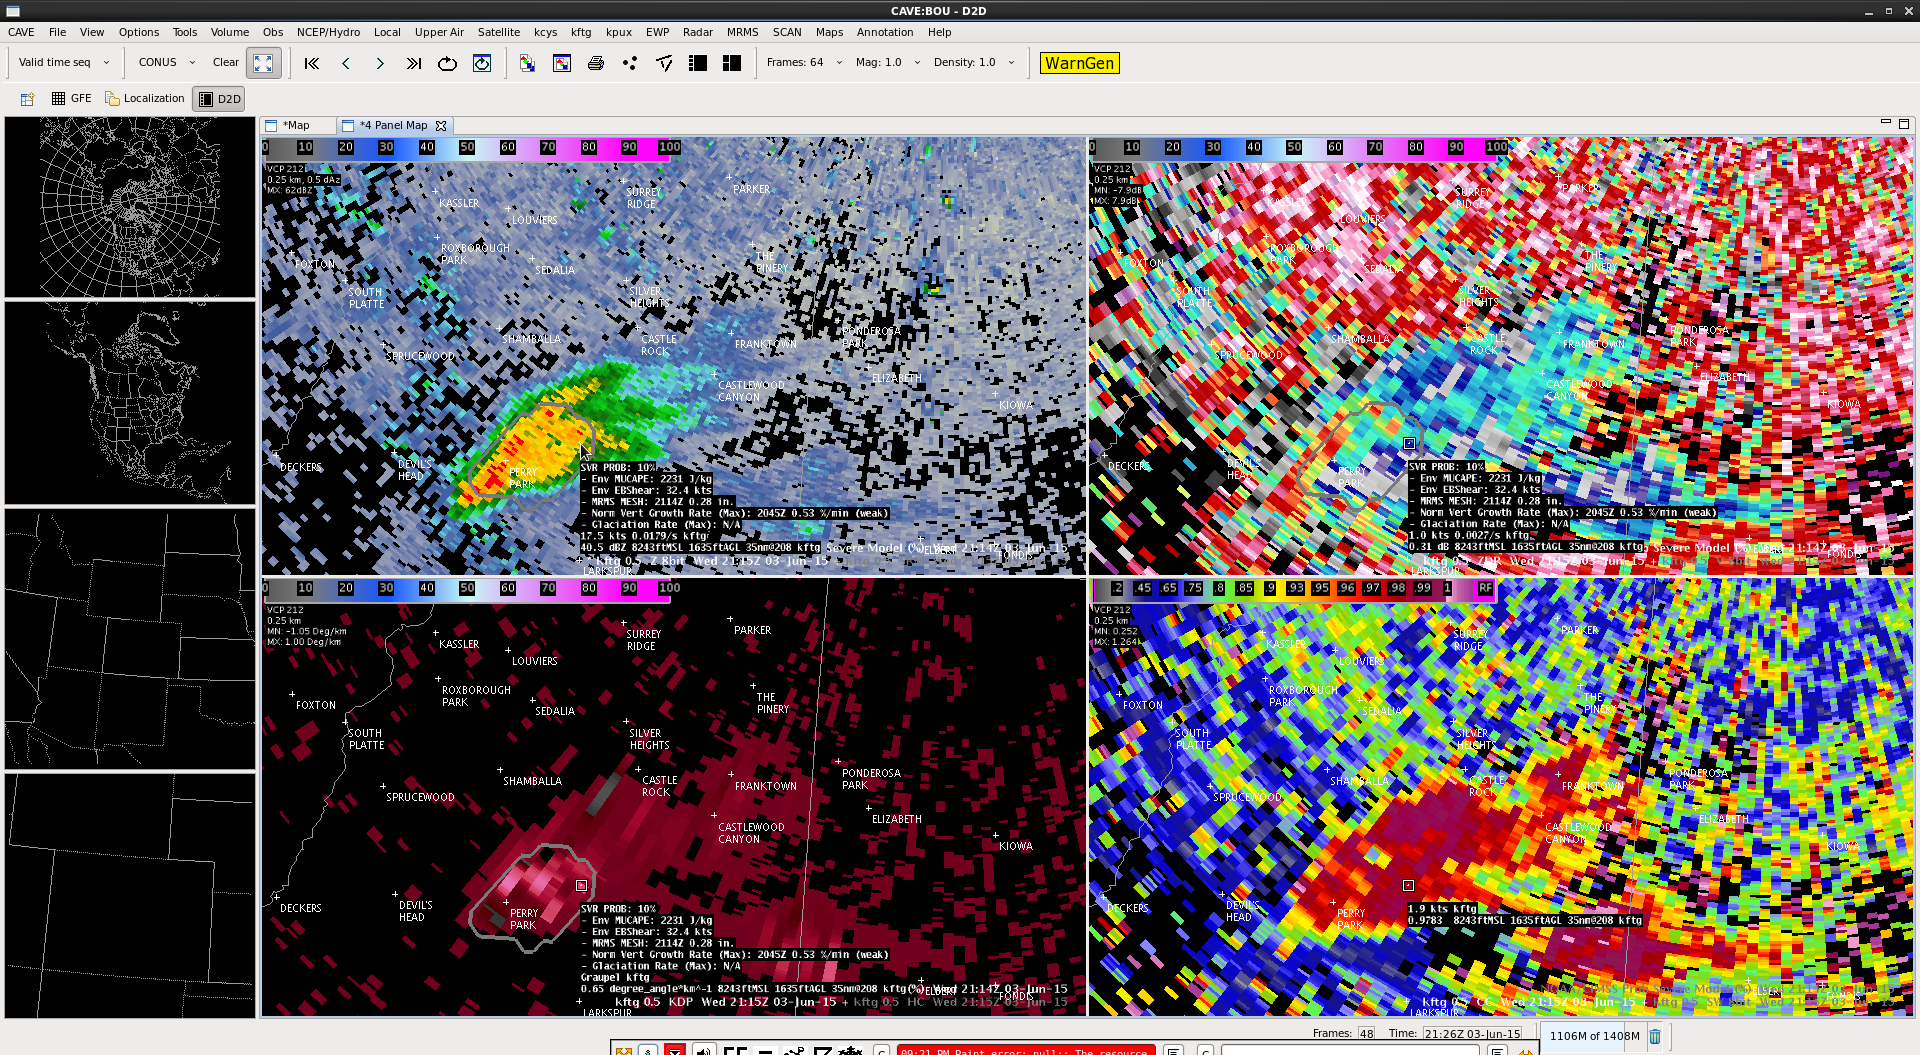
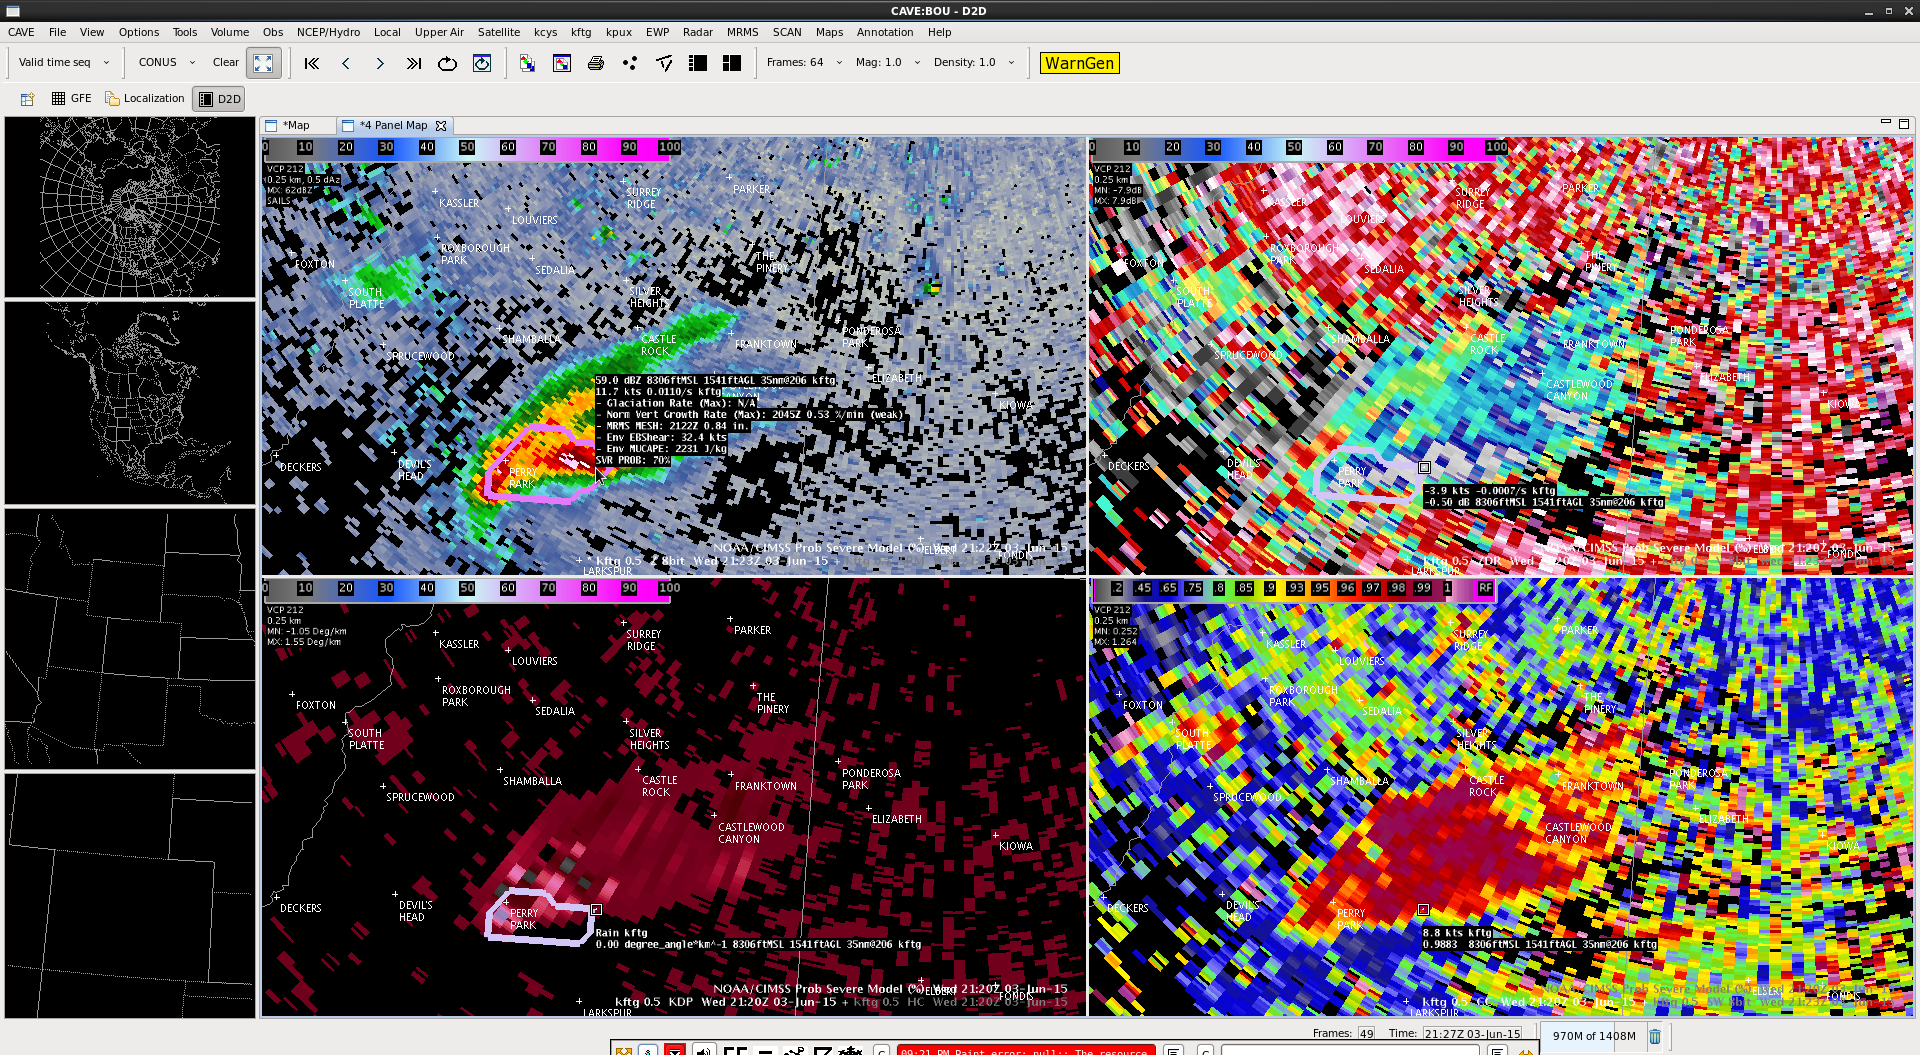
ProbSevere had a big jump – 10% at 2115z to 70% at 2122z and hitting 86% at 2126z.
TBSS evident on higher tilts.
Lightning jump of 3 sigma at 2122z.
Jason Williams
Official websites use .gov
A
.gov website belongs to an official government
organization in the United States.
Secure .gov websites use HTTPS
A
lock (
) or https:// means you’ve safely connected to
the .gov website. Share sensitive information only on official,
secure websites.

ProbSevere had a big jump – 10% at 2115z to 70% at 2122z and hitting 86% at 2126z.
TBSS evident on higher tilts.
Lightning jump of 3 sigma at 2122z.
Jason Williams
Click for loop.
1-min vis sat shows quick growth, which seemed to precede the appearance of the intensification on NEXRAD.

ProbSevere remains quite low, but has climbed to 14%.
Jason Williams
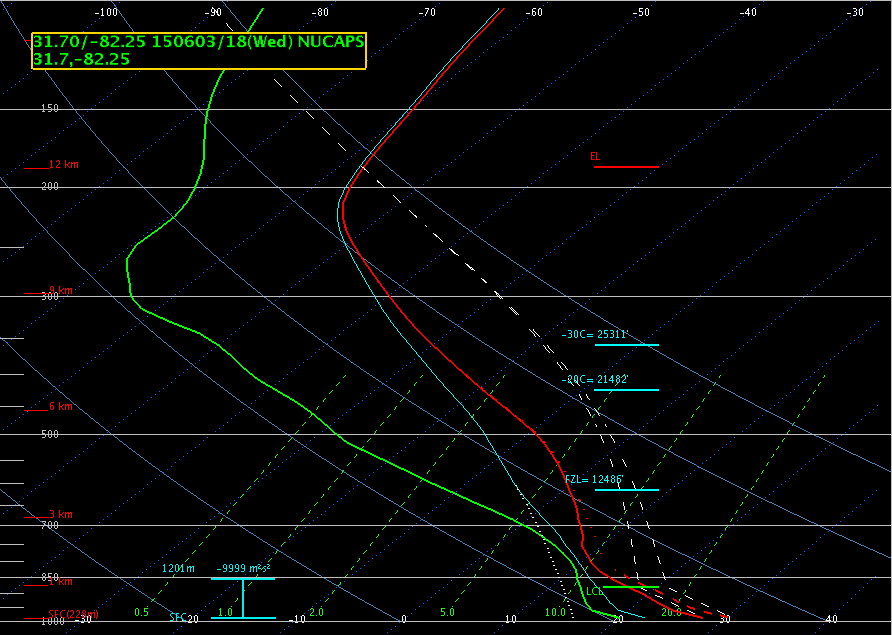
Have been waiting for deep convection to start. Denver’s 18z special sounding (Fig 1) showed a fairly robust cap around 700mb so just waiting for this to erode. The NUCAPS sounding from ~20Z (Fig 2) show the lower levels not quite fully mixed but becoming closer. Modified CAPE using the Denver metar shows >2000 J/kg. This helped build some confidence that we will see deep convection but just have to wait on a delayed start.

Fig 1: 18z Special Sounding from KDNR

Fig 2: NUCAPS sounding. Eroding Cap.
Modified a NUCAPS sounding for just downstream of the storms. It yielded a CAPE of almost 4000 J/kg. Large hail is the main threat along with tornadoes. LCLs and LFCs are low for the area, suggesting tornadogenesis will be easy for the area.
MacGyver
Noting a lot of overshooting top development on the supercells across the northern portion of the Jacksonville CWA as well as into neighboring Charleston, SC’s CWA. The overshooting top (OT) algorithm picked up two supercells across Long and Bryan counties in SC at 2030 UTC. With the current sun angle, you can see the Long county top, but not so much on the Bryan one, but the OT tool show them both well.
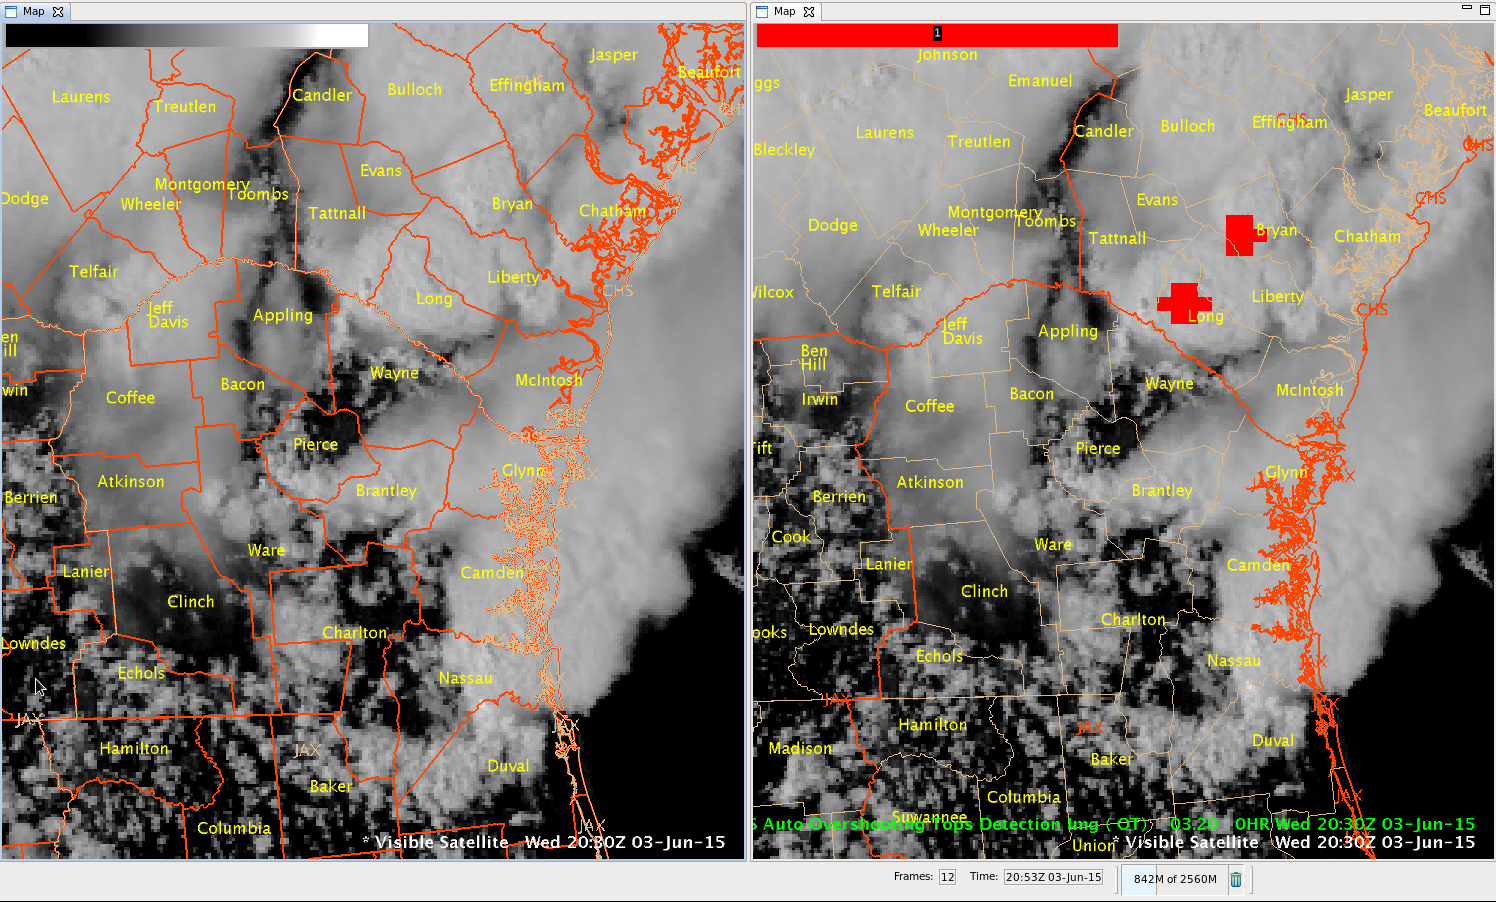
Figure 1: Supercells with overshooting tops across southern SC at 2030 UTC.
We can also use the OT tool anytime, day or night, as it is based off the IR satellite data.
CoonieCatEye
Prob severe has remained relatively low so far today. The storms have seemed to remained well behaved as well. I’m impressed with its ability to forecast the severity of storms in the short term. A very good tool for situational awareness as well.
MacGyver
While monitoring the convective initiation (CI) product on the GOES-E satellite moving east out of Telfair county, GA, an area of 66 percent increased as it moved into Jeff Davis county at 1845 UTC. By 1915Z, a supercell with an overshooting top developed across northern Jeff Davis county.
Here are the before and after images. You can see the overshooting top just above “Jeff” on the 1915 UTC image.
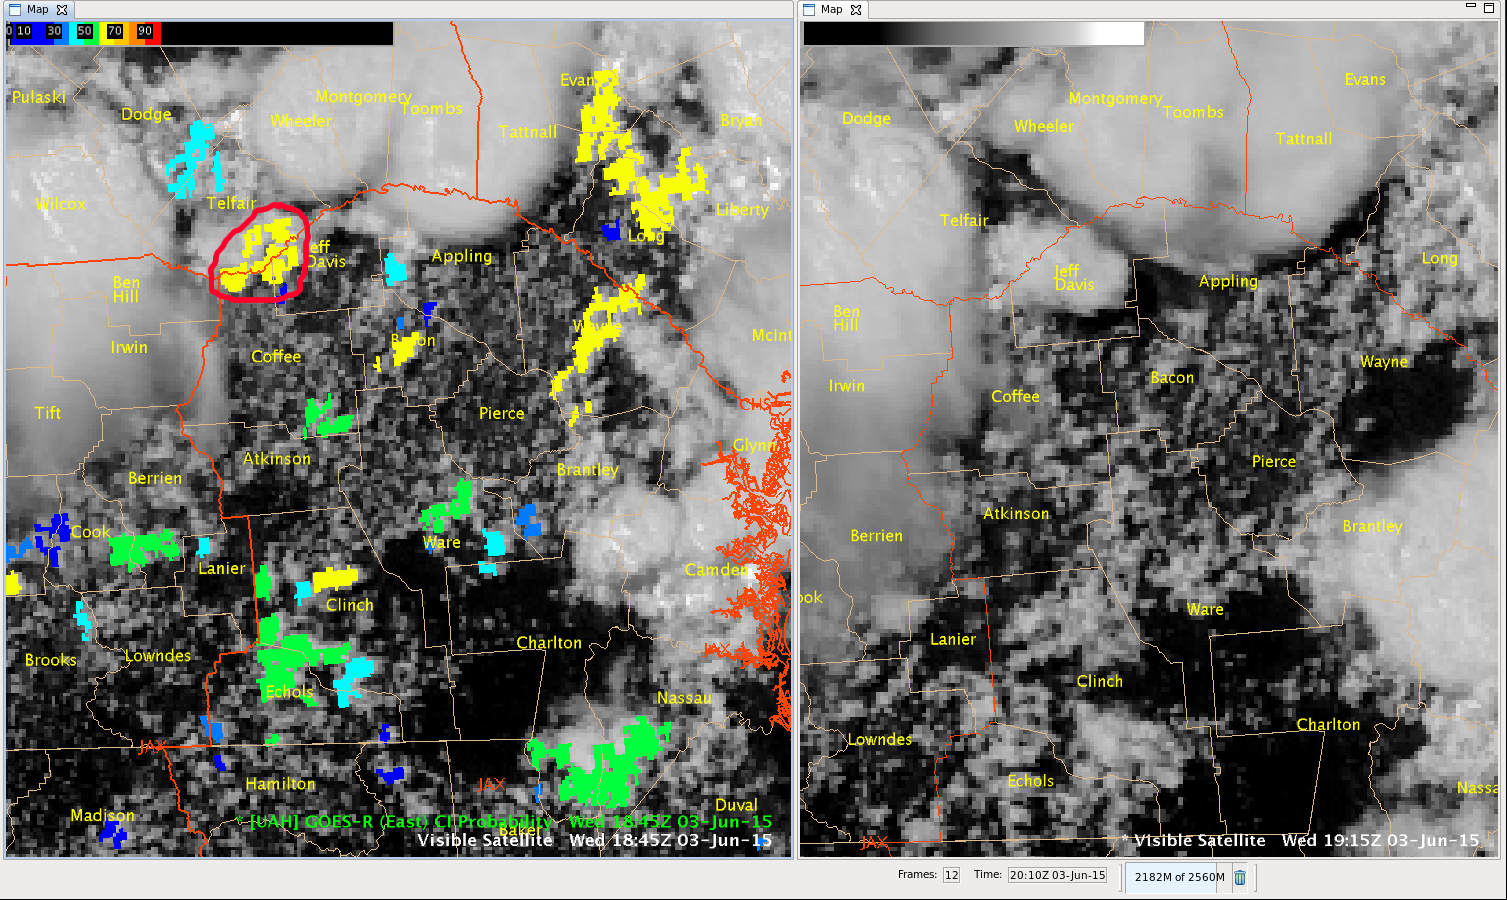
Figure 1: GOES-E satellite images at 1845 UTC (with area of CI in red circle) and 1915 UTC as the maturing supercell moves across Jeff Davis county.
Good example of how the CI tool shows where convection should initiate. Very nice looking anvil top with this cell on the 1915 UTC image.
CoonieCatEye
I took a look at the NUCAPS soundings for the locations circled in green below. Both locations had a bit of contamination from cumulus, but there wasn’t much cirrus over the areas so after modifying the T/Td of the soundings with nearby METARS, I felt that they represented the environment pretty well. In my initial environmental analysis using CIMSS and SPC data, I had noticed that moisture was higher in the northern portion of the FA. The NUCAPS soundings showed this as well with drier air aloft in the sounding from the central part of the FA versus the sounding further north. I also used the two soundings to compare the amount of instability and the sounding further north had higher CAPE than the sounding in the central part of the FA. This was consistent with my initial analysis as well.
Having the NUCAPS soundings available was important to my situational awareness in this particular case. I could see where these soundings would also be useful in other parts of the country as well. At my office in Columbia, SC, we do not have upper air and there really aren’t any upper air sites close by, so having these available would be extremely beneficial.
 NUCAPS Sounding locations
 Modified NUCAPS sounding from Appling County (northern FA).
 Modified NUCAPS sounding from Baker County (central FA).
-Helen Hunt
Was watching the ENI cell tracking and noticed that this cell dropped out even with total lightning data still producing lightning.
MacGyver
Over the past 15 minutes, we’re starting to get some reflectivity to fire west of Denver.
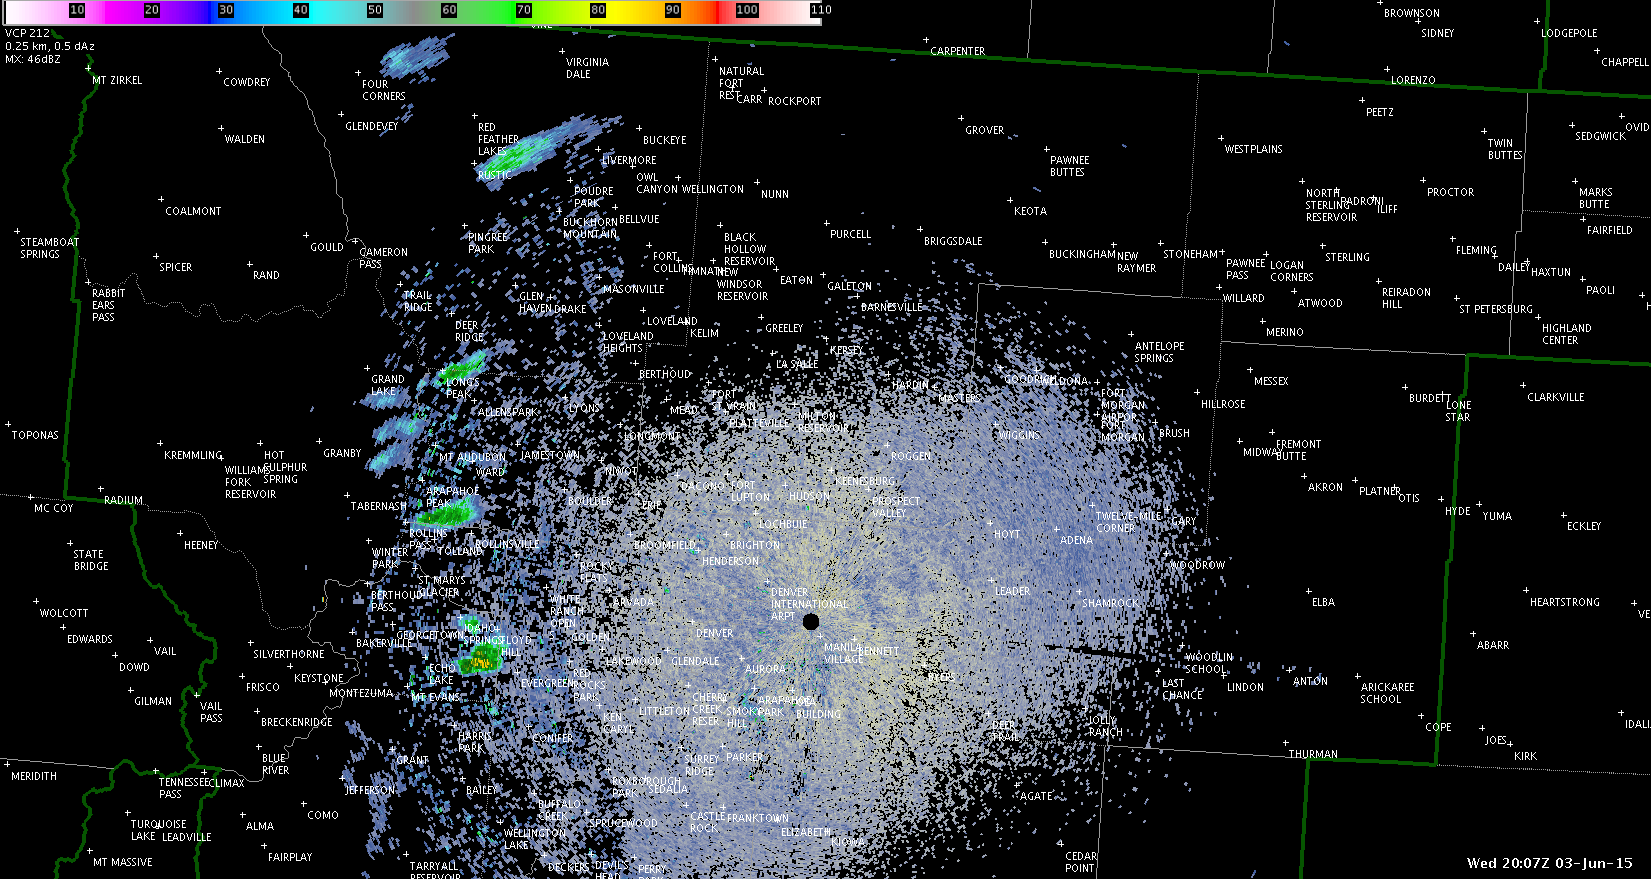
Interestingly, the CI product never flagged those (the exception would be the northernmost cell near Rustic). I wonder if it’s because the clouds had been festering for quite some time and thus never flagged them because it thought they had already initiated. Before 2000z, there was no reflectivity showing up (again, exception is the northernmost cell).
Jason Williams