
Click for loop. You can see updrafts go up and goes along with the increase in lightning on the PGLM.
Jason Williams
Official websites use .gov
A
.gov website belongs to an official government
organization in the United States.
Secure .gov websites use HTTPS
A
lock (
) or https:// means you’ve safely connected to
the .gov website. Share sensitive information only on official,
secure websites.

Click for loop. You can see updrafts go up and goes along with the increase in lightning on the PGLM.
Jason Williams
A strong thunderstorm moving slowly across Wayne county has had a history of high amounts of cloud to ground lightning. Once the ENI algorithm were able to focus on a specific polygon, the amount of total lightning was as high as 180 flashes/minute. You can see the CG lightning at 2150 UTC.

The ENI cell polygon focused on high amounts of lightning flashes and CG lightning (L). Once a point was determined, I ran to see the growth of total lightning on the ENI Time Series (R).
CoonieCatEye
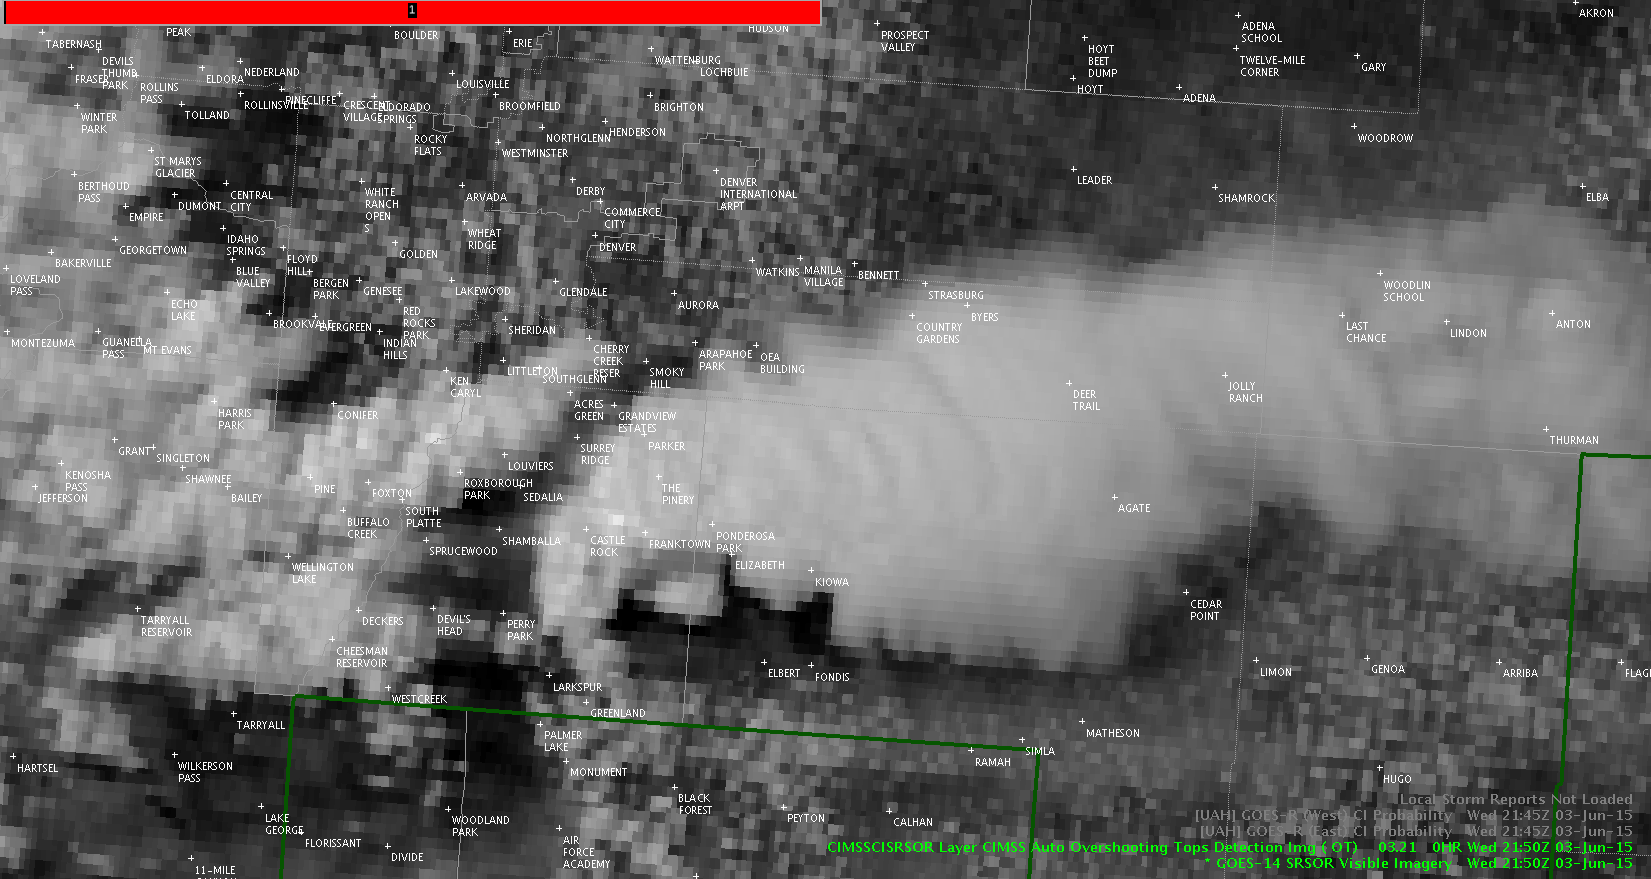
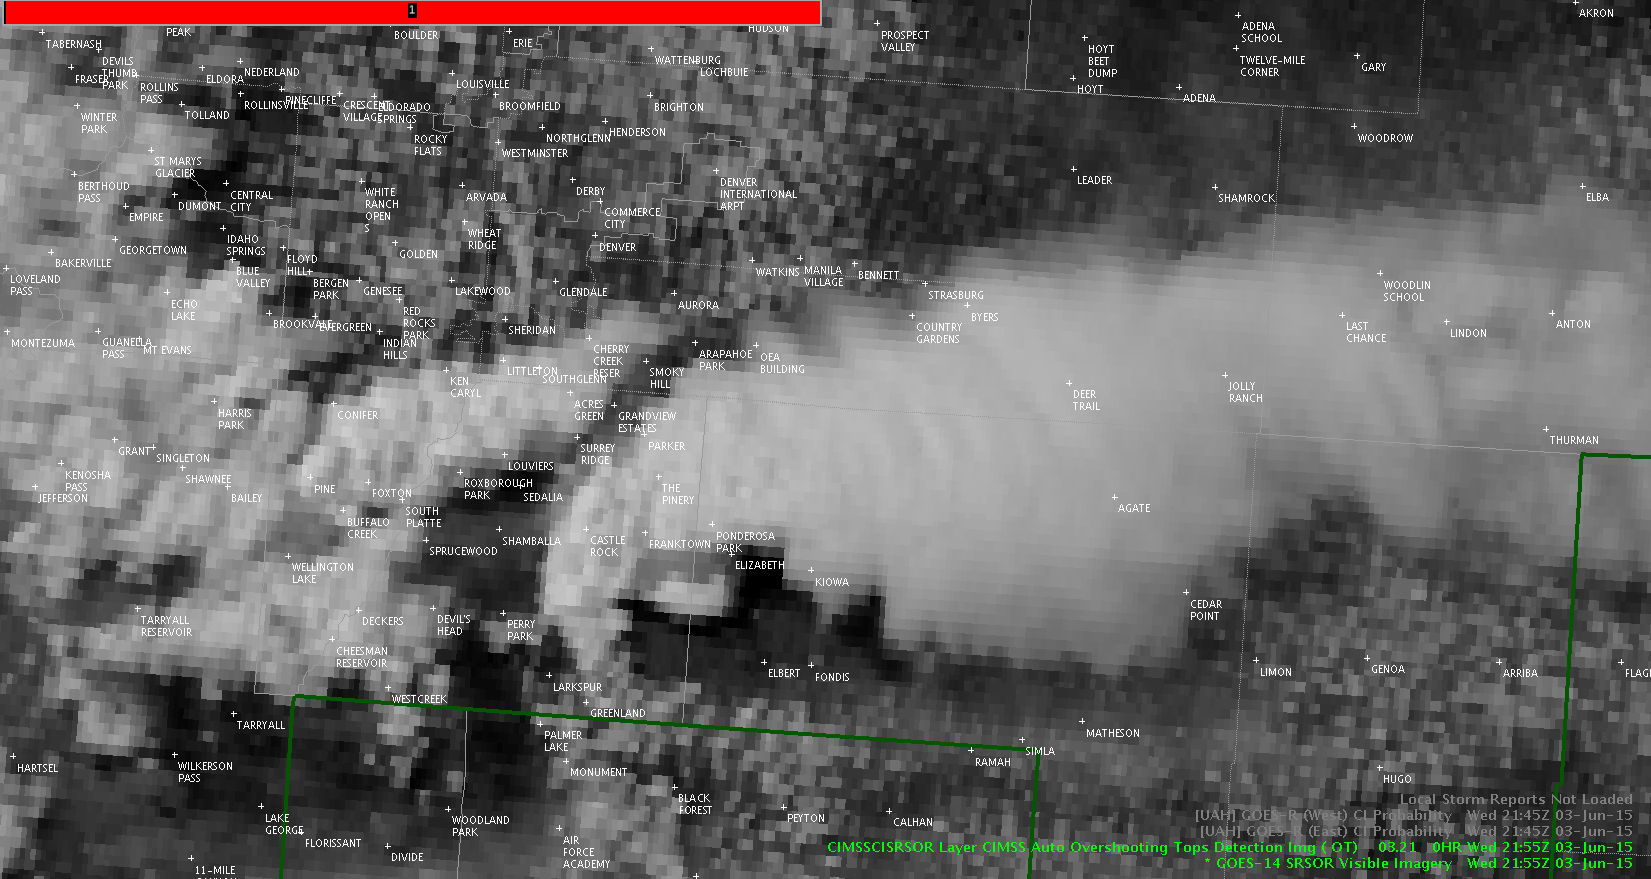
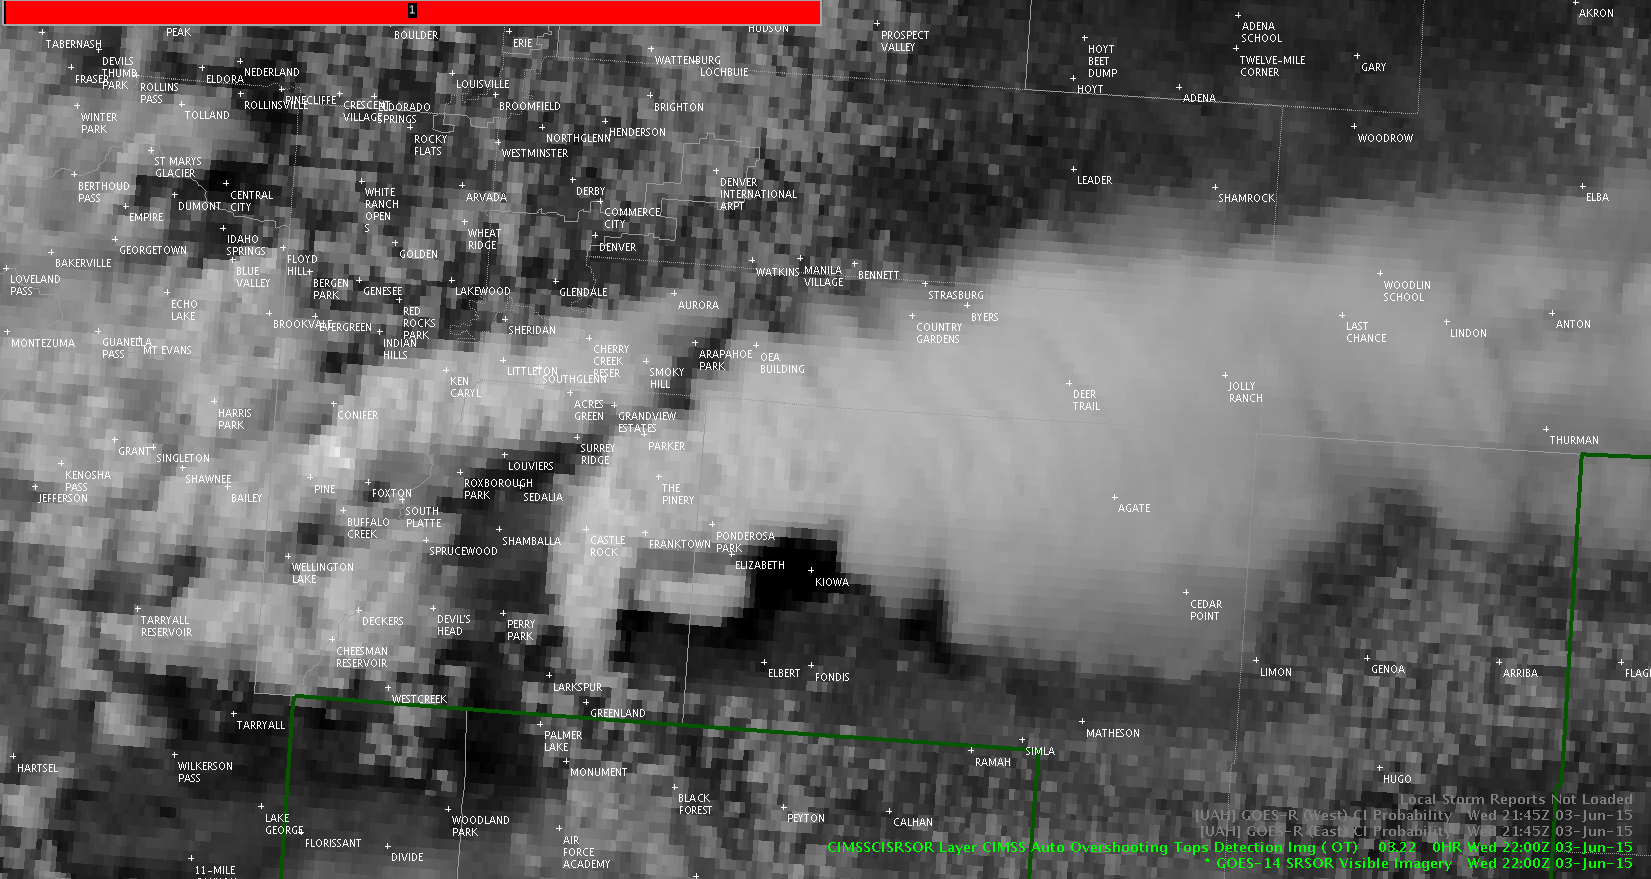
This is an example where I feel like there is so much going on with the CI product that it’s difficult to draw many solid conclusions. Looking at the zoomed out image, you can see just how many different individual areas that the CI product has picked up on. The product appears much too cluttered in this situation to really be helpful in my opinion. Even when I zoom in and focus on the highest area of CI (94% shown in red), I feel like it’s still difficult to track the development of that individual area and the nearby yellow and green areas. This is probably because the CI product and satellite imagery are every 15 min. When we get the 5 min data, I think the CI product will be much more useful.
 Zoomed Out (Click image to see animation)
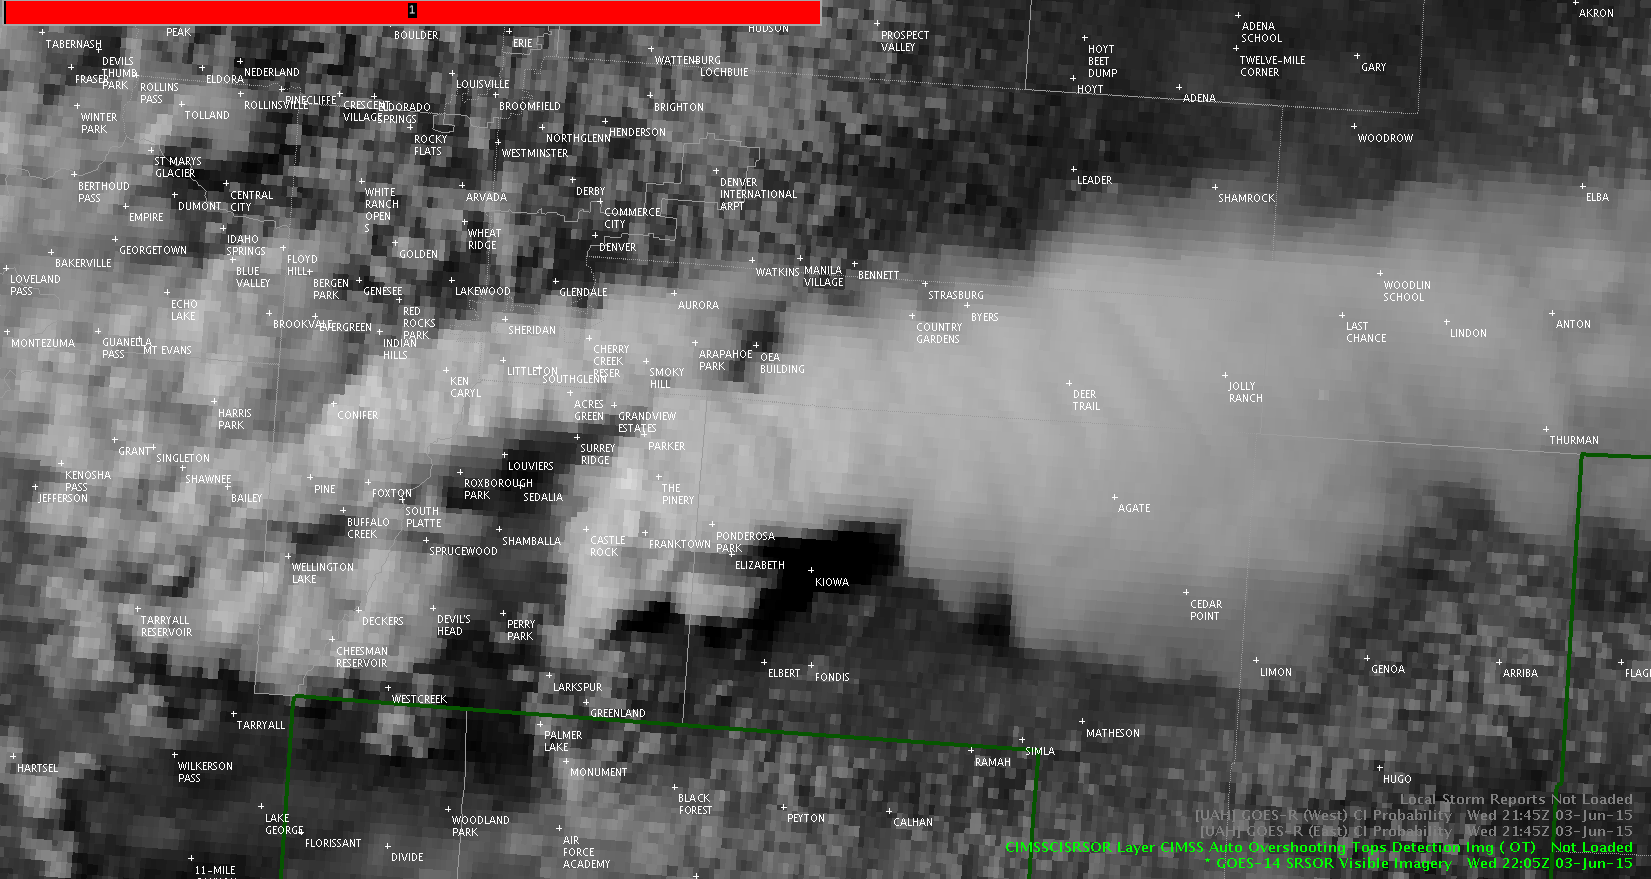
 Zoomed In (Click image to see animation)
-Helen Hunt
Lightning jump nearly coincident with yet another updraft (sat images are five minutes apart from one to another).
Radar reflectivity increased shortly thereafter. An aside: MRMS VII also jumped.
Jason Williams
Mid afternoon radar interrogation on CYS radar has shown left moving cells the most dominant cases in splitting situations. A cell exiting the CYS county warning area to the north has shown high reflectivity aloft along with high total lightning flash rate. CIMSS probability of severe earlier peaked at the highest value so far today over 80 percent with MESH of 1.05 inches.
John Pendergrast
Click for loop – you can see another updraft shoot up on the west side of the storm.
Jason Williams
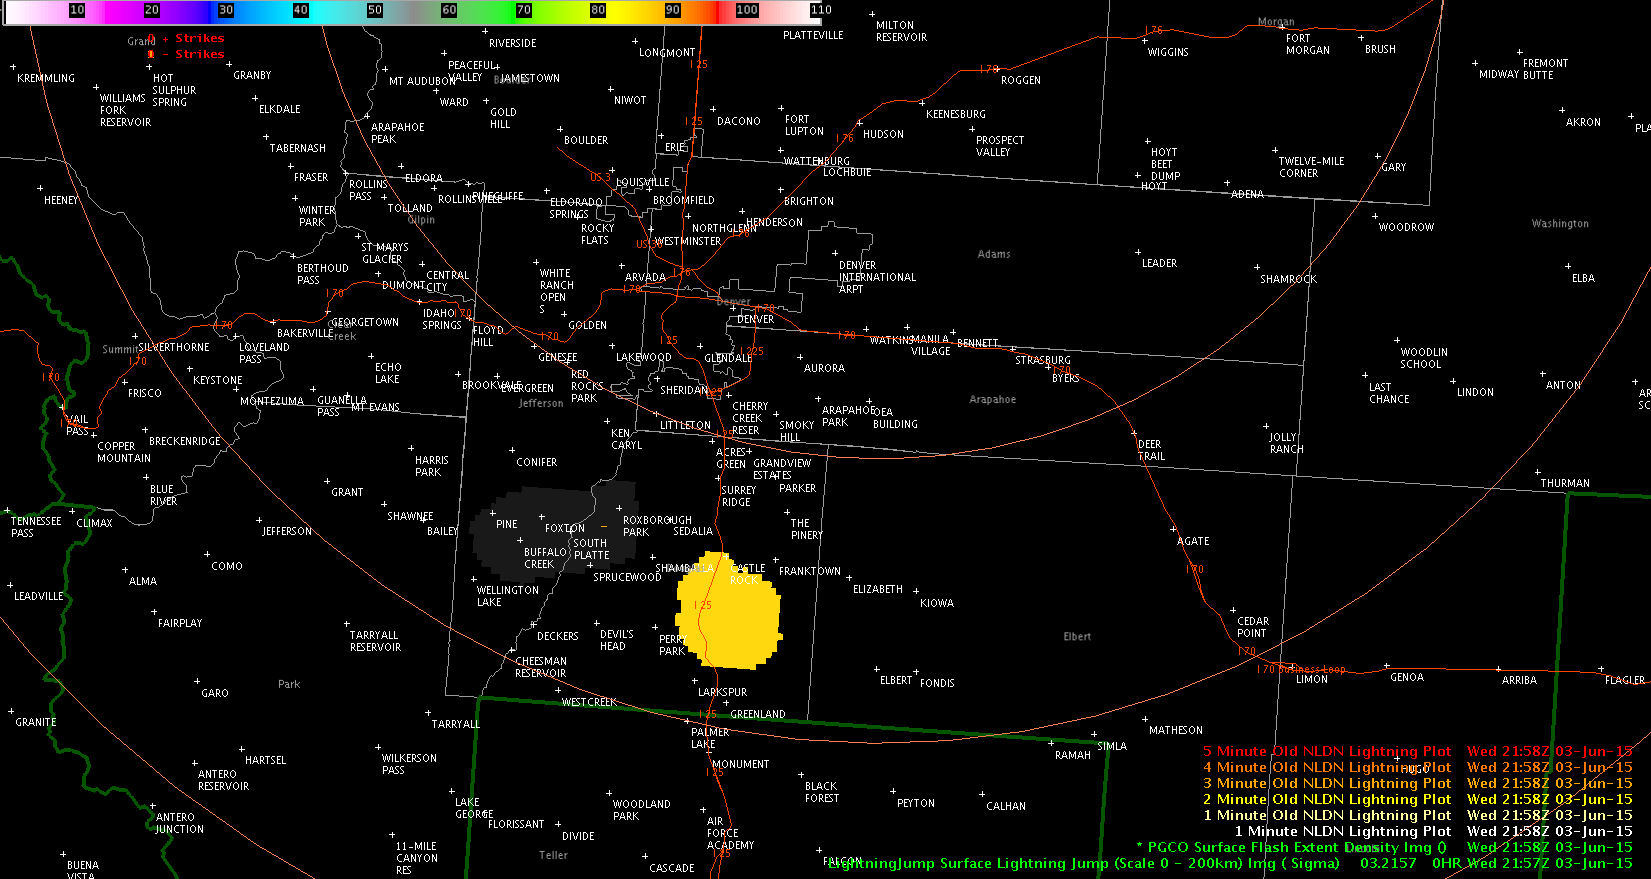
Issued 1st SVR for Boulder, CO. CI did not show any indication that this cell would develop. Have a feeling that it may have been identified earlier as weaker pulse cells tried earlier in the day to form but did not re-identify it (Algorithm possibly thought convection already occurred?)
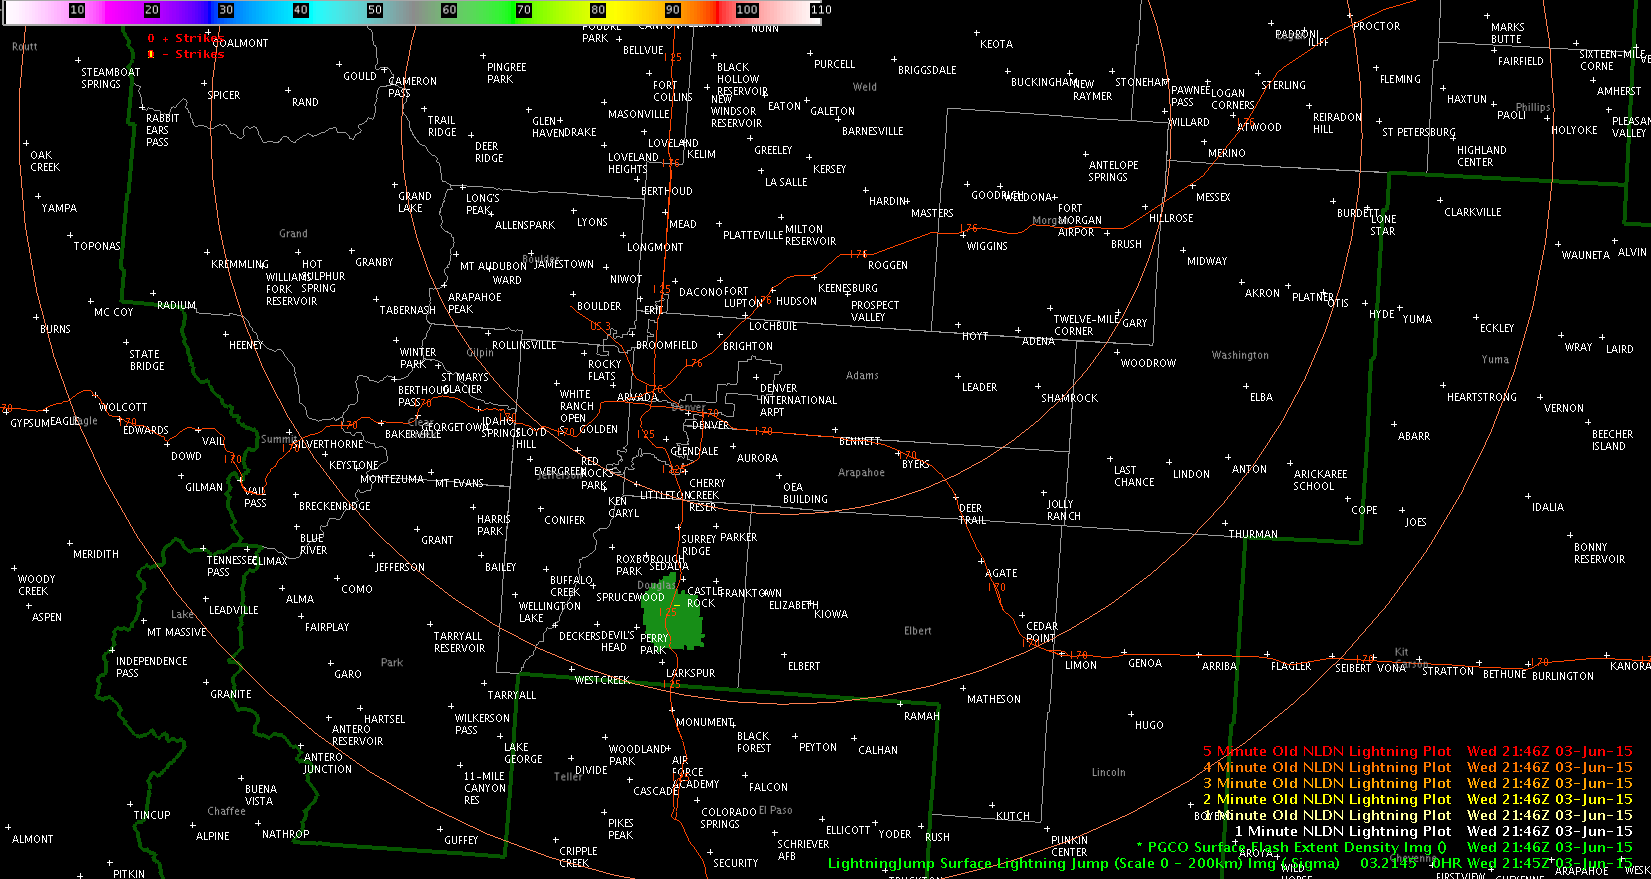
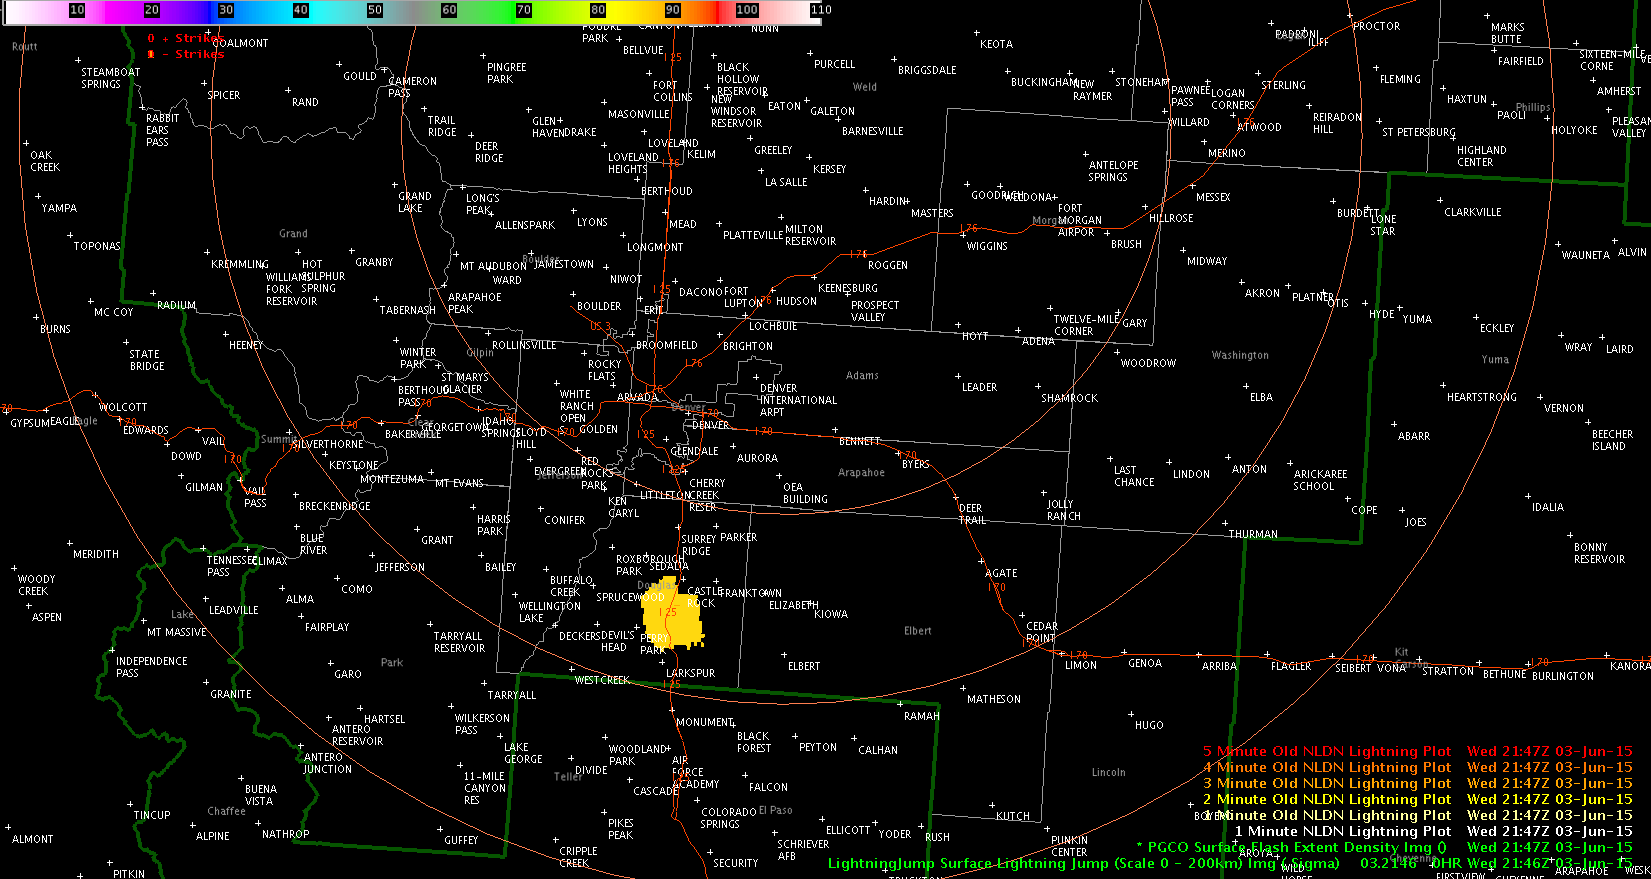
Basis for warning was made solely from traditional radar interrogation (mid-level meso, TBSS (fig 1), 55dbz above 30kft, supercell shape). ProbSevere only showed impressive values after the warning decision was made. (ProbSevere=82%, MESH=1.0, Lightning Jump 2.0 sigma (fig 2)). We were not using ENI at this workstation. Overall, only 5 CG strike were shown on NLDN during the intensification. In this case, the experimental products served as a confidence builder. The pGLM data was not working at this time. Did receive a report of half-dollar size hail at 2135z. –Cattywampus

Fig 1: 2120z TBSS visible w/ super-cell shape developing.
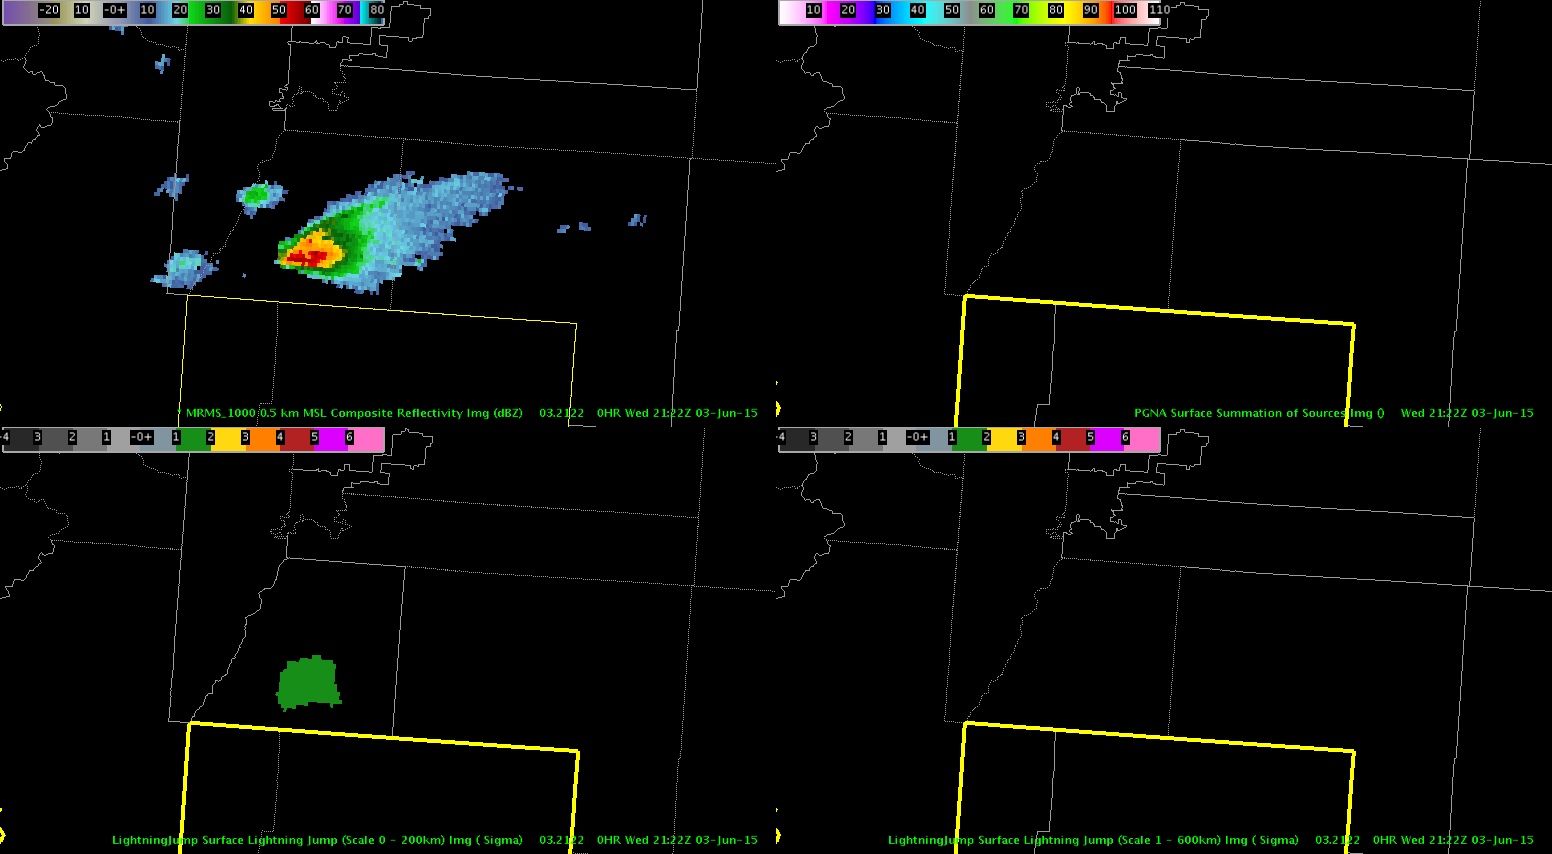
Fig 2: 2122z Sigma 2 jump occuring
This is a case where having the 1-min satellite imagery would have been beneficial, but unfortunately it was unavailable in the Jacksonville FA. The radar reflectivity loop shows how convection developed along the outflow boundary in southwestern Duval County. Looking at the visible satellite imagery that was available, I really couldn’t gather much information because of the large time gaps. The gaps between satellite images were even larger than the normal 15 minutes in this case due to a problem with AWIPS2. If I had the 1 minute imagery, I probably would have been able to see the growing cumulus and would have better anticipated the cell that developed over southwestern Duval County.
 (Click image to see animation)
 (Click image to see animation)
-Helen Hunt
ProbSevere consistently climbed with this first storm. When we got to 74% severe we issued a warning for the storm based on hail. The ENI total lightning data jumped as well suggesting that there is a lot more ice with this storm.
MacGyver and John Pendergrast
Click for loop.
1 min vis shows the general flow of the cu field to the west, but the clouds to the south of the supercell show the strong inflow as they make a hard turn north.

Jason Williams